# Understanding Syllogistic Reasoning in LLMs from Formal and Natural Language Perspectives
**Authors**: Aheli Poddar, Saptarshi Sahoo, Sujata Ghosh
## Abstract
We study syllogistic reasoning in LLMs from the logical and natural language perspectives. In process, we explore fundamental reasoning capabilities of the LLMs and the direction this research is moving forward. To aid in our studies, we use 14 large language models and investigate their syllogistic reasoning capabilities in terms of symbolic inferences as well as natural language understanding. Even though this reasoning mechanism is not a uniform emergent property across LLMs, the perfect symbolic performances in certain models make us wonder whether LLMs are becoming more and more formal reasoning mechanisms, rather than making explicit the nuances of human reasoning.
Code — https://github.com/XAheli/Logic-in-LLMs
## 1 Introduction
With the unprecedented development of large language models (LLMs) in recent years that have made them resemble human speakers and reasoners to a great extent in many levels (holliday2024conditional; bubeck2023ece; zhao2023survey), the reasoning capabilities of LLMs have increased manifold. To motivate such growth, the question we generally ask an LLM is to what extent the LLM has grasped logical reasoning in its different forms, for example, see (holliday2024conditional; borazjanizadeh2024reliable; sambrotta2025llms). In contrast, the motivation for this study is somewhat distinct in nature in that we wonder whether developing LLM to have excellent logical reasoning capabilities is fruitful in the long run, as having such features does not bring an LLM closer to mimicking human reasoning. As a case in point, we consider syllogistic reasoning from a formal as well as natural language viewpoint.
Evidently, humans are far from logical when it comes to reasoning, and they are often influenced by their past experiences and knowledge, for example, consider the belief-bias effect (evans1983conflict): People doing syllogistic reasoning are often influenced by the believability of the conclusion. In fact, it is shown by (lewton2016relationship) that individuals with autistic traits show less belief-bias effect than typical individuals. In this scenario, one might consider to check whether LLM reasoning is close to human reasoning by studying the belief-bias effect on the LLMs, and the present work studies this question. We note that (eisape2024systematic) studied a similar question, but their methodology is quite different from ours. Before describing the exact contribution of this work, let us discuss some recent work on syllogistic reasoning in LLMs.
A novel framework dealing with legal syllogistic reasoning is provided in (zhang2025syler). In this work, the LLMs are empowered to provide explicit and trustworthy legal reasoning by integrating a retrieval mechanism with reinforcement learning. A mechanistic interpretation of syllogistic reasoning is provided in (kim2025reasoning). This work deals with belief-biases as well and it is shown that such biases contaminate the reasoning mechanisms. In (zong2024categorical), the authors make a detailed survey on the reasoning capabilities of LLMs with respect to categorical syllogisms.
This work makes several key contributions to understanding syllogistic reasoning in LLMs from both formal and natural language perspectives. We introduce a novel dual ground truth framework that evaluates each syllogism on two separate dimensions: syntactic validity (does the conclusion logically follow?) and natural language believability (is the conclusion intuitively plausible?). These two dimensions may align or conflict with each other, enabling us to assess formal reasoning capabilities independently from natural language understanding. Through a comprehensive empirical study, we systematically evaluated 14 state-of-the-art LLMs across four prompting strategies and three temperature settings on carefully constructed syllogisms covering diverse logical structures and belief-bias conditions. Our analysis reveals that the majority of models exhibit a significant measure of belief bias; in other words, they perform better on certain kinds of problem (where logic aligns with intuition) than others. We further uncover a substantial gap between syntactic and natural language understanding accuracy, demonstrating that current LLMs excel at formal logical structure while struggling with natural language plausibility judgments—a pattern opposite to human reasoning tendencies. Contrary to conventional wisdom, we find that few-shot prompting degrades performance compared to zero-shot, and that reasoning capability depends critically on architectural choices rather than raw parameter count. These findings raise a fundamental question: Are LLMs evolving into formal reasoning engines that surpass human-like reasoning with its inherent biases?
The remainder of the paper is structured as follows. Section § 2 provides a brief overview of syllogisms. Section § 3 delves into the experimental details, including the models, data, overall methodology, prompting variants, and evaluation metrics. Section § 4 reports on the findings and their interpretations. Section § 6 provides a discussion of the limitations of our study, and Section § 7 concludes the article.
## 2 On Syllogisms
The concept of syllogism was first introduced by Aristotle (smith1989prior), and as observed by Robin Smith (smith2017logic), a syllogism in modern logic consists of three subject-predicate propositions, two premises, and a conclusion, and whether or not the conclusion follows from the premises. An example of syllogism is as follows: “No footballer is a swimmer; Some swimmers are gardeners; Therefore, some gardeners are not footballers.” When terms like footballer or swimmer are replaced by generic terms like B, C and D, we can rewrite the above premises by: “No B is C; Some C are D.” A conclusion relates the non-shared terms, for example, “Some D are not B”.
In the literature, various types of syllogisms are studied, categorical, conditional, and others (copi2016introduction). In this work, we mostly concentrate on categorical syllogisms, but we consider a few others as well. The statements of a categorical syllogism look like the following: Quantifier (Subject) Copula (Predicate), which take four standard forms, viz.
- Universal Affirmative (A): All S are P, i.e., $S\subseteq P$ .
- Universal Negative (E): No S is P, i.e., $S\cap P=\emptyset$ .
- Particular Affirmative (I): Some S is P, i.e., $S\cap P\neq\emptyset$ .
- Particular Negative (O): Some S is not P, i.e., $S\setminus P\neq\emptyset$ .
Here, S is the subject and P is the predicate. S and P are generally termed variables, and these quantifier styles, namely, A, E, I, O, are called ‘moods’. The variables may change their orders, leading to new premises. As mentioned earlier, one of the three variables used in a syllogism is not there in the conclusion, and evidently the variable is common to both premises. Depending on the placement of the common variable (C, say) that does not occur in the conclusion, we get four types of figures for syllogisms. See Table 1 for a detailed description.
| 1 | 2 | 3 | 4 |
| --- | --- | --- | --- |
| B-C | C-B | B-C | C-B |
| C-D | D-C | D-C | C-D |
Table 1: A description of the four figures for syllogisms containing the variables B, C, and D.
We should note here that, in statements of type A, ‘All’ is sometimes overlooked for the sake of simplicity. The following example clarifies the point: “All vehicles have wheels; Boats are vehicles / A boat is a vehicle; Therefore, boats have wheels / a boat has wheels.”
A syllogism is said to be valid if the truth of the premises implies the truth of the conclusion. A way to check the validity of a syllogism is by converting the statements in a suitable first order language and check the validity there. The other way is through enumerating each case (there will be some finite number of cases where the two premises will have one of the four forms A, E, I or O) and then using standard Venn Diagram techniques to fix the conclusion. Thus, when a new tuple of syllogism comes in, the job of checking validity boils down to just checking the instance from the already defined cases and to conclude from it.
A syllogism is said to be believable if the conclusion of the syllogism is actually true. For this case, the logical argument does not play any role. The main goal of this research work is two-fold. On one hand, we would like to check how accurately the LLMs can do syllogistic reasoning, and on the other hand we would like to check whether context and real world knowledge play any role in their reasoning processes. To this end, the following four categories of syllogisms play a significant role, namely (i) valid-believable, (ii) valid-unbelievable, (iii) invalid-believable, and (iv) invalid-unbelievable. These distinct types are summarized in Table 2, given in (brauner2025understanding), which provides an example for each such type of syllogism.
| | Believable | Unbelievable |
| --- | --- | --- |
| Valid | All birds have feathers | All mammals walk |
| Robins are birds | Whales are mammals | |
| Therefore robins have feathers | Therefore whales walk | |
| Invalid | All flowers need water | All insects need oxygen |
| Roses need water | Mice need oxygen | |
| Therefore roses are flowers | Therefore mice are insects | |
Table 2: Example syllogisms illustrating the four categories described in § 2.
## 3 Experiments
We conduct a systematic evaluation of syllogistic reasoning capabilities across diverse language models, examining the effects of prompting strategies, temperature settings, and content variations on logical inference accuracy. Our experimental design encompasses 168 unique configurations (14 models $\times$ 4 strategies $\times$ 3 temperatures), enabling comprehensive analysis of factors influencing LLM syllogistic reasoning performance.
### 3.1 Models
We evaluated syllogistic reasoning capabilities in 14 large language models spanning 8 organizations, listed in Table 3. The Google Gemini models were accessed through Google AI Studio APIs. https://ai.google.dev/gemini-api/docs All remaining models were accessed via the HuggingFace Inference API https://huggingface.co/docs using the :cheapest routing for automatic provider selection. Total API costs for all experiments were approximately $ 500 Our model selection prioritized four criteria: (1) organizational diversity to capture different development philosophies, (2) parameter scale range (1B to 671B) to assess scaling effects, (3) architectural variety including dense transformers and Mixture-of-Experts (MoE) systems, and (4) API reproducibility.
### 3.2 Data and Methodology
#### Dataset Construction
For our experiments, we constructed a benchmark of 160 syllogisms, mostly categorical, adapted from the cognitive science and psychology literature on human syllogistic reasoning (solcz2008role; lewton2016relationship).
We began with 40 base syllogisms, each handcrafted to cover different syllogistic figures and validity conditions. To isolate the effects of logical structure from natural languagecontent, given our dual ground truth annotations, we created three additional variants for each base syllogism. The nonsense variant (X) replaces meaningful predicates with abstract terms (e.g., “blargs”, “zimons”, “glorps”), testing pure logical reasoning without natural language interference. The order-switched variant (O) reverses the order of presentation of the premises to test the sensitivity to the structure of the argument. The combined variant (OX) applies both modifications, providing a comprehensive robustness assessment.
For example, the normal variant “All calculators are machines; All computers are calculators; Therefore, some machines are not computers” becomes “All blargs are zimons; All glorps are blargs; Therefore, some zimons are not glorps” in its nonsense form. We reviewed all stimuli and made necessary adjustments by hand to ensure grammatical correctness and logical equivalence across variants.
#### Dual Ground Truth
<details>
<summary>x1.png Details</summary>
### Visual Description
## Heatmap: AI Model Accuracy Across Prompting Strategies
### Overview
This image is a heatmap chart comparing the performance of 13 different large language models (LLMs) across four distinct prompting strategies. The performance metric is accuracy, presented as a percentage. The chart uses a color gradient from dark purple (low accuracy, ~50%) to bright yellow (high accuracy, 100%) to visually represent the data.
### Components/Axes
* **Y-Axis (Vertical):** Labeled "Model". It lists 13 AI models from top to bottom.
* Gemini 2.5 Flash
* Gemini 2.5 Pro
* GPT-OSS-20B
* GLM-4.6
* Kimi-K2-Instruct
* DeepSeek V3.1
* Gemini 2.5 Flash Lite
* Qwen3-Next 80B A3B Instruct
* Qwen3-Next 80B A3B Thinking
* Llama 3.3 70B Instruct
* Gemma 3 27B IT
* Llama 3.1 8B Instruct
* Llama 3.2 3B Instruct
* Llama 3.2 1B Instruct
* **X-Axis (Horizontal):** Labeled "Prompting Strategy". It lists four strategies from left to right.
* Zero-Shot
* One-Shot
* Few-Shot
* Zero-Shot CoT (Chain-of-Thought)
* **Legend/Color Scale:** Located on the right side, labeled "Accuracy (%)". It is a vertical color bar with numerical markers at 50, 60, 70, 80, 90, and 100. The gradient runs from dark purple at 50% to bright yellow at 100%.
### Detailed Analysis
The following table reconstructs the accuracy data from the heatmap. Values are read directly from the cells.
| Model | Zero-Shot | One-Shot | Few-Shot | Zero-Shot CoT |
| :--- | :--- | :--- | :--- | :--- |
| **Gemini 2.5 Flash** | 100.0 | 100.0 | 100.0 | 98.3 |
| **Gemini 2.5 Pro** | 99.2 | 100.0 | 100.0 | 98.1 |
| **GPT-OSS-20B** | 99.6 | 99.8 | 100.0 | 97.3 |
| **GLM-4.6** | 98.5 | 98.8 | 100.0 | 98.3 |
| **Kimi-K2-Instruct** | 95.4 | 94.2 | 96.5 | 97.9 |
| **DeepSeek V3.1** | 96.7 | 91.5 | 96.7 | 98.5 |
| **Gemini 2.5 Flash Lite** | 88.3 | 90.6 | 81.7 | 95.0 |
| **Qwen3-Next 80B A3B Instruct** | 76.9 | 73.3 | 68.5 | 98.8 |
| **Qwen3-Next 80B A3B Thinking** | 84.4 | 65.6 | 52.5 | 88.1 |
| **Llama 3.3 70B Instruct** | 69.8 | 76.9 | 75.6 | 57.1 |
| **Gemma 3 27B IT** | 69.4 | 73.5 | 62.7 | 67.9 |
| **Llama 3.1 8B Instruct** | 68.3 | 74.4 | 61.5 | 53.1 |
| **Llama 3.2 3B Instruct** | 59.0 | 59.8 | 65.6 | 52.3 |
| **Llama 3.2 1B Instruct** | 52.3 | 52.3 | 47.3 | 55.6 |
**Trend Verification by Model (Visual Description):**
* **Top Tier (Gemini 2.5 Flash/Pro, GPT-OSS-20B, GLM-4.6):** These models show consistently high accuracy (bright yellow) across all strategies, with values near or at 100%. Their performance is stable, with only minor dips in the "Zero-Shot CoT" column for some.
* **Mid Tier (Kimi-K2, DeepSeek V3.1, Gemini 2.5 Flash Lite):** These models display a mix of yellow and green cells. DeepSeek V3.1 shows a notable dip in "One-Shot" (91.5) but recovers in other strategies. Gemini 2.5 Flash Lite has its lowest score in "Few-Shot" (81.7).
* **Variable Performance (Qwen3-Next models):** The "Instruct" variant shows a clear downward trend from left to right (76.9 -> 73.3 -> 68.5) before a dramatic spike to 98.8 in "Zero-Shot CoT". The "Thinking" variant shows a steep decline to a low of 52.5 in "Few-Shot" before recovering to 88.1.
* **Lower Tier (Llama & Gemma models):** These models are represented by green, blue, and purple cells, indicating lower accuracy. Most show a pattern of moderate performance in "One-Shot" or "Few-Shot" but a significant drop in "Zero-Shot CoT", with the exception of the smallest Llama 3.2 1B model.
### Key Observations
1. **Dominant Models:** Gemini 2.5 Flash and Gemini 2.5 Pro achieve perfect or near-perfect scores (100.0, 99.2) in multiple strategies.
2. **Strategy Impact:** The "Zero-Shot CoT" strategy has a polarizing effect. It boosts the accuracy of the Qwen3-Next 80B A3B Instruct model to 98.8 (from 68.5 in Few-Shot) but severely degrades the performance of several Llama models (e.g., Llama 3.3 70B drops to 57.1).
3. **Performance Floor:** The lowest accuracy recorded is 47.3% for Llama 3.2 1B Instruct using the "Few-Shot" strategy.
4. **Model Size Correlation:** There is a general, though not perfect, correlation between model size/name and performance. The larger, more advanced models (Gemini 2.5, GPT-OSS, GLM) occupy the top rows with yellow cells, while smaller models (Llama 3.2 1B/3B) are at the bottom with cooler colors.
### Interpretation
This heatmap provides a comparative snapshot of LLM capabilities on a specific (but unnamed) task or benchmark. The data suggests several key insights:
* **Model Superiority:** The Gemini 2.5 series (Flash and Pro) demonstrates exceptional and robust performance, maintaining near-perfect accuracy regardless of the prompting method. This indicates strong underlying capability and less sensitivity to prompt engineering for this task.
* **Prompting Strategy is Not One-Size-Fits-All:** The effectiveness of a prompting strategy is highly model-dependent. While "Zero-Shot CoT" is a powerful technique for unlocking the reasoning potential of the Qwen3-Next Instruct model, it appears to confuse or hinder the Llama 3.x Instruct models on this task. This highlights the critical need for model-specific evaluation.
* **The "Thinking" Variant's Volatility:** The Qwen3-Next 80B A3B Thinking model shows the most dramatic variance, with accuracy swinging from 84.4% to 52.5% and back to 88.1%. This suggests its "thinking" process may be highly specialized or unstable across different prompt contexts.
* **Task Complexity Inference:** The fact that even the smallest model (Llama 3.2 1B) achieves over 50% accuracy in most strategies suggests the underlying task may not be extremely difficult, or it may be a task where memorization plays a role. However, the perfect scores of the top models indicate a clear performance ceiling exists.
In summary, the chart is a tool for benchmarking, showing that raw model size and architecture interact in complex ways with prompting techniques to determine final accuracy. It argues for empirical testing when selecting a model and prompt strategy for a specific application.
</details>
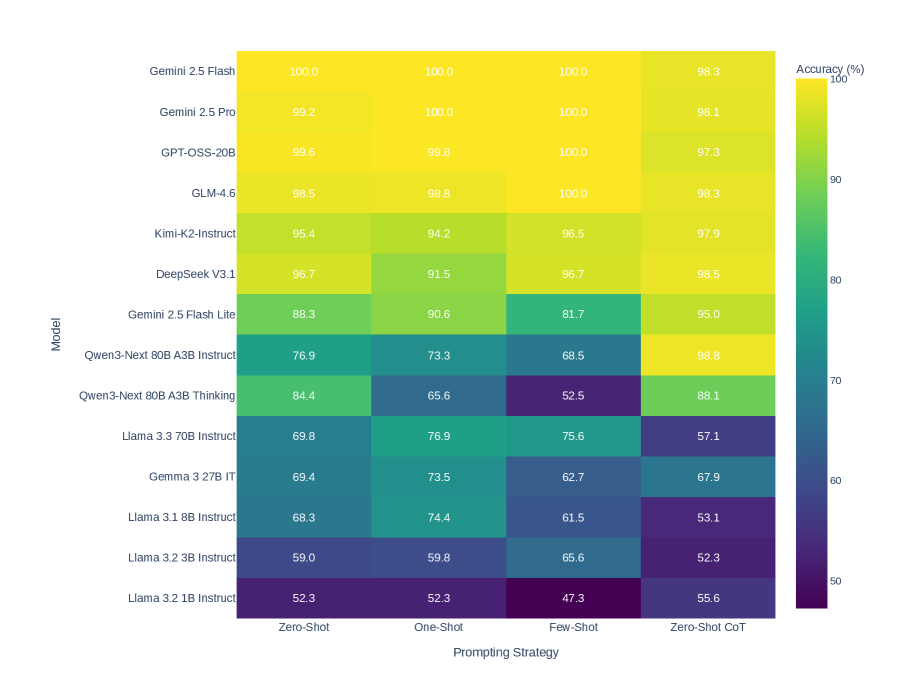
Figure 1: Heatmap of model accuracy across four prompting strategies (Zero-shot, One-shot, Few-shot, Zero-shot Chain-of-Thought). Despite few-shot showing significant mean decline ( $\Delta=-3.57$ pp, $p=0.0165^{*}$ ), systematic patterns across models remain minimal, indicating strategy effects are model-specific rather than universal.
Each syllogism carries two independent ground truth annotations, enabling orthogonal evaluation of logical reasoning and natural language processing. The syntactic validity label (valid/invalid) indicates whether the conclusion logically follows from the premises according to formal syllogistic rules, independent of content truth. The natural language understanding (NLU) label (believable/unbelievable) indicates whether the conclusion is intuitively plausible given real-world knowledge, independent of logical structure.
The dataset comprises 76 valid syllogisms (47.5%) and 84 invalid syllogisms (52.5%). For believability, 38 instances (23.8%) have believable conclusions while 122 (76.2%) have unbelievable or abstract conclusions. This asymmetry reflects the inclusion of nonsense variants, which by design have semantically neutral conclusions.
<details>
<summary>x2.png Details</summary>
### Visual Description
## Horizontal Dumbbell Chart: AI Model Accuracy on Congruent vs. Incongruent Tasks
### Overview
This image is a horizontal dumbbell chart comparing the performance of 14 different large language models (LLMs) on two types of tasks: "Congruent (Easier)" and "Incongruent (Harder)". The chart visualizes the accuracy percentage for each task type per model and highlights the performance gap (delta) between them.
### Components/Axes
* **Chart Type:** Horizontal Dumbbell Chart (also known as a Connected Dot Plot).
* **Y-Axis (Vertical):** Lists 14 AI model names. From top to bottom:
1. Llama 3.2 3B Instruct
2. Llama 3.3 70B Instruct
3. Qwen3-Next 80B A3B Thinking
4. Llama 3.2 1B Instruct
5. Llama 3.1 8B Instruct
6. Gemini 2.5 Flash Lite
7. DeepSeek V3.1
8. Kimi-K2-Instruct
9. GLM-4.6
10. Gemini 2.5 Pro
11. Gemini 2.5 Flash
12. GPT-OSS-20B
13. Qwen3-Next 80B A3B Instruct
14. Gemma 3 27B IT
* **X-Axis (Horizontal):** Labeled "Accuracy (%)". Scale runs from 0 to 100 with major tick marks at 0, 20, 40, 60, 80, and 100. Text labels "Low Accuracy", "Medium", and "High Accuracy" are placed below the axis at approximately the 10%, 50%, and 90% positions, respectively.
* **Legend:** Positioned at the top center.
* A red circle is labeled "Incongruent (Harder)".
* A blue circle is labeled "Congruent (Easier)".
* **Data Representation:** For each model, a red dot (Incongruent) and a blue dot (Congruent) are plotted on the accuracy scale. A horizontal bar connects the two dots. The numerical difference (delta, Δ) between the two accuracy values is displayed in the middle of this bar.
* **Delta Color Coding:** The delta values are colored:
* **Red:** Indicates the Congruent (blue dot) accuracy is higher than the Incongruent (red dot) accuracy. This is the case for the top 8 models.
* **Green:** Indicates the Incongruent (red dot) accuracy is higher than the Congruent (blue dot) accuracy. This is the case for the bottom 2 models (Qwen3-Next 80B A3B Instruct and Gemma 3 27B IT).
* **Yellow/Orange:** Used for models with very small deltas (Gemini 2.5 Flash Lite, DeepSeek V3.1, Kimi-K2-Instruct).
* **Teal:** Used for models with extremely small deltas (GLM-4.6, Gemini 2.5 Pro, Gemini 2.5 Flash, GPT-OSS-20B).
### Detailed Analysis
**Data Series & Values (Approximate, read from chart):**
| Model | Incongruent (Red Dot) Accuracy | Congruent (Blue Dot) Accuracy | Delta (Δ) | Delta Color |
| :--- | :--- | :--- | :--- | :--- |
| Llama 3.2 3B Instruct | ~35% | ~82% | Δ46.9% | Red |
| Llama 3.3 70B Instruct | ~53% | ~85% | Δ31.6% | Red |
| Qwen3-Next 80B A3B Thinking | ~58% | ~86% | Δ28.0% | Red |
| Llama 3.2 1B Instruct | ~42% | ~63% | Δ20.8% | Red |
| Llama 3.1 8B Instruct | ~57% | ~70% | Δ12.9% | Red |
| Gemini 2.5 Flash Lite | ~83% | ~96% | Δ12.5% | Yellow |
| DeepSeek V3.1 | ~92% | ~99% | Δ7.0% | Yellow |
| Kimi-K2-Instruct | ~91% | ~98% | Δ7.5% | Yellow |
| GLM-4.6 | ~97% | ~98% | Δ1.8% | Teal |
| Gemini 2.5 Pro | ~97% | ~98% | Δ1.4% | Teal |
| Gemini 2.5 Flash | ~97% | ~98% | Δ0.8% | Teal |
| GPT-OSS-20B | ~97% | ~98% | Δ0.8% | Teal |
| Qwen3-Next 80B A3B Instruct | ~85% | ~77% | Δ-7.9% | Green |
| Gemma 3 27B IT | ~74% | ~60% | Δ-13.7% | Green |
**Trend Verification:**
* **General Trend (Top 12 Models):** The blue dot (Congruent) is consistently to the right of the red dot (Incongruent), indicating higher accuracy on easier tasks. The connecting bar slopes upward from left (red) to right (blue). The size of the gap (delta) generally decreases as overall model accuracy increases.
* **Exception Trend (Bottom 2 Models):** For Qwen3-Next 80B A3B Instruct and Gemma 3 27B IT, the red dot (Incongruent) is to the right of the blue dot (Congruent), indicating higher accuracy on the harder task. The connecting bar slopes downward from left (blue) to right (red).
### Key Observations
1. **Performance Gap Correlation:** Models with lower overall accuracy (e.g., Llama 3.2 3B Instruct) exhibit the largest performance gaps between congruent and incongruent tasks (Δ46.9%). The highest-performing models (e.g., Gemini 2.5 Pro, GPT-OSS-20B) show near-negligible gaps (Δ<2%).
2. **High-Performance Cluster:** A cluster of models (GLM-4.6, Gemini 2.5 Pro/Flash, GPT-OSS-20B) all achieve very high accuracy (>95%) on both task types with minimal difference between them.
3. **Notable Outliers:**
* **Qwen3-Next 80B A3B Instruct** and **Gemma 3 27B IT** are the only models where performance on the "Harder" incongruent task is better than on the "Easier" congruent task.
* **Llama 3.2 3B Instruct** shows the most dramatic performance drop-off from congruent to incongruent tasks.
4. **Model Family Patterns:** Within the listed Llama models, the performance gap decreases as model size/capability increases (3B > 1B > 8B > 70B).
### Interpretation
This chart provides a nuanced view of model capability beyond simple accuracy benchmarks. It suggests that:
1. **Task Congruence is a Key Differentiator:** The "easiness" of a task (congruence) significantly impacts performance, especially for smaller or less capable models. This implies these models may rely more on pattern matching or surface-level cues that are disrupted in incongruent settings.
2. **Advanced Models Generalize Better:** The top-tier models demonstrate robust performance regardless of task congruence. Their minimal delta indicates a deeper, more flexible understanding that isn't as easily fooled by incongruent framing. This is a hallmark of more advanced reasoning capabilities.
3. **The Anomaly of Inverse Performance:** The two models that perform better on harder tasks present a fascinating anomaly. This could indicate specialized training data or architectural biases that inadvertently make them more adept at handling the specific type of incongruity tested, or it could suggest the "congruent" task formulation is somehow problematic for them. This warrants further investigation into the specific nature of the tasks.
4. **Benchmarking Implications:** Evaluating models solely on aggregate accuracy may mask important weaknesses. A model like Llama 3.2 3B Instruct appears to have reasonable accuracy on easier tasks (~82%) but fails significantly on harder ones (~35%), a critical flaw for real-world applications where inputs are often messy or contradictory. This chart argues for multi-faceted evaluation suites that stress-test model reasoning under different conditions.
</details>
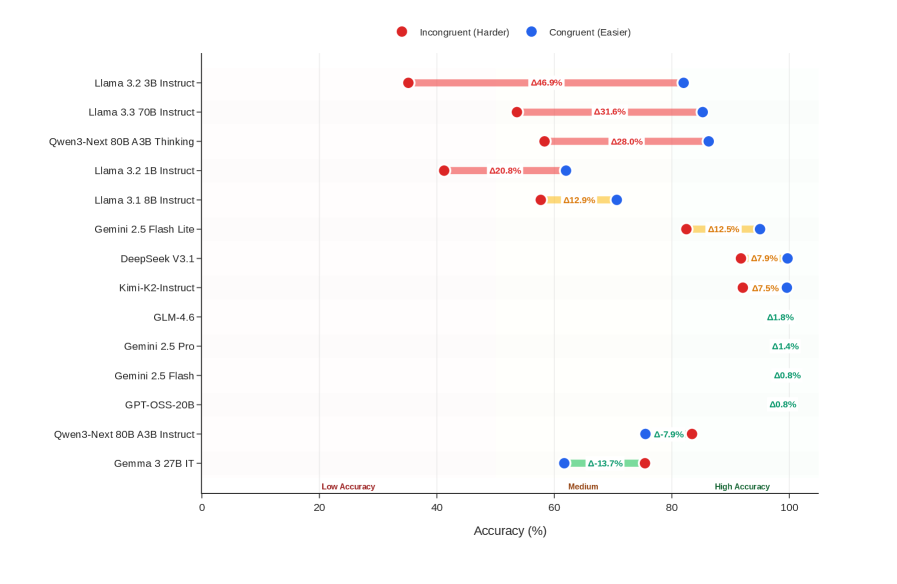
Figure 2: Belief bias effect across 14 models comparing performance on congruent syllogisms (logic aligns with intuition) versus incongruent syllogisms (logic conflicts with intuition). Twelve models (86%) exhibit positive bias ( $\Delta=+10.81$ pp, $p=0.0280^{*}$ , $d=0.66$ ). Top-tier models show minimal bias ( $<2$ pp), while lower-tier models show severe bias (up to $+46.9$ pp). Negative correlation ( $\rho=-0.565^{*}$ ) indicates higher reasoning ability reduces reliance on semantic heuristics.
#### Belief Bias Categories
Belief bias is a well-documented phenomenon in human cognition whereby reasoners accept logically invalid conclusions that seem plausible, or reject valid conclusions that seem implausible—allowing the semantic content of conclusions to override evaluation of logical structure (evans1983conflict; klauer2000belief; pennycook2013belief).
Our dual annotation scheme enables formal quantification of this effect by categorizing syllogisms based on alignment between logical validity and intuitive believability:
Congruent instances (82 instances, 51.2%) are cases where logic and intuition align: valid-believable or invalid-unbelievable conclusions. These represent “easy” cases where correct logical judgment matches intuitive response.
Incongruent instances (78 instances, 48.8%) are cases where logic and intuition conflict: valid-unbelievable or invalid-believable conclusions. These “hard” cases directly test whether models can override semantic plausibility with formal reasoning.
For example: “All things with an engine need oil; Cars need oil; Therefore, cars have engines.” This conclusion is factually correct yet logically invalid (affirming the consequent fallacy). Such instances are particularly diagnostic, as accepting them indicates susceptibility to belief bias.
### 3.3 Prompting Schema
We implement four prompting strategies to evaluate models under varying levels of task specification and reasoning scaffolding: Zero Shot (ZS) and One-shot (OS), which utilize zero and one demonstration example respectively to test intrinsic capability; Few Shot (FS), which provides four balanced examples (2 valid, 2 invalid) including a belief bias trap to distinguish natural language plausibility from logical validity; and ZS Chain-of-Thought (ZS CoT), which encourages intermediate reasoning traces (kojima2022large). Critically, regardless of the context or scaffolding provided, all strategies request the same final response format: a single word “correct” or “incorrect” to ensure comparability across conditions.
Algorithm 1 presents our unified inference procedure that adapts its behavior based on the temperature parameter $\tau$ . The algorithm accepts a syllogism $\mathcal{S}$ consisting of two premises $p_{1},p_{2}$ and a conclusion $c$ , a prompting strategy $\sigma$ , and outputs a validity prediction $\hat{y}$ along with a confidence score $\rho$ .
#### Strategy Specifications
The procedure begins by constructing task-specific prompts through two subroutines. BuildSystemPrompt ( $\sigma$ ) generates the system-level instruction that defines the reasoning task:
“You are an expert in syllogistic reasoning. Your task is to determine whether the conclusion of a given syllogism follows from the premises. A syllogism is CORRECT if the conclusion follows from the premises. A syllogism is INCORRECT if the conclusion does not follow. [Strategy-specific addition.] Respond with exactly one word: ‘correct’ or ‘incorrect’.”
For ZS CoT, the system prompt appends “Think through step by step” before the response instruction; all other strategies use identical system prompts. BuildUserPrompt ( $\mathcal{S},\sigma$ ) constructs the user message by optionally including demonstration examples (1 for one-shot, 4 for FS), formatting the input syllogism with labeled premises and conclusion, and appending the query.
Algorithm 1 Temperature-Adaptive Syllogistic Reasoning
0: Syllogism $\mathcal{S}=(p_{1},p_{2},c)$ ; Strategy $\sigma\in\{\text{ZS},\text{OS},\text{FS},\text{ZSCoT}\}$ ; Temperature $\tau\in\{0.0,0.5,1.0\}$
0: Prediction $\hat{y}\in\{\text{valid},\text{invalid}\}$ ; Confidence $\rho\in[0,1]$
1: Parameters: $K_{\max}=10$ , $\eta=5$ {Max samples, early stopping threshold}
2:
3: $\pi_{\text{sys}}\leftarrow\textsc{BuildSystemPrompt}(\sigma)$
4: $\pi_{\text{user}}\leftarrow\textsc{BuildUserPrompt}(\mathcal{S},\sigma)$
5: if $\tau=0$ then
6: return $\textsc{Parse}(\textsc{Query}(\pi_{\text{sys}},\pi_{\text{user}},0)),1.0$
7: end if
8: $n_{+}\leftarrow 0$ , $n_{-}\leftarrow 0$
9: for $k=1$ to $K_{\max}$ do
10: $\hat{y}_{k}\leftarrow\textsc{Parse}(\textsc{Query}(\pi_{\text{sys}},\pi_{\text{user}},\tau))$
11: $n_{+}\leftarrow n_{+}+\mathbb{1}[\hat{y}_{k}=\text{valid}]$
12: $n_{-}\leftarrow n_{-}+\mathbb{1}[\hat{y}_{k}=\text{invalid}]$
13: if $k=\eta$ and $\min(n_{+},n_{-})=0$ then
14: break {Early stop if unanimous}
15: end if
16: end for
17: $\hat{y}\leftarrow\begin{cases}\text{valid}&\text{if }n_{+}>n_{-}\\ \text{invalid}&\text{otherwise}\end{cases}$ {Ties default to invalid}
18: $\rho\leftarrow\max(n_{+},n_{-})/(n_{+}+n_{-})$
19: return $\hat{y},\rho$
#### Adaptive Stopping Strategy
When $\tau=0$ , the algorithm performs greedy deterministic decoding, querying the language model once, and returning the parsed prediction with full confidence ( $\rho=1.0$ ). For stochastic sampling ( $\tau>0$ ), we implement self-consistency (wang2023selfconsistency) by generating up to $K_{\max}=10$ independent samples. For each sample $k$ , we query the model with temperature $\tau$ and parse the response to extract the validity label $\hat{y}_{k}$ . We maintain counters $n_{+}$ and $n_{-}$ for valid and invalid predictions, respectively, using indicator functions $\mathbb{1}[\cdot]$ .
To improve efficiency, we employ early stopping inspired by holliday2024conditional: if the first $\eta=5$ samples are unanimous (i.e., $\min(n_{+},n_{-})=0$ at $k=\eta$ ), we terminate sampling. This reduces API calls substantially when models exhibit high confidence. The final prediction $\hat{y}$ is determined by majority vote. Any ties by default maps to “invalid” as a conservative choice.
### 3.4 Evaluation Methods
#### Primary Metrics
We evaluate model responses using standard classification metrics: accuracy $(TP+TN)/N$ , precision $TP/(TP+FP)$ , recall $TP/(TP+FN)$ , and F1 score as the harmonic mean of precision and recall. Accuracy serves as the primary metric given the near-balanced class distribution (47.5% valid, 52.5% invalid).
#### Dual Evaluation Framework
Each model prediction is evaluated against both ground truths independently. For syntactic evaluation, the model response maps “correct” $\to$ valid and “incorrect” $\to$ invalid, compared against ground_truth_syntax. For NLU evaluation, it maps “correct” $\to$ believable and “incorrect” $\to$ unbelievable, compared against ground_truth_NLU. This dual evaluation reveals whether models assess logical structure, natural language content, or some combination thereof.
#### Belief Bias Effect
Classical belief bias research employed indices derived from raw endorsement rates (evans1983conflict; klauer2000belief). However, these traditional indices have been criticized on psychometric grounds (dube2010traditional; heit2014traditional): changes in proportions starting from different baseline values are not readily comparable, and empirical receiver operating characteristic (ROC) curves reveal curvilinear relationships that violate the linear assumptions of difference scores.
We adopt a direct accuracy-based approach aligned with recent studies (trippas2014fluency), quantifying belief bias as the accuracy differential between congruent and incongruent syllogisms:
$$
\Delta_{\text{bias}}=\text{Acc}_{\text{congruent}}-\text{Acc}_{\text{incongruent}}
$$
where ${Acc}_{{congruent}}$ is accuracy on valid-believable plus invalid-unbelievable instances (where logic and intuition align), and ${Acc}_{{incongruent}}$ is accuracy on valid-unbelievable plus invalid-believable instances (where they conflict).
This metric is appropriate for our setting because: (1) our LLM evaluations produce binary correct/incorrect judgments rather than confidence-rated responses, eliminating the ROC curvature concerns that motivated signal detection approaches (dube2010traditional); (2) accuracy percentages are directly interpretable and comparable across all conditions, unlike endorsement-rate indices which suffer from baseline-dependency (heit2014traditional); (3) our within-subjects design compares each model against itself on congruent versus incongruent trials, isolating the belief bias effect while controlling for differences in overall reasoning ability. Positive $\Delta_{\text{bias}}$ indicates susceptibility to belief bias i.e., the model performs better when semantic content aligns with logical structure than when they conflict.
#### Consistency Metric
We measure response consistency across content variants of logically equivalent syllogisms. Let $\mathcal{S}$ denote the set of 40 base natural syllogisms and $\hat{y}_{s,v}$ the model’s prediction for syllogism $s$ under variant $v\in\{N,X,O,OX\}$ . We define:
$$
\displaystyle C_{\text{all}} \displaystyle=\frac{1}{|\mathcal{S}|}\sum_{s\in\mathcal{S}}\mathbb{1}\left[\hat{y}_{s,N}=\hat{y}_{s,X}=\hat{y}_{s,O}=\hat{y}_{s,OX}\right] \displaystyle C_{N\leftrightarrow X} \displaystyle=\frac{1}{|\mathcal{S}|}\sum_{s\in\mathcal{S}}\mathbb{1}\left[\hat{y}_{s,N}=\hat{y}_{s,X}\right] \displaystyle C_{O\leftrightarrow OX} \displaystyle=\frac{1}{|\mathcal{S}|}\sum_{s\in\mathcal{S}}\mathbb{1}\left[\hat{y}_{s,O}=\hat{y}_{s,OX}\right] \tag{1}
$$
where $C_{\text{all}}$ denotes overall consistency across all four variants. The pairwise metrics isolate specific invariance properties: $C_{N\leftrightarrow X}$ tests robustness to natural language content (meaningful vs. nonsense predicates), while $C_{O\leftrightarrow OX}$ tests robustness to premise order within matched content types.
## 4 Results
Our evaluation comprises 26,880 model-instance evaluations (14 models $\times$ 4 strategies $\times$ 3 temperatures $\times$ 160 syllogisms). We report syntactic accuracy as the primary metric, with supplementary analyses of dual-framework evaluation, belief bias, variant robustness, and response consistency.
### 4.1 Overall Performance
| Model | Acc. | Prec. | Rec. | F1 | $C_{\text{all}}$ | $C_{N\leftrightarrow X}$ | $C_{O\leftrightarrow OX}$ | NLU Acc. |
| --- | --- | --- | --- | --- | --- | --- | --- | --- |
| Gemini 2.5 Flash | 99.6 | 100.0 | 99.1 | 99.6 | 99.0 | 99.2 | 99.2 | 51.7 |
| GPT-OSS-20B | 99.5 | 100.0 | 99.0 | 99.5 | 96.5 | 97.1 | 98.1 | 51.6 |
| Gemini 2.5 Pro | 99.3 | 100.0 | 98.6 | 99.3 | 98.3 | 98.8 | 98.5 | 51.9 |
| GLM-4.6 | 99.0 | 100.0 | 97.8 | 98.9 | 95.8 | 96.5 | 97.5 | 52.2 |
| Kimi-K2-Instruct | 96.0 | 97.0 | 94.5 | 95.7 | 88.3 | 93.1 | 90.6 | 54.9 |
| DeepSeek V3.1 | 95.8 | 99.6 | 91.6 | 95.4 | 89.0 | 92.1 | 91.7 | 55.1 |
| Gemini 2.5 Flash Lite | 88.9 | 89.8 | 86.5 | 88.1 | 71.9 | 82.9 | 77.7 | 57.2 |
| Qwen3-Next 80B A3B Instruct | 79.4 | 73.3 | 88.9 | 80.4 | 69.2 | 81.0 | 76.5 | 46.8 |
| Qwen3-Next 80B A3B Thinking | 72.7 | 99.2 | 42.8 | 59.8 | 76.7 | 81.9 | 85.4 | 64.5 |
| Llama 3.3 70B Instruct | 69.8 | 82.1 | 46.7 | 59.5 | 66.2 | 81.0 | 78.3 | 66.3 |
| Gemma 3 27B IT | 68.4 | 61.0 | 93.1 | 73.7 | 69.0 | 82.5 | 86.0 | 43.6 |
| Llama 3.1 8B Instruct | 64.3 | 66.3 | 50.7 | 57.4 | 51.9 | 75.6 | 62.1 | 56.8 |
| Llama 3.2 3B Instruct | 59.2 | 88.1 | 16.2 | 27.4 | 75.0 | 92.1 | 81.7 | 73.7 |
| Llama 3.2 1B Instruct | 51.9 | 49.2 | 41.9 | 45.3 | 57.9 | 76.7 | 73.8 | 60.4 |
| All metrics in %. Acc. = Syntax Accuracy, Prec. = Precision, Rec. = Recall. | | | | | | | | |
| Consistency metrics: $C_{\text{all}}$ (all 4 variants), $C_{N\leftrightarrow X}$ (normal $\leftrightarrow$ nonsense), $C_{O\leftrightarrow OX}$ (order-switched variants). | | | | | | | | |
Table 3: Comprehensive model performance metrics aggregated across all 12 configurations (4 strategies $\times$ 3 temperatures). Syntax accuracy and NLU accuracy represent dual evaluation frameworks. Models grouped by performance tier.
Performance exhibits a bimodal distribution across the 14 evaluated models (Table 3). Six models achieve above 95% syntax accuracy, forming a distinct top-tier with robust syllogistic reasoning capability. Gemini 2.5 Flash attains near-perfect performance (99.6%), deviating from perfect accuracy in fewer than five instances per 1000. At the opposite extreme, five models score below 70%, with Llama 3.2 1B Instruct performing at 51.9%. The overall mean syntax accuracy is 81.7% ( $SD$ = 17.1%), but the 47.7% gap between top and bottom performers demonstrates that syllogistic reasoning capability depends critically on architectural choices and training methods rather than raw model scale.
The pattern of precision, recall, and F1 scores reveals systematic biases. Qwen3-Next 80B A3B Thinking shows 99.2% precision but only 42.8% recall, indicating it labels most syllogisms as “incorrect” even when valid. Conversely, Gemma 3 27B IT exhibits 93.1% recall but only 61.0% precision, suggesting over-acceptance of conclusions. Top-tier models maintain balanced precision-recall profiles (both $>$ 97%), demonstrating genuine discriminative capability.
#### Dual Evaluation Framework
<details>
<summary>x3.png Details</summary>
### Visual Description
## Horizontal Bar Chart: AI Model Accuracy Comparison (Syntax vs. NLU)
### Overview
The image displays a horizontal bar chart comparing the performance of 14 different large language models (LLMs) on two distinct accuracy metrics: **Syntax Accuracy** and **NLU (Natural Language Understanding) Accuracy**. The chart uses a diverging bar format, with NLU Accuracy plotted to the left (orange) and Syntax Accuracy plotted to the right (blue) from a central zero axis. The models are listed vertically on the left side.
### Components/Axes
* **Chart Type:** Horizontal diverging bar chart.
* **Y-Axis (Vertical):** Lists the names of 14 AI models. From top to bottom:
1. Llama 3.2 1B Instruct
2. Llama 3.2 3B Instruct
3. Llama 3.1 8B Instruct
4. Gemma 3 27B IT
5. Llama 3.3 70B Instruct
6. Qwen3-Next 80B A3B Thinking
7. Qwen3-Next 80B A3B Instruct
8. Gemini 2.5 Flash Lite
9. DeepSeek V3.1
10. Kimi-K2-Instruct
11. GLM-4.6
12. Gemini 2.5 Pro
13. GPT-OSS-20B
14. Gemini 2.5 Flash
* **X-Axis (Horizontal):** Labeled "Accuracy (%)". The scale runs from 0 at the center to 100 on both the left (for NLU) and right (for Syntax) sides. Major tick marks are at 0, 20, 40, 60, 80, and 100.
* **Legend:** Positioned at the top center of the chart.
* A blue square is labeled "Syntax Accuracy".
* An orange square is labeled "NLU Accuracy".
* **Data Series:** Two series are plotted for each model.
* **NLU Accuracy (Orange Bars):** Extend leftward from the central axis. The numerical percentage value is printed to the left of each orange bar.
* **Syntax Accuracy (Blue Bars):** Extend rightward from the central axis. The numerical percentage value is printed to the right of each blue bar.
### Detailed Analysis
The following table reconstructs the data presented in the chart. Values are transcribed directly from the labels on the bars.
| Model Name | NLU Accuracy (Orange, Left) | Syntax Accuracy (Blue, Right) |
| :--- | :--- | :--- |
| Llama 3.2 1B Instruct | 60.4% | 51.9% |
| Llama 3.2 3B Instruct | 73.7% | 59.2% |
| Llama 3.1 8B Instruct | 56.8% | 64.3% |
| Gemma 3 27B IT | 43.6% | 68.4% |
| Llama 3.3 70B Instruct | 66.3% | 69.8% |
| Qwen3-Next 80B A3B Thinking | 64.5% | 72.7% |
| Qwen3-Next 80B A3B Instruct | 46.8% | 79.4% |
| Gemini 2.5 Flash Lite | 57.2% | 88.9% |
| DeepSeek V3.1 | 55.1% | 95.8% |
| Kimi-K2-Instruct | 54.9% | 96.0% |
| GLM-4.6 | 52.2% | 99.0% |
| Gemini 2.5 Pro | 51.9% | 99.3% |
| GPT-OSS-20B | 51.6% | 99.5% |
| Gemini 2.5 Flash | 51.7% | 99.6% |
**Trend Verification:**
* **NLU Accuracy (Orange, Leftward Trend):** The orange bars show no single monotonic trend. The highest NLU score is for **Llama 3.2 3B Instruct (73.7%)**, located near the top. The scores generally fluctuate between the mid-40s and low-70s, with the bottom seven models (from Gemini 2.5 Flash Lite downwards) clustering in a narrow band between 51.6% and 57.2%.
* **Syntax Accuracy (Blue, Rightward Trend):** The blue bars exhibit a very clear upward trend from top to bottom. The lowest Syntax score is for **Llama 3.2 1B Instruct (51.9%)** at the top. The scores increase steadily, with the bottom four models achieving near-perfect scores above 99%.
### Key Observations
1. **Inverse Performance Relationship:** There is a strong inverse relationship between the two metrics across the model list. Models at the top of the chart (e.g., Llama 3.2 variants) tend to have higher NLU scores but lower Syntax scores. Models at the bottom (e.g., Gemini 2.5 Flash, GPT-OSS-20B) have exceptionally high Syntax scores but relatively lower, clustered NLU scores.
2. **Syntax Accuracy Ceiling:** The bottom four models (GLM-4.6, Gemini 2.5 Pro, GPT-OSS-20B, Gemini 2.5 Flash) have effectively reached a performance ceiling on the Syntax Accuracy metric, all scoring between 99.0% and 99.6%.
3. **NLU Performance Cluster:** The bottom half of the models (from Gemini 2.5 Flash Lite to Gemini 2.5 Flash) show remarkably similar NLU Accuracy, all falling within a ~6 percentage point range (51.6% to 57.2%), despite vast differences in their Syntax scores.
4. **Model Variant Comparison:** The "Qwen3-Next 80B A3B" model is listed in two variants: "Thinking" and "Instruct". The "Instruct" variant has significantly higher Syntax Accuracy (79.4% vs. 72.7%) but much lower NLU Accuracy (46.8% vs. 64.5%) compared to the "Thinking" variant.
### Interpretation
This chart visualizes a potential trade-off or specialization in LLM capabilities. The data suggests that the evaluated models can be broadly categorized into two groups based on this benchmark:
* **NLU-Focused/Generalist Models (Top of Chart):** Models like the Llama 3.2 series prioritize or excel at Natural Language Understanding tasks, achieving higher NLU scores. However, this comes at the cost of lower syntactic precision. Their performance profile suggests a design or training emphasis on semantic comprehension over rigid structural correctness.
* **Syntax-Focused/Formalist Models (Bottom of Chart):** Models like Gemini 2.5 Flash and GPT-OSS-20B demonstrate near-flawless syntactic performance. Their tightly clustered, moderate NLU scores indicate that while they are exceptionally good at generating grammatically correct and structurally sound text, their grasp of deeper semantic meaning or nuanced understanding, as measured by this NLU metric, is consistent but not leading. This could reflect a training objective that heavily weights formal correctness.
The stark divergence implies that "accuracy" is not a monolithic concept for LLMs. A model's strength in one linguistic dimension (syntax) does not predict its strength in another (semantics/NLU). The outlier is the **Qwen3-Next 80B A3B Instruct** model, which has the second-lowest NLU score (46.8%) but a relatively high Syntax score (79.4%), making it an extreme example of the syntax-over-NLU profile. This chart is crucial for selecting a model based on the specific requirements of a task—whether it demands impeccable grammar or deep understanding of context and meaning.
</details>
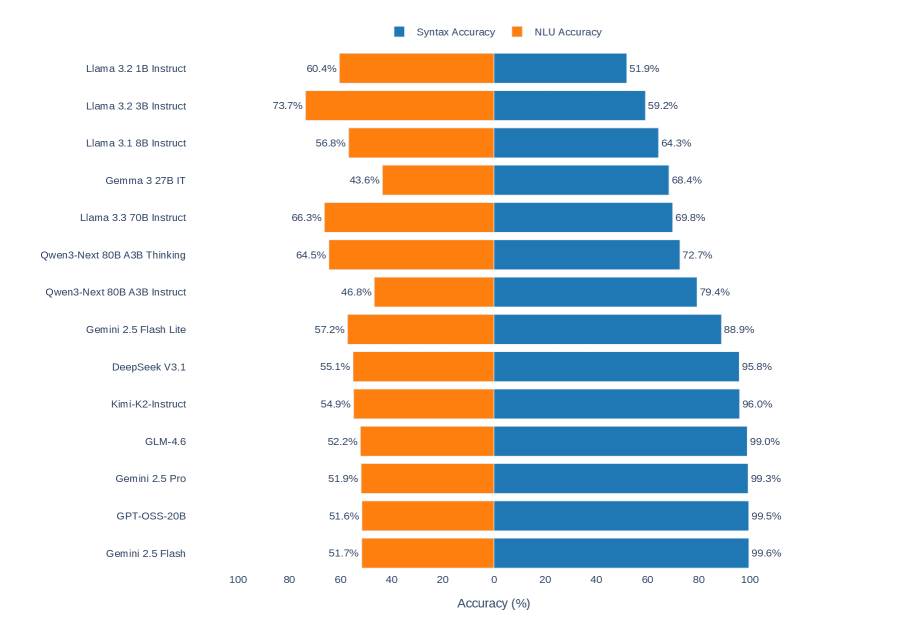
Figure 3: Syntactic validity (left) versus natural language understanding believability (right). The 25.50pp gap (syntax: 81.7%, NLU: 56.2%) demonstrates that models excel at formal logical reasoning while struggling with semantic plausibility judgments.
We evaluated each prediction against both ground truths independently: syntactic validity and NLU believability (see § 3.2). As shown in Figure 3 and Table 3 (final column), syntax accuracy (81.7%) substantially exceeds NLU accuracy (56.2%). Top-tier models show large syntax-NLU gaps: Gemini 2.5 Flash (47.9 pp), GPT-OSS-20B (47.9 pp), and Gemini 2.5 Pro (47.4 pp) excel at syntax but perform near chance on NLU evaluation. This pattern emerges because these models correctly judge logical validity independent of content believability. Conversely, three models exhibit negative gaps: Llama 3.2 3B Instruct ( $-14.5$ pp), Llama 3.2 1B Instruct ( $-8.5$ pp), and Llama 3.3 70B Instruct ( $+3.5$ pp shows minimal gap), suggesting that lower-tier models may rely more heavily on semantic plausibility heuristics.
### 4.2 Prompting Strategy Effects
Contrary to expectations, FS prompting yields the lowest mean accuracy (79.1%), while ZS achieves 82.7%. A paired $t$ -test confirms that FS significantly underperforms ZS ( $\Delta=-3.57$ pp, $t_{41}=2.50$ , $p=0.0165$ ), with the effect surviving Holm-Bonferroni correction for three comparisons ( $p_{\text{adj}}=0.0495$ , Cohen’s $d=-0.39$ ). However, a Friedman test shows no significant overall strategy effect across all four strategies ( $\chi^{2}=3.24$ , $df=3$ , $p=0.356$ ), and Wilcoxon signed-rank tests reveal the effect becomes marginally non-significant after correction ( $p=0.0195$ , $p_{\text{adj}}=0.0584$ ). Figure 1 illustrates the lack of systematic strategy effects across models.
To understand this pattern, we employed McNemar’s test at the instance level ( $N=6720$ syllogism evaluations: 14 models $\times$ 3 temperatures $\times$ 160 syllogisms). We find highly significant error redistribution: ZS solves 786 instances that FS fails, while FS solves only 546 that ZS fails ( $\chi^{2}=42.88$ , $p<0.0001$ ). The reconciliation is straightforward: FS prompting changes which problems are solved (McNemar test) and produces a consistent directional decline in mean accuracy ( $t$ -test), but the median effect is less robust (Wilcoxon test). Strategy effects appear model-specific rather than universal.
### 4.3 Temperature and Belief Bias Effects
Temperature ( $\tau$ ) has negligible impact on accuracy when adaptive stopping is employed. A Friedman test confirms no significant temperature effect ( $\chi^{2}=3.77$ , $df=2$ , $p=0.152$ ), with mean accuracy virtually identical across all $\tau$ settings. The adaptive majority-voting mechanism effectively normalizes stochastic variation.
| Model | Cong. | Incong. | $\Delta_{\text{bias}}$ |
| --- | --- | --- | --- |
| Llama 3.2 3B Instruct | 82.0 | 35.2 | +46.9 |
| Llama 3.3 70B Instruct | 85.3 | 53.6 | +31.6 |
| Qwen3-Next 80B A3B Thinking | 86.3 | 58.3 | +28.0 |
| Llama 3.2 1B Instruct | 62.0 | 41.2 | +20.8 |
| Llama 3.1 8B Instruct | 70.6 | 57.7 | +12.9 |
| Gemini 2.5 Flash Lite | 95.0 | 82.5 | +12.5 |
| DeepSeek V3.1 | 99.7 | 91.8 | +7.9 |
| Kimi-K2-Instruct | 99.6 | 92.1 | +7.5 |
| GLM-4.6 | 99.4 | 97.5 | +1.9 |
| Gemini 2.5 Pro | 100.0 | 98.6 | +1.4 |
| Gemini 2.5 Flash | 100.0 | 99.2 | +0.9 |
| GPT-OSS-20B | 99.2 | 98.4 | +0.8 |
| Qwen3-Next 80B A3B Instruct | 75.5 | 83.4 | $-7.9$ |
| Gemma 3 27B IT | 61.7 | 75.4 | $-13.7$ |
| All values in %. Cong. = Congruent, Incong. = Incongruent. | | | |
Table 4: Belief bias analysis showing accuracy on congruent (logic matches intuition) versus incongruent (logic conflicts with intuition) syllogisms. Sorted by bias magnitude.
We observe robust evidence of belief bias across the majority of models (Figure 2, Table 4). Twelve of 14 models exhibit positive belief bias i.e., higher accuracy on congruent problems than on incongruent problems. The mean bias effect is $\Delta_{\text{bias}}=+10.81$ pp ( $SD$ = 16.32), statistically significant by paired $t$ -test ( $t_{13}=2.47$ , $p=0.0280$ , Cohen’s $d=0.66$ ).
### 4.4 Consistency and Benchmark Correlations
The consistency metrics in Table 3 reveal that high-performing models maintain high consistency across content variants. The correlation between syntax accuracy and overall consistency is very strong (Pearson $r=0.877$ , $p<0.0001$ ; Spearman $\rho=0.890$ , $p<0.0001$ ), indicating that models achieving high accuracy are substantially more stable across variants.
<details>
<summary>x4.png Details</summary>
### Visual Description
## Scatter Plot with Regression Line: Syntax Accuracy vs. LMArena Rank
### Overview
The image is a scatter plot chart comparing the performance of various Large Language Models (LLMs) on two metrics: "LMArena Rank" on the x-axis and "Syntax Accuracy (%)" on the y-axis. A red Ordinary Least Squares (OLS) regression line with a shaded confidence interval is overlaid, indicating a negative correlation between the two variables. The chart is set against a white background with a light grey grid.
### Components/Axes
* **X-Axis:** Labeled "LMArena Rank (lower = better)". The scale runs from 0 to 250, with major tick marks at 0, 50, 100, 150, 200, and 250.
* **Y-Axis:** Labeled "Syntax Accuracy (%)". The scale runs from 40 to 110, with major tick marks at 40, 50, 60, 70, 80, 90, 100, and 110.
* **Legend:** Positioned in the top-right corner, outside the main plot area. It lists 14 distinct AI models, each associated with a unique colored marker shape.
* **Regression Line:** A solid red line labeled "OLS (p=-0.76)" in the legend. It slopes downward from left to right.
* **Confidence Interval:** A light purple shaded region surrounding the OLS line, representing the uncertainty of the regression.
### Detailed Analysis
**Data Series (Models) and Approximate Coordinates:**
The following list maps each model from the legend to its approximate position on the chart. Coordinates are estimated visually as (LMArena Rank, Syntax Accuracy %).
1. **Gemini 2.5 Flash** (Blue Circle): (~45, ~100)
2. **Gemini 2.5 Pro** (Pink Square): (~10, ~100)
3. **GPT-OSS-20B** (Green Diamond): (~90, ~100)
4. **GLM-4.6** (Red Plus): (~25, ~100)
5. **Kimi-K2-Instruct** (Purple X): (~35, ~96)
6. **DeepSeek V3.1** (Black Triangle): (~35, ~96) *[Note: This marker overlaps closely with Kimi-K2-Instruct]*
7. **Gemini 2.5 Flash Lite** (Brown Inverted Triangle): (~75, ~89)
8. **Qwen3-Next 80B A3B Instruct** (Dark Purple Pentagon): (~50, ~80)
9. **Qwen3-Next 80B A3B Thinking** (Orange Circle): (~75, ~73)
10. **Llama 3.3 70B Instruct** (Blue Star): (~135, ~70)
11. **Gemma 3 27B IT** (Teal Bowtie): (~80, ~69)
12. **Llama 3.1 8B Instruct** (Pink Bowtie): (~205, ~64)
13. **Llama 3.2 3B Instruct** (Pink Circle): (~230, ~59)
14. **Llama 3.2 1B Instruct** (Brown Square): (~260, ~52)
**Regression Analysis:**
* The OLS line has a stated correlation coefficient (p) of -0.76, indicating a strong negative linear relationship.
* The line originates near (0, ~98) and terminates near (260, ~52).
* The shaded confidence interval is widest at the extremes of the x-axis (near rank 0 and 260) and narrowest near the center of the data cluster (around rank 50-100).
### Key Observations
1. **Strong Negative Correlation:** There is a clear visual and statistical trend: models with a better (lower) LMArena Rank tend to have higher Syntax Accuracy scores.
2. **Performance Clustering:** The top-performing models (Syntax Accuracy > 95%) are all clustered in the low-rank region (LMArena Rank < 50).
3. **Outliers/Notable Points:**
* **GPT-OSS-20B** is a high-performing outlier in terms of rank; it achieves ~100% Syntax Accuracy despite having a relatively high (worse) rank of ~90.
* **Llama 3.3 70B Instruct** sits almost exactly on the regression line at (~135, ~70), making it a representative data point for the trend.
* The three smallest Llama models (8B, 3B, 1B) form a clear descending sequence in the bottom-right quadrant, showing both worse rank and lower syntax accuracy.
4. **Data Spread:** The vertical spread (Syntax Accuracy) of models is much greater at lower ranks (e.g., between rank 10-100, accuracy ranges from ~80% to ~100%) than at higher ranks (e.g., beyond rank 200, accuracy is tightly clustered between ~52% and ~64%).
### Interpretation
This chart demonstrates a significant trade-off or relationship between a model's general capability ranking (LMArena Rank) and its specific proficiency in syntactic accuracy. The strong negative correlation (p=-0.76) suggests that models which excel in the broad, likely multi-faceted evaluation of LMArena also tend to be more syntactically precise.
The clustering of top models indicates a performance ceiling or elite tier where high rank and near-perfect syntax accuracy co-occur. The position of **GPT-OSS-20B** is particularly interesting; it suggests this model may have a specialized strength in syntax that outperforms what its general rank would predict, or that the LMArena evaluation weights other factors more heavily.
The widening confidence interval at the extremes highlights greater uncertainty in the trend for the very best and worst-ranked models, likely due to fewer data points in those regions. Overall, the visualization effectively argues that improvements in general model ranking are strongly associated with improvements in a core linguistic capability like syntax.
</details>
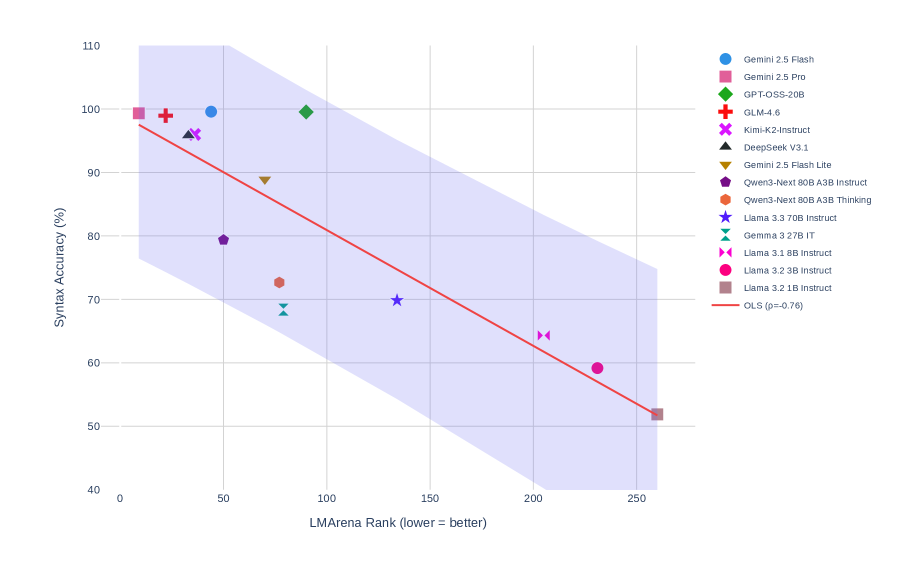
Figure 4: Correlation between syllogistic reasoning accuracy and LMArena rankings (Spearman $\rho=-0.825$ , $p=0.0010$ , $N=12$ ). Lower rank indicates better performance. The strong negative correlation suggests that instruction-following quality predicts formal reasoning capability.
To contextualize syllogistic reasoning within the broader LLM evaluation landscape, we computed correlations with LMArena human preference rankings (chiang2024chatbot; zheng2023judging; zheng2024lmsyschatm). As shown in Figure 4, syllogistic reasoning shows a strong negative correlation with LMArena rank (Spearman $\rho=-0.825$ , $p=0.0010$ , $N=12$ ; lower rank indicates better performance). The negative correlation is the expected as models with higher reasoning accuracy achieve numerically lower (better) LMArena rankings. This suggests that models excelling at instruction following also excel at formal reasoning, likely because both require precise adherence to explicit rules.
### 4.5 Statistical Summary
| Analysis | Test | Statistic | df | $p$ -value | Effect | Result |
| --- | --- | --- | --- | --- | --- | --- |
| Main Effects | | | | | | |
| Strategy effect (overall) | Friedman $\chi^{2}$ | 3.24 | 3 | 0.356 | — | No effect |
| ZS vs FS | Paired $t$ | 2.50 | 41 | 0.0165 ∗ | $d=-0.39$ | Significant |
| ZS vs FS (Holm) | Paired $t$ | 2.50 | 41 | 0.0495 ∗ | $d=-0.39$ | Survives correction |
| Temperature effect | Friedman $\chi^{2}$ | 3.77 | 2 | 0.152 | — | No effect |
| Belief bias (Cong. $>$ Incong.) | Paired $t$ | 2.47 | 13 | 0.0280 ∗ | $d=0.66$ | Confirmed |
| McNemar Tests (Instance-level, $N=6720$ ) | | | | | | |
| ZS vs FS | McNemar $\chi^{2}$ | 42.88 | 1 | $<$ 0.0001 ∗∗∗ | 786 vs 546 | Error redistribution |
| ZS vs OS | McNemar $\chi^{2}$ | 1.70 | 1 | 0.192 | 317 vs 284 | No redistribution |
| ZS vs ZS CoT | McNemar $\chi^{2}$ | 0.26 | 1 | 0.612 | 389 vs 374 | No redistribution |
| Key Correlations ( $N=14$ models) | | | | | | |
| Syntax Acc. $\times$ Overall Consistency | Spearman $\rho$ | 0.890 | — | $<$ 0.0001 ∗∗∗ | Very strong | Positive |
| Syntax Acc. $\times$ $C_{N\leftrightarrow X}$ | Spearman $\rho$ | 0.846 | — | 0.0001 ∗∗∗ | Very strong | Positive |
| Syntax Acc. $\times$ $C_{O\leftrightarrow OX}$ | Spearman $\rho$ | 0.837 | — | 0.0002 ∗∗∗ | Very strong | Positive |
| Syntax Prec. $\times$ Syntax Rec. | Spearman $\rho$ | 0.691 | — | 0.0062 ∗∗ | Strong | Positive |
| Syntax Acc. $\times$ NLU Acc. | Spearman $\rho$ | $-0.543$ | — | 0.0449 ∗ | Moderate | Negative |
| Syntax Acc. $\times$ Bias Effect | Spearman $\rho$ | $-0.565$ | — | 0.0353 ∗ | Moderate | Negative |
| Benchmark Correlation | | | | | | |
| LMArena rank (lower = better) | Spearman $\rho$ | $-0.825$ | — | 0.0010 ∗∗∗ | Very strong | Predicts reasoning |
| ${}^{*}p<0.05$ , ${}^{**}p<0.01$ , ${}^{***}p<0.001$ . Holm-Bonferroni correction applied to strategy comparisons. | | | | | | |
| McNemar instances: “786 vs 546” = ZS correct & FS wrong vs FS correct & ZS wrong. | | | | | | |
| Bias correlation: Negative $\rho$ means higher accuracy correlates with smaller bias magnitude (closer to zero). | | | | | | |
Table 5: Comprehensive statistical summary of all hypothesis tests and correlations for 14 models. Strategy comparisons use Holm-Bonferroni correction. McNemar test operates at instance-level (6,720 syllogism evaluations per comparison).
Table 5 consolidates all key statistical findings. The FS underperformance survives Holm-Bonferroni correction ( $p_{adj}=0.0495$ ), while the McNemar test reveals significant error redistribution at the instance level. The reconciliation between significant $t$ -test and marginally non-significant Wilcoxon test ( $p_{raw}=0.0195$ , $p_{adj}=0.0584$ ) reveals that FS produces a consistent mean decline but less robust median effect.
The correlation between syntax accuracy and belief bias magnitude shows a moderate negative relationship (Spearman $\rho=-0.565$ , $p=0.0353$ ). Since bias effect is defined as $Acc_{congruent}-Acc_{incongruent}$ , this negative correlation indicates that higher performing models exhibit smaller bias magnitudes. It further provides evidence that higher reasoning ability reduces reliance on content based heuristics.
The very strong correlations between syntax accuracy and all three consistency metrics ( $\rho=0.890$ , 0.846, and 0.837, all $p<0.001$ ) confirm that models achieving high accuracy are substantially more stable across content and order variations. The moderate negative correlation between syntax and NLU accuracy (Spearman $\rho=-0.543$ , $p=0.0449$ ) indicates that models optimized for logical structure may diverge from intuitive believability judgments.
## 5 Discussion
In this study, we analyzed 40 instances of syllogism and their variations, resulting in a total of 160 data points tested against 14 different large language models. Our results demonstrate a striking pattern: top-tier models achieve near-perfect syntactic accuracy (99.6%) while performing at chance levels on natural language understanding (52%). This behavior, excelling at formal logic while struggling with semantic plausibility, contrasts sharply with human reasoning, where belief bias typically dominates logical analysis.
The majority of models exhibit significant belief bias, performing better when logic aligns with intuition (mean effect: +10.81 pp, $p=0.028$ ). However, this bias decreases systematically with improved reasoning capability ( $\rho=-0.565$ , $p=0.035$ ), suggesting that higher-performing models increasingly prioritize formal rules over semantic heuristics. Architectural and training choices prove more consequential than raw parameter count by substantial margins. Counterintuitively, few-shot prompting degraded performance compared to zero-shot, suggesting demonstration examples may introduce noise in formal reasoning tasks. The strong correlation between instruction following quality (LMArena, $\rho=-0.825$ ) and reasoning accuracy indicates that precise rule adherence underlies both capabilities.
These findings suggest that most models exhibit a preference for symbolic reasoning and inferences rather than adhering to the natural language path of reasoning characteristic of human cognition. While this result may appear promising from a purely logical perspective, it raises important questions about the alignment between LLM reasoning and human cognitive processes. These models were trained on extensive natural language data, yet the top performers appear to function more like formal logic engines than human-like reasoners susceptible to known natural language biases.
## 6 Limitations
Our evaluation focuses primarily on categorical syllogisms, a narrow subset of logical reasoning that may not generalize to more complex structures with nested quantifiers or modal operators. The dual ground truth framework, while enabling systematic measurement, necessarily simplifies the dynamic interaction between logic and natural language that humans navigate simultaneously in real reasoning contexts.
The scope of our study includes only 14 models, representing a snapshot of the current LLM landscape but not exhaustive coverage of all available systems. Our prompting strategies, while covering major paradigms (zero-shot, one-shot, few-shot, chain-of-thought), constitute a limited exploration of the vast prompt engineering space. Additionally, our consistency metrics measure stability across content and order variations but do not assess robustness to adversarial perturbations or systematically manipulated distractors.
The belief bias metric, while grounded in cognitive psychology literature, captures only one dimension of the complex relationship between real world beliefs and logical reasoning. Future work should incorporate additional measures such as response time analysis, confidence calibration, and fine-grained error taxonomies to provide a more comprehensive understanding of LLM reasoning processes.
## 7 Future Work
Several promising directions emerge from this work. Extending evaluation to richer logical systems such as modal logics, transitive closure logics, to test whether the observed patterns generalize beyond categorical syllogisms. Particular interest lies in logical systems with simple formal syntax but complex natural language semantics, which would further stress the formal logic-natural language divide that we observed.
Complementing these empirical extensions, mechanistic interpretability studies could reveal whether models learn explicit logical rules, statistical approximations, or hybrid representations. This would clarify the computational basis of the near-perfect syntactic performance we documented in top-tier models. Related to this, the causal relationship between reasoning capability and bias resistance remains an open question: does logical training reduce bias, or does reduced bias enable better reasoning? Controlled fine-tuning experiments could disentangle these possibilities.
Our finding that few-shot prompting degraded performance challenges conventional wisdom and warrants systematic exploration of when and why demonstration examples help versus hinder reasoning. Such investigation would inform more effective prompting strategies for logical reasoning tasks.
More broadly, our results raise a fundamental tension i.e., are we building human like reasoners or formal logic engines? This question has implications not only for model development but also for appropriate deployment contexts and expectations for LLM behavior in reasoning-intensive applications. We intend to continue this line of inquiry across other logical reasoning tasks to better understand the trajectory of the cognitive capabilities of LLM.
## Acknowledgements
We thank the Indo-French Centre for the Promotion of Advanced Research (IFCPAR/CEFIPRA) for their support. This work was supported through project number CSRP-6702-2.