# Graph-Based Exploration for ARC-AGI-3 Interactive Reasoning Tasks
**Authors**: Evgenii Rudakov, Jonathan Shock, Benjamin Ultan Cowley
## Abstract
We present a training-free graph-based approach for solving interactive reasoning tasks in the ARC-AGI-3 benchmark. ARC-AGI-3 comprises game-like tasks where agents must infer task mechanics through limited interactions, and adapt to increasing complexity as levels progress. Success requires forming hypotheses, testing them, and tracking discovered mechanics. The benchmark has revealed that state-of-the-art LLMs are currently incapable of reliably solving these tasks. Our method combines vision-based frame processing with systematic state-space exploration using graph-structured representations. It segments visual frames into meaningful components, prioritizes actions based on visual salience, and maintains a directed graph of explored states and transitions. By tracking visited states and tested actions, the agent prioritizes actions that provide the shortest path to untested state-action pairs. On the ARC-AGI-3 Preview Challenge, this structured exploration strategy solves a median of 30 out of 52 levels across six games and ranks 3rd on the private leaderboard, substantially outperforming frontier LLM-based agents. These results demonstrate that explicit graph-structured exploration, even without learning, can serve as a strong baseline for interactive reasoning and underscore the importance of systematic state tracking and action prioritization in sparse-feedback environments where current LLMs fail to capture task dynamics. The code is open source and available at https://github.com/dolphin-in-a-coma/arc-agi-3-just-explore.
## Introduction
Introduced in 2019, the Abstraction and Reasoning Corpus for Artificial General Intelligence (ARC-AGI) has become a fundamental benchmark for evaluating general fluid intelligence in artificial systems by posing novel tasks that require minimal prior knowledge (chollet_measure_2019). While the original ARC-AGI benchmarks focused on static grid-based reasoning tasks, ARC-AGI-3 represents a paradigm shift toward Interactive Reasoning Benchmarks (IRBs) that test broader capabilities, including on-the-fly learning, exploration, and memory through game-like environments where agents must perceive, plan, and act across multiple steps to achieve long-horizon goals (arc-agi-3).
ARC-AGI-3 introduces novel game environments designed to test the skill-acquisition efficiency of artificial systems, where agents interact with game environments without instructions, and must discover mechanics through exploration. Early results reveal a stark performance gap: frontier AI models scored 0% while human participants achieved 100% on the initial preview tasks (arc-agi-3). This dramatic disparity underscores fundamental limitations in current AI approaches to interactive reasoning and adaptive learning in novel environments.
The challenge of learning from sparse rewards has been central to reinforcement learning (RL) for decades. When rewards are rare and precise action sequences are required, random exploration fails to discover optimal policies. Exploration strategies have emerged to address this challenge. Curiosity-driven methods use prediction error as intrinsic motivation (pathak_curiosity-driven_2017), enabling agents to explore complex environments like Super Mario Bros without extrinsic rewards (pathak_curiosity-driven_2017). Go-Explore advances systematic exploration by maintaining archives of discovered states and decomposing exploration into phases: return to promising states, then explore from them (ecoffet_first_2021). This approach achieved breakthrough performance on Montezuma’s Revenge, scoring 25% higher than the human expert. For goal-conditioned tasks, Hindsight Experience Replay (HER) learns from failure by relabeling unsuccessful attempts as alternative goals, achieving sample-efficient learning without reward engineering (andrychowicz_hindsight_2017).
Model-based approaches have demonstrated remarkable sample efficiency by learning environment dynamics. MuZero combined learned latent dynamics with tree search, achieving superhuman performance on board games and Atari benchmarks without knowledge of game rules (schrittwieser_mastering_2020). EfficientZero extended this with self-supervised consistency losses, becoming the first algorithm to reach superhuman levels on Atari (194.3% mean human) with just 100k training samples (two hours of real-time experience) per game (ye_mastering_2021). BBF further improved Atari 100k results by scaling the value network sample-efficiency (schwarzer_bigger_2023), in a completely model-free manner.
The family of Dreamer models (hafner_training_2025) takes an alternative approach, learning world models in latent space and training policies through imagined rollouts rather than via tree search, mastering over 150 diverse tasks from Atari to Minecraft with a single configuration (hafner_training_2025). Most recently, Axiom introduced object-centric world models that learn compositional representations by discovering and tracking entities, achieving competitive performance within minutes by targeting 10k-step solutions per environment (heins_axiom_2025).
Despite these advances, current approaches face fundamental limitations for few-shot discovery tasks like ARC-AGI-3. The benchmark provides only a single sparse reward signal, level completion, across no more than 10 levels per game. This scarcity of feedback severely constrains learning-based methods. The challenge is compounded by the fact that each level introduces new mechanics while retaining previous ones, creating a shifting distribution that prevents straightforward transfer learning. Curiosity-driven exploration offers no guarantee of correlation with task progress in truly novel environments where the notion of ”most interesting states” may be orthogonal to goal-relevance. Sample-efficient approaches like Axiom assume object-centric compositional structure and require environments to exhibit consistent physical dynamics, assumptions that may not hold across ARC-AGI-3’s abstract and diverse game mechanics.
ARC-AGI-3 is also relevant for understanding the behaviour of large language model (LLM) agents. Unlike static reasoning benchmarks, it requires agents to infer latent rules through interaction, maintain an evolving notion of state, and design multi-step probes under sparse feedback, making it a complementary testbed for studying how explicit structure and exploration strategies can support LLM-based reasoning.
In this work, we present a graph-based exploration method that combines systematic state-space tracking with visual priority heuristics to tackle ARC-AGI-3’s interactive reasoning challenges. Our approach maintains a directed graph representation of explored states and action transitions, prioritizing actions based on visual salience while ensuring comprehensive exploration through frontier-driven navigation. Unlike learning-based approaches that require extensive training, our method operates as a strong baseline that can make progress through structured exploration alone. We demonstrate that this approach achieves competitive performance on the ARC-AGI-3 benchmark, significantly outperforming state-of-the-art LLMs while providing insights into the nature of exploration required for interactive reasoning tasks.
## ARC-AGI-3
### Benchmark Overview
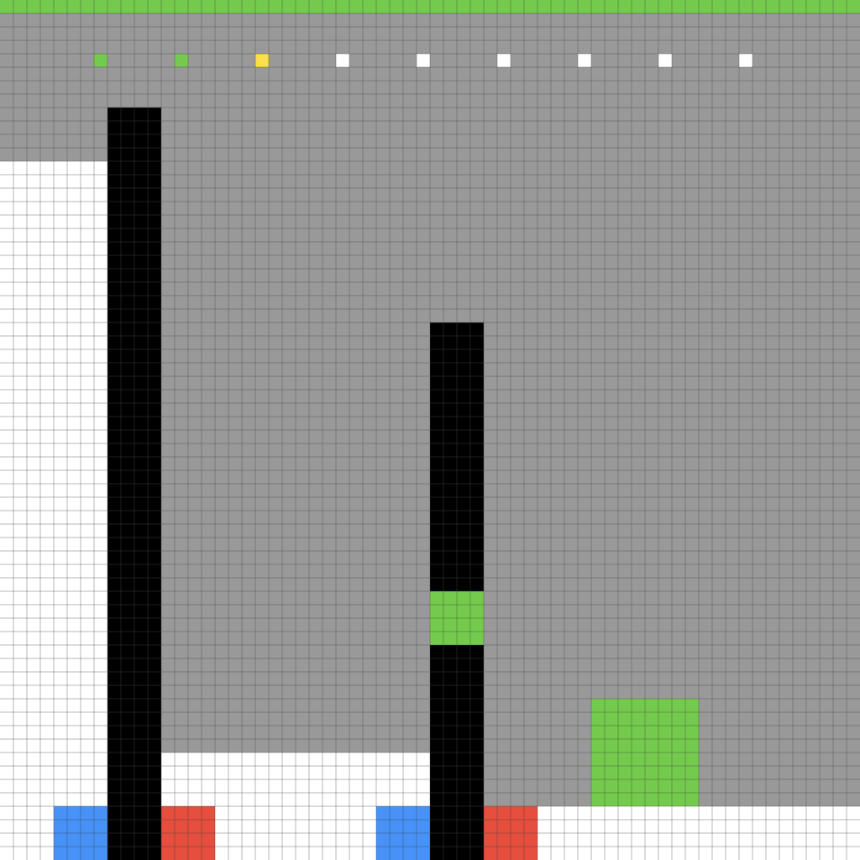
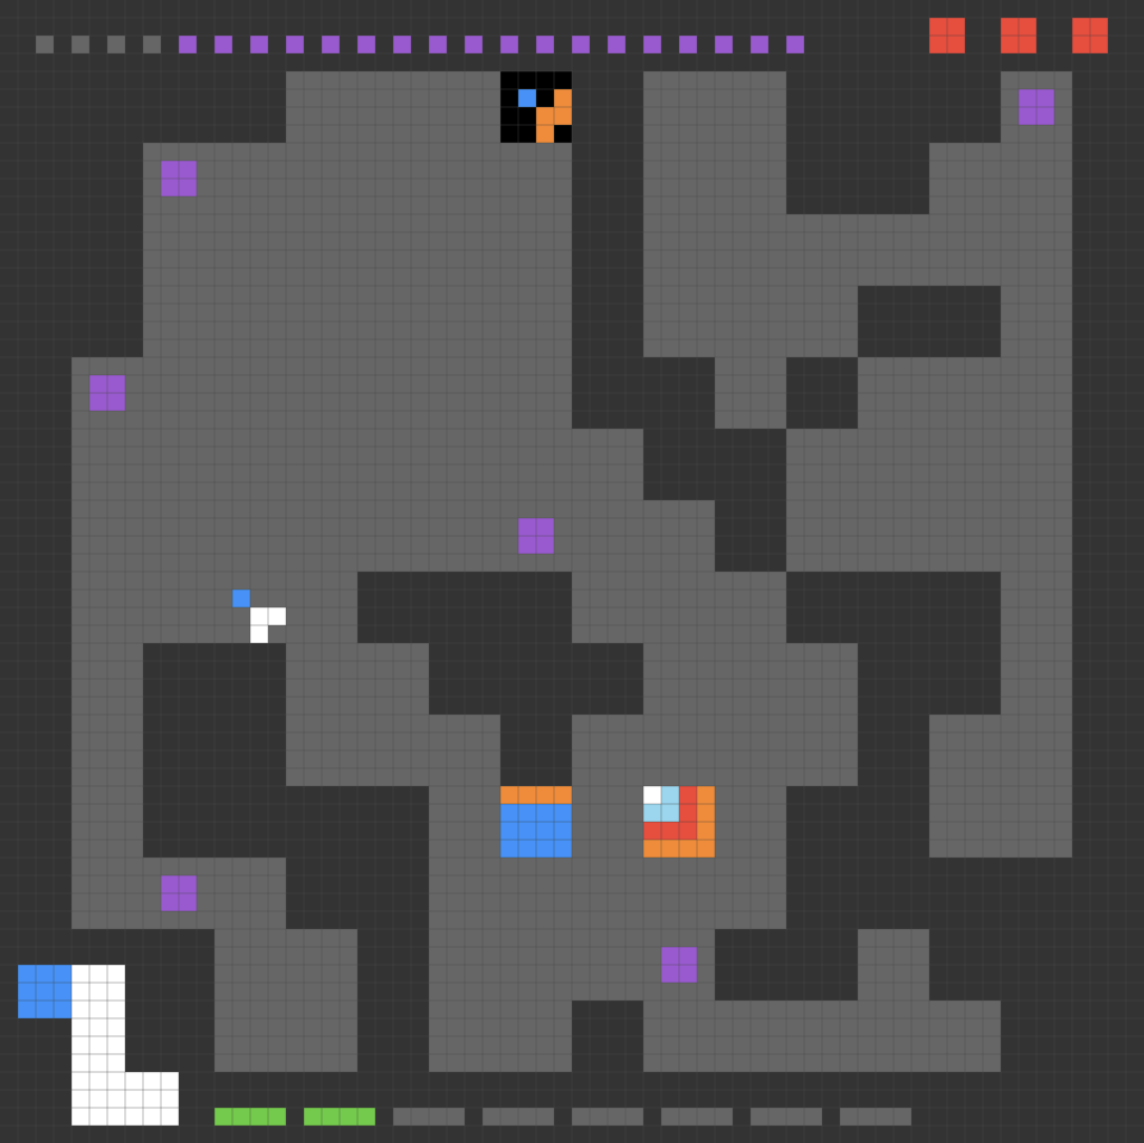
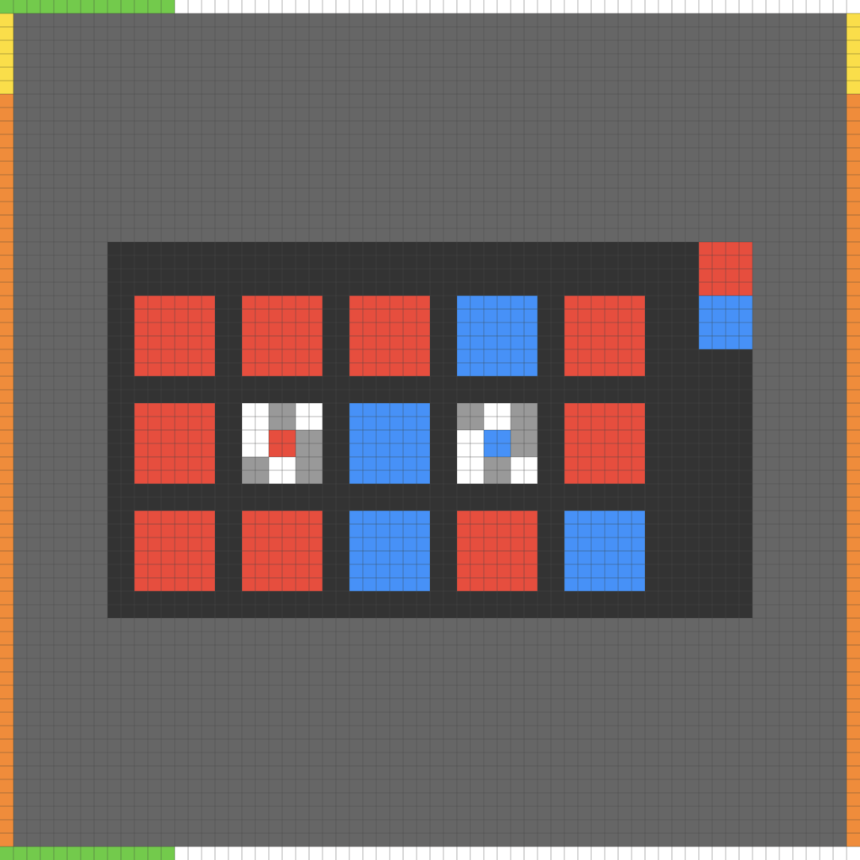
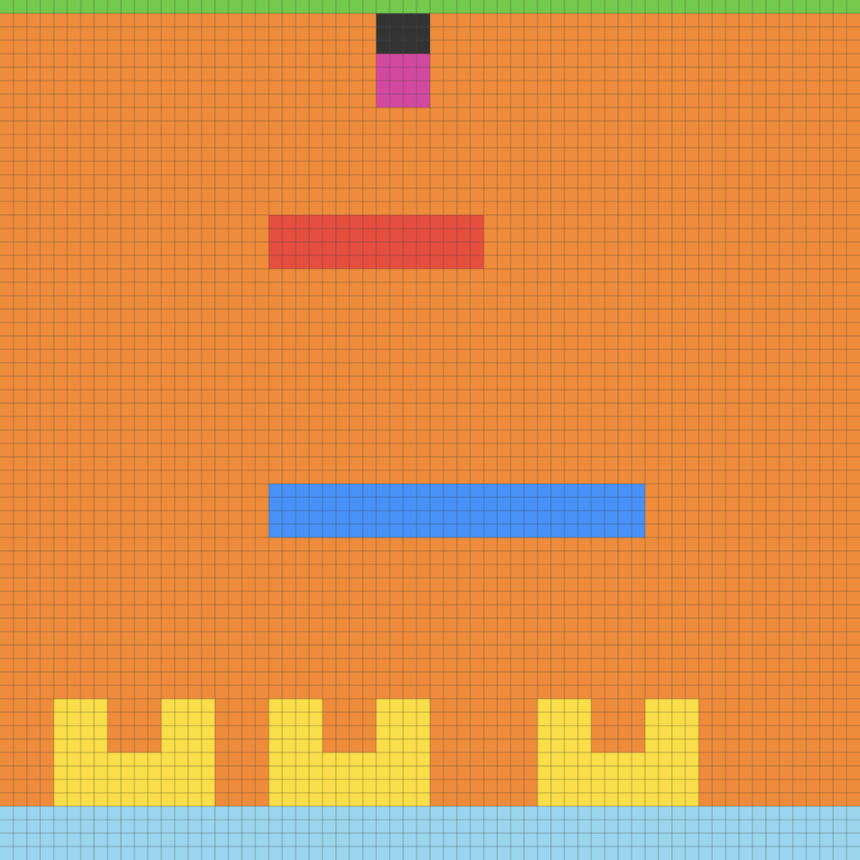
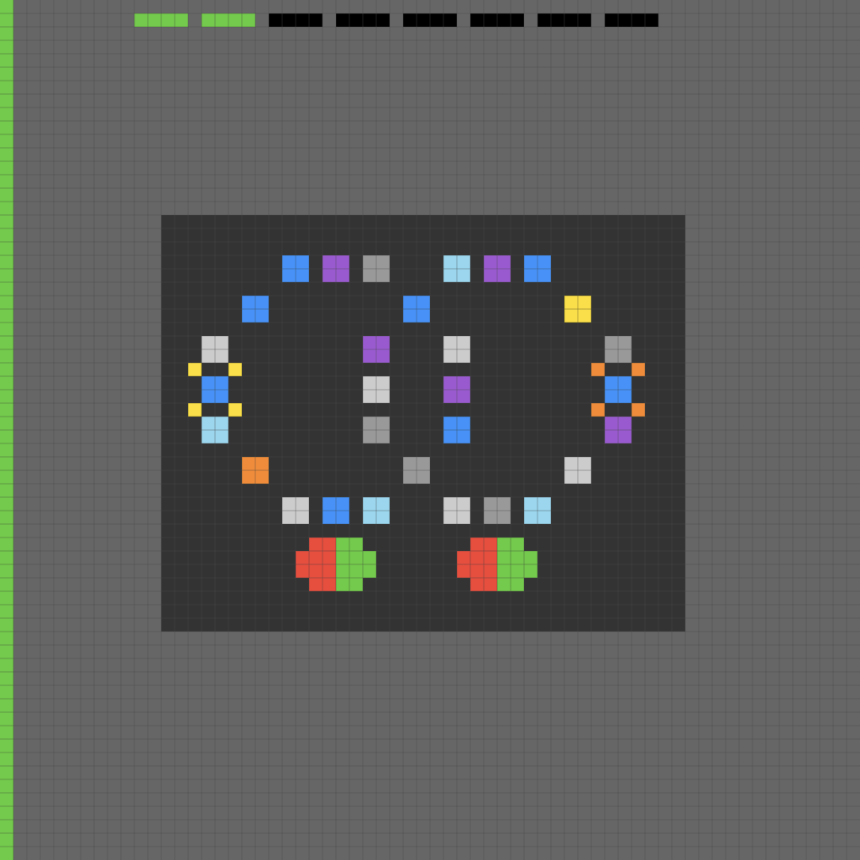
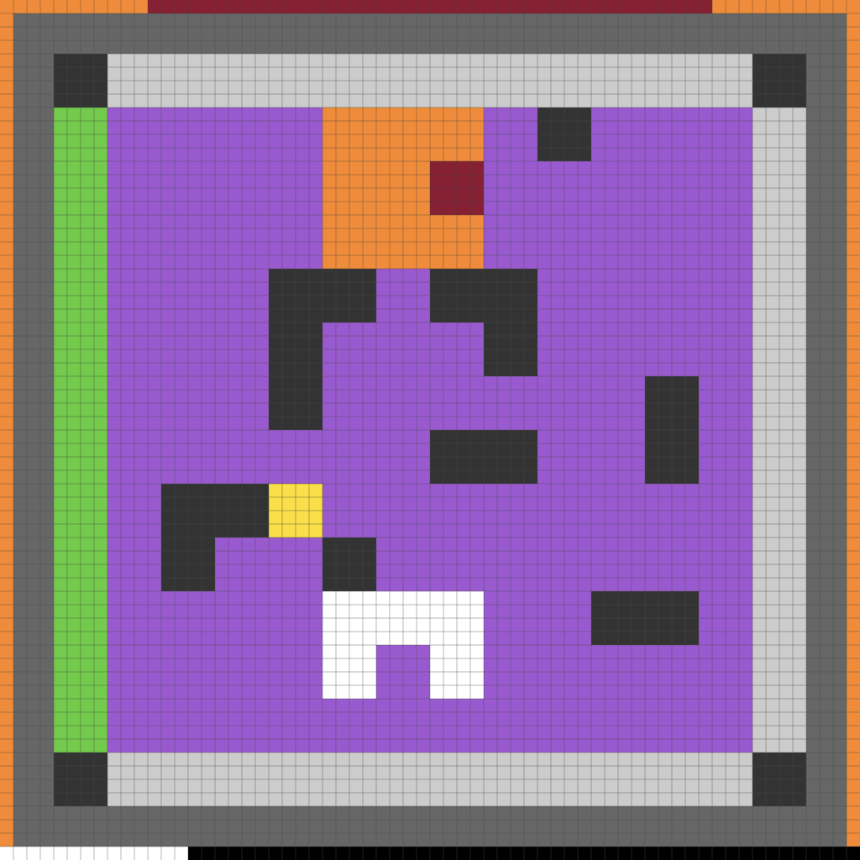
ARC-AGI-3 represents a significant evolution from the original ARC challenge, shifting from static grid-based reasoning to interactive game environments that test an agent’s ability to learn through exploration (ying_assessing_2025). The benchmark consists of 6 novel game environments, with 3 public games (ft09, ls20, vc33) released for development and 3 private games (sp80, lp85, as66) used to determine final leaderboard rankings. Each game contains between 8 and 10 levels, with each subsequent level introducing new mechanics. Figure 2 in the appendix shows example screenshots from the games.
The benchmark’s evaluation criterion prioritizes both effectiveness and efficiency: agents are scored based on the number of levels completed, with the total number of actions required serving as a tiebreaker. This dual objective encourages solutions that not only discover winning strategies but do so with minimal exploration. For the final evaluation experiments by ARC-AGI-3 organizers, each run was capped at 8 hours of wall-clock time and 10 environment steps per second (sps), shared across the three private games. Under these limits, a single game can receive at most 96,000 steps
### Observation and Action Spaces
#### Visual Observations.
Agents receive visual observations as 64 $\times$ 64 pixel RGB frames with a discrete palette of 16 colors. Each frame contains both the game environment and a status bar displaying the number of steps remaining before an automatic level restart. When the step counter reaches zero, the current level resets to its initial state. In the majority of games, the number of levels passed is also displayed.
#### Action Spaces.
The benchmark features three control schemes. Games such as ls20 use arrow-based control with directional keyboard inputs (up, down, left, right), yielding an action space of size $|\mathcal{A}|=4$ . Games such as ft09, vc33, and lp85 employ click-based control, enabling spatial interaction by allowing the agent to click any pixel location in the frame, yielding an action space of size $|\mathcal{A}|=64\times 64=4{,}096$ . Private games (sp80 and as66) introduce combined control schemes that integrate both arrow and click inputs, resulting in action spaces of size $|\mathcal{A}|=4{,}100$ .
The dramatic difference in action space cardinality between control schemes poses a fundamental challenge: click-based games present over 1,000 times more possible actions at each state than arrow-based games, making exhaustive exploration intractable without intelligent action selection.
### Task Structure and Mechanics
Each game in ARC-AGI-3 embodies a distinct set of mechanics and objectives that agents must discover through interaction. The only feedback signal is level completion: the environment advances to the next level when the agent satisfies (unknown) winning conditions, or resets to the beginning when the step limit expires.
Within each game, levels progressively add new elements while retaining earlier ones. For example, level 1 of ls20 requires basic movement and the use of the transformer object to activate the exit door by adjusting the shape of a key, level 2 adds energy palletes to refill the number of steps remaining, level 3 introduces color dimension to the key, and so forth, up to level 8, when the agent must manage with only partial observations. This progressive structure mirrors how humans naturally acquire skills in games, but poses challenges for algorithms: knowledge transfer between levels could accelerate learning, but the levels are connected on a highly abstract level.
The released games operate deterministically: the same action taken from the same state always produces the same outcome. This property enables systematic state-space exploration strategies and graph-based representations of explored states. However, determinism does not imply simplicity; the complexity arises from the large state and action spaces and the lack of prior knowledge about which actions lead toward goal states.
## Methods
Our approach comprises two primary components: a Frame Processor for extracting key visual features and a Level Graph Explorer for systematic state-space exploration.
### Frame Processor
The Frame Processor reduces irrelevant visual variability and directs exploration toward actionable regions of the game environment through the following operations:
#### Image Segmentation.
Each frame is segmented into single-color connected components, establishing the foundation for identifying distinct visual elements that may constitute interactive objects.
#### Status Bar Detection and Masking.
To prevent conflation of environment features with user interface components, the processor identifies and masks probable status bars. This preprocessing substantially reduces the number of recognized states.
#### Priority-Based Action Grouping.
For click-controlled games, visual segments are stratified into five priority tiers based on their likelihood of representing interactive buttons or objects. Prioritization is determined by segment size, morphological features, and color salience. The lowest priority tier encompasses segments identified as probable status bars, ensuring their exploration only after exhausting higher-priority alternatives.
#### State Hashing.
The processor generates a hash representation of the masked image, serving as a unique identifier for the current game state. This hash facilitates efficient state tracking and duplicate detection during graph exploration.
### Level Graph Explorer
The Level Graph Explorer maintains a directed graph representation of the explored state space, where nodes correspond to unique game states and edges encode action-induced state transitions.
#### Graph Structure.
For each discovered state (graph node), the explorer maintains:
- The action space $\mathcal{A}$ identifiers of connected components for spatial interaction games such as ft09/cv33, keyboard inputs for games such as ls20)
- For each action $a\in\mathcal{A}$ : priority level $\pi(a)$ , exploration status, transition outcome, successor state, and minimal distance to the nearest unexplored frontier
#### Action Selection Strategy.
The explorer implements a hierarchical action selection policy that progressively expands the search space, as shown in Algorithm 1.
Algorithm 1 Hierarchical Action Selection
0: Current state $s$ , priority threshold $p$
if $\exists$ untested actions with priority $\pi(a)\leq p$ in state $s$ then
Select uniformly at random an untested action $a$ where $\pi(a)\leq p$ from $s$
Execute action and update graph with observed transition
else if $\exists$ reachable state $s^{\prime}$ with untested actions where $\pi(a)\leq p$ then
Select action minimizing distance to reachable state $s^{\prime}$ with untested actions at priority $\leq p$
Execute selected action
else
Increment priority threshold: $p\leftarrow p+1$
Recurse from current state $s$ with updated priority $p$
end if
This policy ensures systematic exploration of high-salience actions prior to considering lower-priority alternatives, thereby focusing computational resources on likely-relevant state-action pairs.
#### Frontier Management.
The explorer maintains the shortest-path distances from each explored state to frontier states, those containing untested actions. These distance metrics always guide traversal toward unexplored regions.
## Baselines
We evaluate our approach against two baseline methods to demonstrate the effectiveness of structured exploration.
#### Random Agent.
A simple baseline that selects actions uniformly at random from the available action space at each step. This baseline provides a lower bound on performance and demonstrates the difficulty of solving tasks through undirected exploration alone.
#### LLM+DSL.
We compare against the best-performing LLM-based solution on the leaderboard (fluxon_arc_2025), which combines GPT-4.1 with domain-specific language (DSL) programming. The approach observes game frames and generates Python code to interact with the environment, attempting to discover game mechanics through programmatic reasoning. Despite using a frontier LLM, this approach demonstrates the current limitations of LLM-based methods for interactive reasoning tasks.
Because each environment step is gated by an LLM call, it is severely interaction-limited: within the evaluation budget, it produces only about 4,000 interactions per game, compared to the 96,000 steps that are in principle allowed. To avoid high LLM usage costs, we do not re-run this baseline; instead, we report the results from its official evaluation on the private games, with the limitation that only a single aggregate score is available and no results are reported on the public games.
## Results
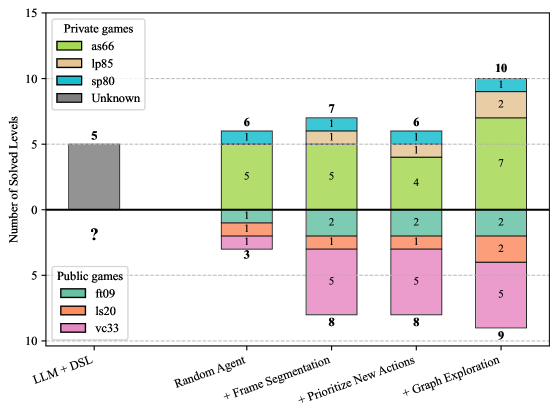
We evaluated our graph-based exploration method on all six ARC-AGI-3 games. Figure 1 reports an incremental component-addition analysis: starting from a random agent, we cumulatively add components and measure the total levels solved across games; the LLM+DSL baseline is included for comparison. Here, to ensure a fair comparison with the LLM-based baseline, all methods are capped at 4,000 interactions per game. All non-LLM configurations report the median over 5 runs, whereas the LLM+DSL baseline is shown as a single result taken from the official challenge evaluation.
<details>
<summary>x1.png Details</summary>
### Visual Description
## Bar Chart: Performance of Agents on Private and Public Games
### Overview
This image displays a diverging stacked bar chart comparing the performance of different agent configurations in solving levels for "Private games" (plotted on the positive y-axis) and "Public games" (plotted on the negative y-axis). The x-axis represents five distinct agent configurations, showing an incremental improvement process.
### Components/Axes
* **Y-Axis:** Labeled "Number of Solved Levels".
* Positive values (0 to 15) represent "Private games".
* Negative values (0 to 10) represent "Public games".
* **X-Axis:** Lists the agent configurations:
1. `LLM + DSL`
2. `Random Agent`
3. `+ Frame Segmentation`
4. `+ Prioritize New Actions`
5. `+ Graph Exploration`
* **Legends:**
* **Top-Left (Private games):**
* Light Green: `as66`
* Light Tan/Beige: `lp85`
* Cyan/Teal: `sp80`
* Grey: `Unknown`
* **Bottom-Left (Public games):**
* Greenish-Teal: `ft09`
* Orange/Peach: `ls20`
* Pink/Magenta: `vc33`
### Detailed Analysis
The following data is extracted from the stacked bars. The numbers inside the segments represent the count of solved levels for that specific sub-category.
| Configuration | Private Games (Top) | Total Private | Public Games (Bottom) | Total Public |
| :--- | :--- | :--- | :--- | :--- |
| **LLM + DSL** | Grey: 5 | **5** | ? (No data) | **?** |
| **Random Agent** | Green: 5, Cyan: 1 | **6** | Teal: 1, Orange: 1, Pink: 1 | **3** |
| **+ Frame Segmentation** | Green: 5, Tan: 1, Cyan: 1 | **7** | Teal: 2, Orange: 1, Pink: 5 | **8** |
| **+ Prioritize New Actions** | Green: 4, Tan: 1, Cyan: 1 | **6** | Teal: 2, Orange: 1, Pink: 5 | **8** |
| **+ Graph Exploration** | Green: 7, Tan: 2, Cyan: 1 | **10** | Teal: 2, Orange: 2, Pink: 5 | **9** |
*Note: The numbers above the top bars and below the bottom bars represent the total sum of solved levels for that column.*
### Key Observations
* **Incremental Improvement:** There is a clear upward trend in performance as features are added. The `+ Graph Exploration` configuration achieves the highest performance in both categories (10 Private, 9 Public).
* **Dominant Sub-categories:**
* In **Private games**, the `as66` (Green) component consistently contributes the highest number of solved levels, peaking at 7 in the final configuration.
* In **Public games**, the `vc33` (Pink) component is the primary driver of performance, consistently contributing 5 solved levels from the `+ Frame Segmentation` stage onwards.
* **Data Gap:** The `LLM + DSL` configuration is the only one that lacks data for "Public games," marked explicitly with a question mark.
* **Stability:** The `sp80` (Cyan) component in Private games is highly stable, contributing exactly 1 solved level across all configurations where it appears.
### Interpretation
This chart illustrates an ablation or incremental feature-addition study for an AI agent.
* **Performance Scaling:** The data suggests that "Graph Exploration" is the most critical feature for scaling performance, as it results in the highest jump in solved levels for Private games (from 6 to 10) and a slight increase for Public games (from 8 to 9).
* **Feature Specialization:** The consistent contribution of `vc33` (Pink) to Public games suggests that this specific sub-component is highly specialized for the Public game environment, whereas `as66` (Green) is the workhorse for Private games.
* **Baseline Comparison:** The `LLM + DSL` baseline is insufficient for comparison against the other agents regarding Public games, suggesting that the "Random Agent" and subsequent iterations are likely built upon a different or more advanced framework than the initial `LLM + DSL` test.
</details>
Figure 1: Effect of progressively adding method components to a random agent, compared with the LLM+DSL baseline. For each configuration, the stacked bar above the horizontal axis shows the total number of solved levels across the three private games, and the stacked bar below shows the total across the three public games. Colors indicate how many levels are solved in each individual game. The rightmost bars correspond to the full method. All non-LLM configurations report the median over 5 runs, whereas the LLM+DSL baseline is shown as a single result taken from the official challenge evaluation.
The random agent and LLM+DSL baseline solve 6 and 5 levels on the private games, respectively, meaning that the LLM-based method underperforms even a random policy. The random agent also solves 3 levels across the public games.
Adding frame segmentation to random exploration slightly increases performance on the private games, making it possible to solve one level of lp85. It also significantly improves performance on the public games, solving 5 levels on vc33 and 2 levels on ft09.
When, in each state, untested actions are favored without full state-graph exploration, performance slightly decreases on as66, and the method is able to solve only 4 levels.
Our complete approach solves 19 levels with an interaction limit of 4,000: 2 on ft09, 2 on ls20, 5 on vc33, 1 on sp80, 2 on lp85, and 7 on as66.
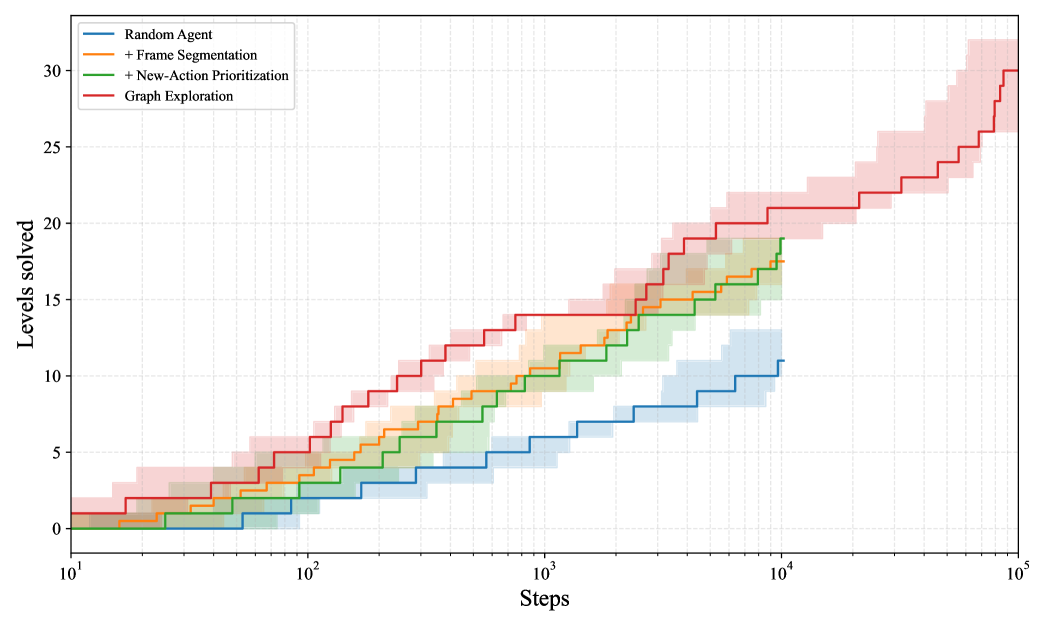
In a full 8-hour run, across 5 independent runs, our method solves a median of 16 levels on the private games and 14 levels on the public games (see Figure 3 in the appendix). Per-level performance is reported in Tables 1 and 2 in the appendix.
On the official ARC-AGI-3 challenge evaluation, the submitted model solves 12 levels on the private games while still ranking 3rd by the number of solved levels. This discrepancy is due to an implementation bug in how reset-inducing actions are handled (see Discussion).
## Discussion
Our graph-based exploration method demonstrates that structured state-space navigation with visual prioritization significantly outperforms both random exploration and frontier LLMs with access to code writing and execution on ARC-AGI-3.
#### Performance Analysis.
The method excelled on games where visual salience aligned with interactive elements (vc33, as66). Performance degraded on games with extremely large state spaces (ft09 levels 6+, ls20 levels 3+), where exhaustive exploration becomes computationally intractable. The improvement over LLM+DSL baselines suggests that structured exploration provides a more reliable foundation for interactive reasoning than pure language-model-based approaches, which struggle to form and test hypotheses systematically.
The discrepancy between the official ARC-AGI-3 evaluation and our re-runs is due to an implementation bug in the handling of reset events. Actions that triggered a reset were not marked as tested in the game graph. Consequently, when such a state–action pair was the nearest remaining untested edge in the graph from the starting node, the agent repeatedly selected it, resetting the game and effectively entering a loop.
#### Limitations.
The method faces two fundamental constraints. First, computational requirements grow linearly with state space size, limiting scalability to levels with moderate complexity. Second, the approach assumes deterministic, fully observable environments and would fail under stochasticity or partial observability.
#### Future Directions.
While the first-place solution on the leaderboard (smit_driessmitarc3-solution_2025) achieved superior performance with a learning-based approach, it did not incorporate structured exploration strategies. A natural next step is to integrate our graph-based exploration framework with adaptive learning algorithms. Such hybrid approaches could leverage graph representations to guide model training and action selection, while learned world models or policies could improve sample efficiency through generalization. The key challenge remains the sparse reward signal and limited training data, making it essential to develop methods that can effectively transfer knowledge across levels while maintaining systematic exploration coverage.
## Appendix A Appendix A: ARC-AGI-3 Games
|
<details>
<summary>Figures/vc33.png Details</summary>
### Visual Description
## Diagram: Grid-Based Logic Puzzle State
### Overview
The image is a 2D, grid-based representation of a logic puzzle or level design, rendered in a pixel-art style. The scene is set against a white background with a gray grid overlay. The composition features a sequence of colored markers at the top, two vertical structures (pillars) with distinct base markers, and a standalone green block on the bottom right. There is no textual information present in the image.
### Components/Axes
The image is constructed on a uniform grid. The components are positioned as follows:
* **Top Row (Status/Sequence Bar):** A horizontal row of 10 colored squares positioned near the top of the gray background area.
* **Vertical Pillars:** Two distinct vertical structures composed of black pixels.
* **Left Pillar:** A tall, solid black column.
* **Right Pillar:** A shorter black column featuring a green segment in the middle.
* **Base Markers:** Both pillars are flanked at their base by colored squares.
* **Ground Object:** A green square block located on the bottom right of the grid.
### Detailed Analysis
#### 1. Top Row Sequence
Located at the top of the gray area, there is a sequence of 10 squares. From left to right, the colors are:
1. Green
2. Green
3. Yellow
4. White
5. White
6. White
7. White
8. White
9. White
10. White
#### 2. Vertical Pillars
* **Left Pillar:** A tall, solid black vertical bar. It spans from the bottom white floor area up into the gray background area. At its base, it is flanked by a **Blue square** on the left and a **Red square** on the right.
* **Right Pillar:** A shorter black vertical bar. It also spans from the bottom white floor area into the gray background. It contains a **Green square** segment embedded in the middle of the black column. At its base, it is also flanked by a **Blue square** on the left and a **Red square** on the right.
#### 3. Ground Object
* **Green Block:** Located in the bottom-right quadrant of the image, sitting on the white floor area. It appears to be a square block (approximately 4x4 grid units in size).
### Key Observations
* **Symmetry:** The base markers (Blue/Red) are identical for both pillars, suggesting a consistent control or interaction mechanism (e.g., "Blue" and "Red" switches or polarity).
* **Asymmetry:** Despite the identical bases, the pillars themselves are different. The left pillar is taller and solid black, while the right pillar is shorter and contains a green segment.
* **Color Coding:** The colors used (Green, Yellow, Blue, Red, White) are distinct and likely represent specific game mechanics or object types. The "Green" color appears in three contexts: the top sequence, the pillar segment, and the ground block, suggesting a thematic link between these elements.
* **Sequence:** The top row of squares acts as a header or a sequence indicator, with the first three squares (Green, Green, Yellow) being the only non-white elements.
### Interpretation
This image represents a state in a grid-based logic puzzle game. The visual language suggests a system where:
* **The Pillars** likely act as obstacles or interactive elements that can be manipulated or traversed.
* **The Base Markers (Blue/Red)** suggest a binary interaction system, perhaps indicating that the pillars can be toggled, moved, or activated using blue or red inputs.
* **The Green Segment** in the right pillar and the **Green Block** on the floor suggest that the right pillar may be related to the green block—perhaps the pillar is a receptacle for the block, or the block is a key to activating the pillar.
* **The Top Sequence** likely represents a "level goal" or a "code" that the player must solve. The presence of "Green, Green, Yellow" followed by seven "White" squares implies a sequence of actions or a state-matching requirement that the player must fulfill to complete the level.
The lack of text confirms this is a pure logic/spatial puzzle where the rules are communicated entirely through color and geometry.
</details>
|
<details>
<summary>Figures/ls20.png Details</summary>
### Visual Description
## Diagram: Grid-Based Puzzle Level Layout
### Overview
The image depicts a top-down, grid-based puzzle level, characteristic of logic-based video games (e.g., *Baba Is You* or similar block-pushing puzzle games). The environment consists of a dark grey background with lighter grey walkable paths defined by walls. Various colored blocks and shapes are distributed throughout the map, and there are status bars at the top and bottom of the frame.
### Components/Axes
* **Grid System:** The entire map is constructed on a uniform square grid.
* **Walls:** Represented by the dark grey areas. These appear to be impassable boundaries.
* **Walkable Space:** Represented by the lighter grey areas.
* **Status Bars:**
* **Top Bar:** A horizontal sequence of squares spanning the width of the map.
* **Bottom Bar:** A horizontal sequence of squares spanning the width of the map.
* **Interactive Objects:**
* **Purple Squares:** Scattered throughout the map.
* **White L-Shaped Blocks:** Located on the left side.
* **Blue and Orange Squares:** Located in the center and top-center.
* **Red Squares:** Located in the top-right corner.
### Detailed Analysis
#### 1. Status Bars
* **Top Bar (Header):** A horizontal row of squares positioned at the very top of the grid.
* **Composition:** 6 grey squares, followed by 25 purple squares, followed by 3 red squares.
* **Bottom Bar (Footer):** A horizontal row of squares positioned at the very bottom of the grid.
* **Composition:** 2 green squares, followed by 8 grey squares.
#### 2. Interactive Objects (Spatial Grounding)
* **Top-Center:** A 2x2 black block containing a blue square (top-left quadrant of the block) and an orange square (bottom-right quadrant of the block).
* **Top-Right:** A cluster of 3 red squares arranged horizontally.
* **Middle-Left:** A white L-shaped object consisting of 3 blocks (2 vertical, 1 horizontal).
* **Center:** A blue square and an orange square positioned adjacent to each other (blue on the left, orange on the right).
* **Bottom-Left:** A large white L-shaped object consisting of 5 blocks (3 vertical, 2 horizontal).
* **Scattered Purple Squares:** These are distributed as follows:
* One in the top-left quadrant.
* One in the mid-left quadrant.
* One in the center-left.
* One in the center (near the wall).
* One in the bottom-center.
* One in the top-right area.
#### 3. Map Layout (Walls vs. Paths)
* The map is a maze-like structure.
* The central area is dominated by a large, dark grey wall mass that forces movement around the perimeter or through specific corridors.
* The layout is asymmetrical, suggesting a specific pathing requirement to solve the puzzle.
### Key Observations
* **Color Coding:** The colors likely represent specific game mechanics (e.g., "pushable," "hazard," "goal," or "key").
* **Progress Tracking:** The top and bottom bars likely function as a progress tracker or an inventory display, where the colors correspond to the objects found or objectives completed within the level.
* **Object Pairing:** The presence of blue/orange pairs in both the top-center and the middle of the map suggests a relationship between these objects, possibly requiring them to be moved to specific locations.
* **L-Shaped Blocks:** The two white L-shaped blocks are the largest objects in the level, suggesting they may be obstacles or tools that require specific maneuvering.
### Interpretation
This image represents a static state of a logic puzzle level. The data suggests a "block-pushing" or "sokoban-style" game.
* **Mechanics:** The player likely controls an entity (not explicitly visible, or perhaps represented by one of the blocks) to manipulate the colored squares.
* **Objective:** The goal is likely to clear the level by moving the colored blocks into specific configurations or by collecting them. The top bar, which contains a large number of purple squares, suggests that collecting or interacting with purple squares is a primary objective.
* **Complexity:** The maze-like wall structure indicates that the difficulty lies in navigating the objects through narrow corridors without getting them stuck against walls. The distinct separation of the blue/orange pair in the center versus the top-center suggests a "matching" or "transport" mechanic is required to solve the level.
</details>
|
<details>
<summary>Figures/ft09.png Details</summary>
### Visual Description
## Diagram: Grid-Based Logic Puzzle Layout
### Overview
The image displays a structured, grid-based layout, likely representing a level design, a puzzle interface, or a game board. The composition consists of a large, dark gray background grid framed by colored borders, containing a central rectangular panel with a 5x3 grid of colored squares and two distinct "spinner" or "target" icons. There is no textual information present in the image.
### Components/Axes
* **Outer Frame:** A large, dark gray grid background.
* **Top Border:** A series of green squares.
* **Bottom Border:** A series of green squares.
* **Left Border:** A series of yellow/orange squares.
* **Right Border:** A series of orange squares.
* **Central Panel:** A dark gray rectangle positioned in the center of the frame.
* **Grid Layout:** A 5-column by 3-row grid of colored squares.
* **Right-Side Stack:** A 1-column by 2-row stack of colored squares attached to the top-right of the central panel.
* **Icons:** Two unique "spinner" icons located within the central grid.
### Detailed Analysis
#### Central Panel Grid (5x3)
The grid is organized into 5 columns and 3 rows. The colors are consistent throughout.
| Row | Col 1 | Col 2 | Col 3 | Col 4 | Col 5 |
| :--- | :--- | :--- | :--- | :--- | :--- |
| **1 (Top)** | Red square | Red square | Red square | Blue square | Red square |
| **2 (Middle)** | Red square | Spinner (Red Center) | Blue square | Spinner (Blue Center) | Red square |
| **3 (Bottom)** | Red square | Red square | Blue square | Red square | Blue square |
#### Right-Side Stack (Attached to Central Panel)
* **Top Position:** Red square
* **Bottom Position:** Blue square
#### Spinner Icon Details
* **Appearance:** Both icons are white squares containing a pinwheel-like pattern composed of gray and white segments.
* **Variation:**
* The icon at Row 2, Col 2 features a **Red** center.
* The icon at Row 2, Col 4 features a **Blue** center.
### Key Observations
* **Symmetry/Asymmetry:** The grid is not perfectly symmetrical. While the spinner icons are placed symmetrically at columns 2 and 4 of the middle row, the distribution of red and blue squares is irregular.
* **Color Clustering:** There is a distinct clustering of red squares on the left side of the grid, while blue squares are more prevalent in the right half and the bottom row.
* **The Stack:** The 1x2 stack on the right (Red over Blue) mirrors the color scheme of the spinner centers (Red and Blue), suggesting a potential relationship or dependency between the stack and the spinners.
### Interpretation
The data suggests this is a state-based logic puzzle. The presence of "spinner" icons—which are visually distinct from the static colored squares—implies that these are interactive elements.
* **Mechanics:** The puzzle likely involves manipulating the spinners to change the state of the surrounding grid (e.g., toggling colors between red and blue).
* **Goal:** The objective may be to match the grid's configuration to a specific pattern, or perhaps to clear the board by aligning colors. The 1x2 stack on the right may serve as a "target" or "key" indicating the desired state for the spinners or the final configuration of the grid.
* **Peircean Investigative Note:** The visual language (grid, distinct colors, interactive-looking icons) is characteristic of 2D puzzle games (e.g., *Baba Is You*, *Sokoban* variants, or *Lights Out*). The lack of text suggests the mechanics are intended to be intuitive or learned through trial and error. The border colors (Green/Yellow/Orange) may indicate different zones or difficulty levels, though they appear purely decorative in this static view.
</details>
|
| --- | --- | --- |
|
<details>
<summary>Figures/sp80.png Details</summary>
### Visual Description
## Diagram: Grid-Based Level Design
### Overview
The image is a digital, grid-based layout, resembling a level design for a 2D platformer game. It features a central orange background with various colored geometric obstacles and platforms arranged in a vertical, symmetrical, or semi-symmetrical fashion. The entire layout is contained within a grid of approximately 30x30 squares.
### Components/Axes
* **Background:** A uniform orange grid.
* **Top Border:** A single row of green squares spanning the entire width.
* **Bottom Border:** A single row of light blue squares spanning the entire width.
* **Obstacles/Platforms:**
* **Top Center:** A 1x1 black square positioned directly above a 1x1 magenta square.
* **Upper Middle:** A red rectangular platform.
* **Lower Middle:** A blue rectangular platform.
* **Bottom:** Three yellow U-shaped structures (or "cups").
### Detailed Analysis
The grid is approximately 30 units wide by 30 units high.
* **Top Section (Rows 1-5):**
* **Row 1:** Green border.
* **Row 2, Column 15:** A single black square.
* **Row 3, Column 15:** A single magenta square.
* **Upper Middle Section (Rows 8-9):**
* **Red Platform:** Spans from Column 10 to Column 20.
</details>
|
<details>
<summary>Figures/lp85.png Details</summary>
### Visual Description
## Diagram: Logic Grid Interface
### Overview
The image displays a digital interface, likely from a puzzle or logic-based software application. The background is a dark grey grid. The interface features a central rectangular area containing a symmetrical arrangement of colored squares forming two interlocking loops, with status indicators located along the top and left edges of the screen.
### Components/Axes
* **Top Status Bar:** A horizontal row of 10 rectangular slots. The first two slots (leftmost) are filled with green; the remaining eight slots are filled with black/dark grey.
* **Left Status Bar:** A continuous vertical column of green blocks running along the left edge of the image.
* **Main Display Area:** A centered, dark grey rectangular container.
* **Central Pattern:** Two interlocking loops composed of colored squares (light blue, purple, grey, yellow, orange).
* **Bottom Nodes:** Two circular icons positioned at the base of the interlocking loops, each split vertically into a red half and a green half.
### Detailed Analysis
The central pattern is arranged within the dark grey rectangle. The arrangement appears to be two interlocking loops, though the composition is asymmetrical in its color distribution:
* **Left Loop Structure:**
* **Top Arc:** Composed of three squares: Light Blue, Purple, and Grey.
* **Left Arc:** Composed of three squares: Yellow, Blue, and Light Blue.
* **Bottom:** A single Orange square.
* **Center/Intersection:** A vertical column of three Grey squares.
* **Right Loop Structure:**
* **Top Arc:** Composed of three squares: Light Blue, Purple, and Blue.
* **Right Arc:** Composed of five squares: Yellow, Grey, Orange, Blue, and Purple.
* **Bottom:** A single Grey square.
* **Bottom Nodes:**
* Located below the loops, there are two circular elements.
* **Left Node:** Split vertically, with the left half Red and the right half Green.
* **Right Node:** Split vertically, with the left half Red and the right half Green.
### Key Observations
* **Symmetry vs. Asymmetry:** While the overall shape of the two loops is roughly symmetrical, the color distribution is not. The right loop contains a higher density of colored squares (5 in the right arc) compared to the left loop (3 in the left arc).
* **Color Coding:** The colors (Light Blue, Purple, Grey, Yellow, Orange, Blue) likely represent specific variables, states, or puzzle pieces.
* **Status Indicators:** The green bars on the top and left suggest a "health," "energy," or "progress" metric, indicating that the user has a limited resource or is tracking a specific value.
* **Interlocking Design:** The shared central column of grey squares suggests a dependency or intersection between the two loops, typical of Venn diagram-style logic puzzles.
### Interpretation
This image is characteristic of a logic puzzle interface. The interlocking loops suggest that the user must manipulate the colored squares to satisfy a condition where the two loops interact. The red/green circular nodes at the bottom likely function as "submit" or "toggle" buttons, where the red/green split might indicate a binary state (e.g., "incorrect/correct" or "off/on"). The green bars on the periphery act as a constraint mechanism, implying that the user has a limited number of moves or a specific resource limit to complete the puzzle. The lack of text suggests a language-independent, icon-based UI design.
</details>
|
<details>
<summary>Figures/as66.png Details</summary>
### Visual Description
## Diagram: Grid-Based Level Map
### Overview
The image displays a top-down, grid-based layout, characteristic of a level design for a 2D puzzle or strategy game. The map is contained within a dark grey border and features a purple background populated by various geometric shapes in distinct colors (orange, red, yellow, white, black, green, and light grey). There is no textual information present in the image.
### Components/Axes
* **Grid Structure:** The image is composed of a square grid, with the main play area (purple) appearing to be approximately 20x20 units.
* **Border:** A dark grey frame surrounds the entire play area.
* **Color-Coded Elements:**
* **Purple:** The primary background/floor.
* **Black:** Static obstacles or walls.
* **White:** A 3x3 square block, likely representing the player character.
* **Orange:** A 4x3 rectangular zone located at the top center.
* **Red:** A 1x1 square located within the orange zone.
* **Yellow:** A 1x1 square located in the left-center region.
* **Green:** A vertical strip along the left edge of the purple area.
* **Light Grey:** A vertical strip along the right edge of the purple area.
### Detailed Analysis
The map is organized into specific zones and obstacles:
* **Top Region:** An orange rectangle (approx. 4x3) is positioned at the top center. Inside this rectangle, a single red square is placed at the bottom-right corner of the orange block. To the right of this orange block, there is a 2x2 black square obstacle.
* **Left Region:** A vertical green strip runs the full height of the purple play area.
* **Right Region:** A vertical light grey strip runs the full height of the purple play area.
* **Central Obstacles (Black Blocks):**
* **Upper-Center:** An L-shaped black block.
* **Center-Right:** A horizontal 3x1 black block.
* **Far-Right:** A vertical 3x1 black block.
* **Lower-Right:** A horizontal 2x1 black block.
* **Left-Center:** A horizontal 2x1 black block.
* **Interactive/Player Elements:**
* **Yellow Square:** Positioned immediately to the right of the left-center black block.
* **White Block:** A 3x3 square located in the bottom-center of the grid, appearing to be the largest movable or interactive object.
### Key Observations
* **Spatial Constraints:** The white block (player) is centrally located at the bottom, but is physically blocked from moving upward by the arrangement of black obstacles.
* **Asymmetry:** The placement of the black obstacles creates a maze-like path. The path appears to be more open on the right side of the grid compared to the left.
* **Color Significance:** The use of distinct colors (Orange/Red vs. Yellow vs. White) suggests a hierarchy of importance:
* **White:** Likely the active agent.
* **Yellow:** Likely a goal, key, or switch.
* **Orange/Red:** Likely the exit or a high-priority destination.
### Interpretation
This image represents a logic puzzle level. The design implies a "Sokoban-style" mechanic where the white block must navigate around the black obstacles to reach a specific destination.
* **The Goal:** Given the distinct color of the orange/red zone at the top, it is highly probable that this is the target destination for the white block.
* **The Obstacle Logic:** The black blocks are positioned to force a specific path. The yellow block acts as a potential intermediary objective—perhaps a key that must be collected before the orange/red zone becomes accessible or "unlocked."
* **Environmental Cues:** The green and light grey vertical strips on the sides likely represent boundaries or "lanes" that may have different properties (e.g., speed modifiers, teleporters, or impassable walls), further complicating the navigation required to move the white block from the bottom to the top.
</details>
|
Figure 2: Top row (Public set): vc33, ls20, ft09. Bottom row (Private set): sp80, lp85, as66.
## Appendix B Appendix B: Per-Level Performance Statistics
<details>
<summary>x2.png Details</summary>
### Visual Description
## Line Chart: Performance Comparison of Reinforcement Learning Agents
### Overview
This image displays a line chart comparing the performance of four different reinforcement learning agents. The chart plots "Levels solved" (Y-axis) against the number of "Steps" taken (X-axis). The X-axis uses a logarithmic scale, spanning from $10^1$ to $10^5$ steps. The chart demonstrates that the "Graph Exploration" agent significantly outperforms the other three agents, which appear to plateau or terminate at the $10^4$ step mark.
### Components/Axes
* **X-Axis:** Labeled "Steps". It is a logarithmic scale ranging from $10^1$ to $10^5$.
* **Y-Axis:** Labeled "Levels solved". It is a linear scale ranging from 0 to 30+.
* **Legend:** Located in the top-left corner of the chart area.
* **Blue Line:** "Random Agent"
* **Orange Line:** "+ Frame Segmentation"
* **Green Line:** "+ New-Action Prioritization"
* **Red Line:** "Graph Exploration"
* **Visual Style:** The chart uses a "step" plot style, where values remain constant between steps. Shaded regions surrounding each line represent the variance or confidence interval for each agent's performance.
### Detailed Analysis
The following trends and data points are observed:
* **Blue Line (Random Agent):**
</details>
Figure 3: Levels solved as a function of environment steps for four methods: Random Agent, Random + Frame Segmentation, Random + Segmentation + New-Action Prioritization, and the full Graph Exploration method. The x-axis is logarithmic; each line shows the median over 5 runs and the shaded region shows the minimum–maximum range. Intermediate variants are shown up to 10,000 environment steps, while the Graph Explorer is plotted over the full evaluation budget.
Table 1: Per-level results on public games (ft09, ls20, vc33). For each game and level, we report the number of steps to solve the level (Stp), summarized as the median together with the minimum and maximum over 5 runs, and the solve rate (SR) over the same 5 runs. We use ‘NS‘ when a level is never solved within the step budget, and ‘-‘ when there is no such level for a given game.
| 1 2 | 125 $[48;340]$ 177 | 1 1 | 124 $[72;140]$ $3.2\times 10^{3}$ | 1 1 | 9 $[5;24]$ 7 | 1 1 |
| --- | --- | --- | --- | --- | --- | --- |
| $[5;433]$ | | $[1.9\times 10^{3};4.9\times 10^{3}]$ | | $[4;19]$ | | |
| 3 | $2.0\times 10^{4}$ | 1 | NS | 0 | 36 | 1 |
| $[3.0\times 10^{3};2.5\times 10^{4}]$ | | | | $[9;96]$ | | |
| 4 | NS | 0 | NS | 0 | 321 | 1 |
| $[298;541]$ | | | | | | |
| 5 | NS | 0 | NS | 0 | 287 | 1 |
| $[260;349]$ | | | | | | |
| 6 | NS | 0 | NS | 0 | $6.9\times 10^{4}$ | 0.8 |
| $[5.4\times 10^{4};8.3\times 10^{4}]$ | | | | | | |
| 7 | NS | 0 | NS | 0 | $4.7\times 10^{3}$ | 0.8 |
| $[1.5\times 10^{3};5.5\times 10^{3}]$ | | | | | | |
| 8 | NS | 0 | NS | 0 | 917 | 0.8 |
| $[627;929]$ | | | | | | |
| 9 | NS | 0 | - | - | NS | 0 |
| 10 | NS | 0 | - | - | - | - |
Table 2: Per-level results on private games (sp80, lp85, as66). Conventions as in Table 1.
| 1 2 | 227 $[153;373]$ $3.6\times 10^{4}$ | 1 1 | 143 $[106;181]$ $2.9\times 10^{3}$ | 1 1 | 39 $[13;47]$ 44 | 1 1 |
| --- | --- | --- | --- | --- | --- | --- |
| $[2.5\times 10^{4};5.0\times 10^{4}]$ | | $[1.1\times 10^{3};3.2\times 10^{4}]$ | | $[24;65]$ | | |
| 3 | $3.9\times 10^{4}$ | 0.4 | $1.7\times 10^{4}$ | 1 | 123 | 1 |
| $[3.6\times 10^{4};4.2\times 10^{4}]$ | | $[1.0\times 10^{4};8.2\times 10^{4}]$ | | $[25;339]$ | | |
| 4 | NS | 0 | $1.6\times 10^{3}$ | 1 | 99 | 1 |
| $[727;2.0\times 10^{4}]$ | | $[69;350]$ | | | | |
| 5 | NS | | $4.6\times 10^{3}$ | 0.8 | $2.2\times 10^{3}$ | 1 |
| $[2.2\times 10^{3};1.4\times 10^{4}]$ | | $[1.2\times 10^{3};2.9\times 10^{3}]$ | | | | |
| 6 | NS | 0 | $1.3\times 10^{4}$ | 0.4 | $1.3\times 10^{3}$ | 1 |
| $[1.1\times 10^{4};1.5\times 10^{4}]$ | | $[112;1.6\times 10^{3}]$ | | | | |
| 7 | NS | 0 | 334.5 | 0.4 | 363 | 1 |
| $[104;565]$ | | $[128;670]$ | | | | |
| 8 | NS | 0 | $9.9\times 10^{3}$ | 0.2 | $1.3\times 10^{3}$ | 1 |
| $[9.9\times 10^{3};9.9\times 10^{3}]$ | | $[168;2.9\times 10^{3}]$ | | | | |
| 9 | - | - | - | - | $3.4\times 10^{3}$ | 1 |
| $[361;8.7\times 10^{3}]$ | | | | | | |
| 10 | - | - | - | - | - | - |