# Group Deliberation Oriented Multi-Agent Conversational Model for Complex Reasoning
**Authors**: Zheyu Shi, Dong Qiu, Shanlong Yu
## Group Deliberation Oriented Multi Agent Conversational Model for Complex Reasoning
Zheyu Shi* Brown University Providence, USA zheyu\_shi@brown.edu
Dong Qiu New England College Henniker, USA DQiu\_GPS@nec.edu
Abstract -This study proposes a group deliberation multi-agent dialogue model to optimize the limitations of single-language models for complex reasoning tasks. The model constructs a threelevel role division architecture of "generation - verification integration." An opinion-generating agent produces differentiated reasoning perspectives, an evidence-verifying agent matches external evidence and quantifies the support of facts, and a consistency-arbitrating agent integrates logically coherent conclusions. A self-game mechanism is incorporated to expand the reasoning path, and a retrieval enhancement module supplements dynamic knowledge. A composite reward function is designed, and an improved proximal strategy is used to optimize collaborative training. Experiments show that the model improves multi-hop reasoning accuracy by 16.8%, 14.3%, and 19.2% on the HotpotQA, 2WikiMultihopQA, and MeetingBank datasets, respectively, and improves consistency by 21.5%. Its reasoning efficiency surpasses mainstream multi-agent models, achieving a balance between accuracy, stability, and efficiency, providing an efficient technical solution for complex reasoning.
Keywords- Multi-agent dialogue; group discussion; complex reasoning; role division; self-game mechanism; retrieval enhancement
## I. INTRODUCTION
In real-world scenarios of complex reasoning tasks (such as multi-hop question answering and group decision-making), multi-agent collaboration is a core requirement for overcoming the bottleneck of single-model reasoning depth. These tasks require integrating multi-dimensional information and verifying multi-source facts. Prior work has shown that multiagent interaction such as debate can improve factuality and reasoning robustness, implicitly addressing failure modes of
Shanlong Yu Georgia Institute of Technology Atlanta, USA joesyu779@outlook.com single-model reasoning. Furthermore, factual accuracy relies on pre-trained knowledge, making it difficult to dynamically supplement external information, resulting in insufficient stability and reliability in complex tasks. This study proposes a group deliberation multi-agent dialogue model: constructing a collaborative reasoning closed loop through role-based LLM agents (viewpoint generation, evidence verification, consistency arbitration), introducing a self-game mechanism to generate multi-path reasoning chains to expand perspectives, combining a retrieval enhancement module to dynamically supplement external knowledge to strengthen factual accuracy, and designing a reward model based on factual consistency and logical coherence, using a proximal strategy optimization to achieve multi-agent collaborative training. Multi-agent reinforcement learning has been extensively studied across a wide range of collaborative decision-making tasks.
## II. GROUP DELIBERATION MULTI-AGENT DIALOGUE MODEL DESIGN
## A. Role-Based LLM Agent Architecture
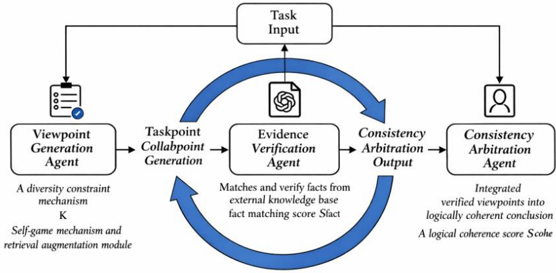
This model constructs a three-level collaborative architecture of "generation - verification - integration" (Figure 1), following the emerging paradigm of role-based multi-agent language model systems [1-2]. Through the division of labor and cooperation among LLM agents with differentiated functions, the architecture enables structured collaboration, similar to recent communicative agent frameworks [3]. The architecture starts with task input, and through a closed-loop process of opinion generation, evidence verification, and consistency arbitration, it outputs reasoning results that are diverse, factual, and logical.
Figure 1. Role-based Multi-agent Collaborative Reasoning Architecture.
<details>
<summary>Image 1 Details</summary>
### Visual Description
\n
## Diagram: System Architecture for Viewpoint Generation and Verification
### Overview
The image depicts a system architecture diagram illustrating a process for generating, verifying, and arbitrating viewpoints. The diagram shows a cyclical flow between several agents and a central evidence verification component. The overall process appears to be designed for creating logically coherent conclusions from task inputs.
### Components/Axes
The diagram consists of the following components:
* **Task Input:** Located at the top-center of the diagram, serving as the starting point for the process.
* **Viewpoint Generation Agent:** Positioned on the left side, with text describing "A diversity constraint mechanism" and "Self-game mechanism and retrieval augmentation module" below it. It has a small icon resembling a checklist.
* **Taskpoint Collaboration Generation:** A connecting box between the Viewpoint Generation Agent and the Evidence Verification Agent.
* **Evidence Verification Agent:** Located in the center, containing an icon resembling a document with a spiral. Text within the box states: "Matches and verify facts from external knowledge base fact matching score Sfact".
* **Consistency Arbitration Output:** Positioned to the right of the Evidence Verification Agent.
* **Consistency Arbitration Agent:** Located on the far right, with a human icon. Text below it states: "Integrated verified viewpoints into logically coherent conclusion. A logical coherence score Scohe".
* **Cyclical Arrows:** Large blue arrows indicate the flow of information between the agents, forming a loop.
### Detailed Analysis or Content Details
The diagram illustrates a cyclical process:
1. **Task Input** initiates the process.
2. The **Task Input** feeds into the **Viewpoint Generation Agent**, which generates viewpoints based on diversity constraints and self-game mechanisms.
3. The **Viewpoint Generation Agent** passes the viewpoints to **Taskpoint Collaboration Generation**.
4. **Taskpoint Collaboration Generation** passes the viewpoints to the **Evidence Verification Agent**.
5. The **Evidence Verification Agent** verifies facts against an external knowledge base, producing a "fact matching score" (Sfact).
6. The verified evidence is passed to **Consistency Arbitration Output**.
7. **Consistency Arbitration Output** passes the information to the **Consistency Arbitration Agent**.
8. The **Consistency Arbitration Agent** integrates the verified viewpoints into a logically coherent conclusion, generating a "logical coherence score" (Scohe).
9. The process then loops back to the **Evidence Verification Agent** via a blue arrow originating from the **Consistency Arbitration Agent**.
The diagram also includes the following textual elements:
* "A diversity constraint mechanism"
* "Self-game mechanism and retrieval augmentation module"
* "Matches and verify facts from external knowledge base fact matching score Sfact"
* "Integrated verified viewpoints into logically coherent conclusion. A logical coherence score Scohe"
### Key Observations
The diagram emphasizes a cyclical process of viewpoint generation, verification, and arbitration. The inclusion of scores (Sfact and Scohe) suggests a quantitative evaluation of the process's effectiveness. The use of "agents" implies a modular and potentially automated system.
### Interpretation
The diagram represents a system designed to produce reliable and logically sound conclusions from initial task inputs. The cyclical nature of the process suggests an iterative refinement of viewpoints based on evidence verification and consistency checks. The "diversity constraint mechanism" and "self-game mechanism" within the Viewpoint Generation Agent likely aim to explore a wide range of perspectives and challenge assumptions. The scores (Sfact and Scohe) provide metrics for assessing the quality of the evidence and the coherence of the final conclusion. The system appears to be geared towards applications where objective and well-supported conclusions are critical, such as knowledge discovery, decision-making, or automated reasoning. The diagram does not provide specific data or numerical values, but rather illustrates the architecture and flow of information within the system.
</details>
n Figure 1, arrows from each agent to the "Task Input" block indicate persistent read-only access, not reverse data flow. Each agent relies on the full task input throughout reasoning: the Viewpoint Generation Agent uses it to guide diverse trajectories, the Evidence Verification Agent aligns retrieved facts with the original context, and the Consistency Arbitration Agent ensures semantic coherence in final outputs. This context-preserving design maintains factual grounding and consistency in multiagent collaboration.
## 1) Viewpoint Generation Agent
The core function of this agent is to generate differentiated reasoning viewpoints based on the task input, avoiding the limitations of a single perspective. The generation of multiple differentiated viewpoints helps mitigate single-path reasoning bias, which is consistent with findings from self-consistency based reasoning methods [4]. Its generation process introduces a diversity constraint mechanism, mathematically expressed as:
Wherein, LLMV represents a dedicated LLM for opinion generation (such as a fine-tuned Llama 2), ωk is the viewpoint weight vector, following a multivariate normal distribution with mean μ and covariance matrix Σ , used to control the direction of opinion differentiation; This distribution is used for three reasons. First, the multivariate normal distribution offers a continuous, symmetric space around the reasoning center μ, supporting diverse yet coherent viewpoint generation without directional bias. Second, its covarian ce matrix Σ allows control over inter-factor correlations, enabling structured variations across reasoning dimensions. Third, Gaussian parameters align well with gradient-based learning and self-game updates, ensuring stable exploration and convergence. Thus, the normal distribution acts as an effective inductive bias balancing diversity, control, and stability, rather than assuming a fixed probabilistic form. Here, Emb(Q) is the task input embedding, ⊙ denotes element-wise multiplication, and weight modulation lets each Vk attend to different reasoning aspects. The selfgame mechanism explores varied reasoning paths, akin to treestructured deliberation.
## 2) Evidence Verification Agent
This agent is responsible for matching factual evidence with each candidate opinion Vk and verifying its reasonableness. This retrieval-enhanced verification process is inspired by retrieval-augmented generation frameworks that integrate external knowledge to improve factual grounding in language models [5]. Its core function is to calculate the factual matching degree between the opinion and the evidence:
In the formula, ℰk is the set of evidence related to Vk retrieved from the external knowledge base 𝒦 , | ℰk | represents the number of evidence (the first 5 are taken by default); Emb (⋅) is the embedding function based on SentenceBERT, Tr (⋅) represents the matrix trace operation, ‖ ⋅ ‖ F is the Frobenius norm, which is essentially an improved cosine similarity calculation, Sfact ∈ [ 0 , 1 ] , and the larger the value, the stronger the factual support for the viewpoint [4]. The viewpoint enters the next stage only when Sfact ( Vk , ℰk ) ≥ τ ( τ = 0 . 75 is the preset threshold).
## 3) Consistency Arbitration Agent
Its responsibility is to integrate the verified viewpoints and output a logically coherent unified conclusion. Its logical coherence evaluation formula is:
Where LLMC is the arbitration-specific LLM, Prompt cohe is the logical evaluation prompt, wcohe and bcohe are linear transformation parameters; σ (⋅) is the Sigmoid function, mapping the evaluation result to the [0,1] interval, and a higher Scohe indicates a more coherent conclusion logic.
## B. Self-Game Mechanism
To enrich the diversity of reasoning paths, a self-game mechanism between agents is designed to generate multi-path reasoning chains through viewpoint confrontation:
$$\sum _ { k = 1 } ^ { n } \lambda _ { j = k } S _ { fact ( V _ { i } ) } ^ { 2 }$$
In the formula, η is the learning rate (default 0.01), and ∇ ωk represents the gradient with respect to the weight vector ωk . This formula updates the viewpoint weights by maximizing the difference in factual matching between the current viewpoint and other viewpoints, thereby promoting the generation of more diverse and effective reasoning paths.
## C. Reward Model
A composite reward function integrating factual consistency and logical coherence is constructed to guide multi-agent collaborative optimization:
$$- y \cdot K L ( P ( V _ { k } ) || P _ { ref } ( V ) ) ( S )$$
Where λ = 0 . 6 is the factual consistency weight, ( 1 -λ ) is the logical coherence weight; γ = 0 . 1 is the regularization coefficient, and KL (⋅ ‖ ⋅) is the KL divergence, used to constrain the difference between the opinion distribution P ( Vk ) and the reference distribution Pref ( V ) , avoiding excessive divergence of opinions; a larger R indicates better agent collaboration.
## D. Collaborative Training Strategy
Multi-agent collaborative training is achieved using Improved Proximal Policy Optimization (PPO) to avoid inference collapse and loop generation. The objective function is:
$$\frac { L _ { p p o } = E [ \min ( r _ { t } ( \theta ) A _ { e } , c l i p H ( P ( \theta ) ) ] } { ( 6 ) }$$
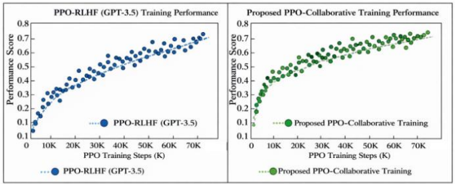
The use of PPO for collaborative optimization is motivated by its demonstrated effectiveness in cooperative multi-agent reinforcement learning settings [6]. In the formula, r t ( θ ) = π θ ( a t ∣ s t ) π θ old ( a t ∣ s t ) is the policy update ratio, πθ is the current policy, and πθold is the old policy; At is the advantage function, ϵ = 0 . 2 is the pruning coefficient; H ( P ( θ )) is the policy entropy, and β = 0 . 05 is the entropy regularization coefficient. Introducing the entropy term encourages policy exploration and avoids inference loops caused by local optima.Figure 2 compares the performance of traditional PPO-RLHF (GPT-3.5) and the proposed multi-agent PPO collaborative training over the same training steps. The x-axis shows PPO steps (in thousands), and the y-axis shows cumulative performance scores. While both start similarly, the proposed model shows more stable and significant gains beyond 50,000 steps, indicating convergence to a superior, stable policy. This highlights the effectiveness of the collaborative mechanism in reducing policy collapse and improving inference stability. Compared to earlier methods like MADDPG [7-8], PPO-based strategies provide better training stability in cooperative tasks, supporting our optimization design.
Figure 2: Performance Comparison of PPO Collaborative Training in Multi-Agent Tasks
<details>
<summary>Image 2 Details</summary>
### Visual Description
## Chart: Training Performance Comparison
### Overview
The image presents a comparative analysis of training performance for two different approaches: PPO-RLHF (GPT-3.5) and a proposed PPO-Collaborative Training method. Both are visualized as scatter plots showing Performance Score against PPO Training Steps (in thousands). The charts are presented side-by-side for direct comparison.
### Components/Axes
* **X-axis (Both Charts):** PPO Training Steps (K) - Scale ranges from 0K to 70K, with markers at 10K, 20K, 30K, 40K, 50K, 60K, and 70K.
* **Y-axis (Both Charts):** Performance Score - Scale ranges from 0.1 to 0.8, with markers at 0.1, 0.2, 0.3, 0.4, 0.5, 0.6, 0.7, and 0.8.
* **Left Chart:**
* Title: "PPO-RLHF (GPT-3.5) Training Performance"
* Data Series: PPO-RLHF (GPT-3.5) - Represented by blue circles.
* Legend: Located at the bottom-center, labeled "PPO-RLHF (GPT-3.5)" with a blue dotted line.
* **Right Chart:**
* Title: "Proposed PPO-Collaborative Training Performance"
* Data Series: Proposed PPO-Collaborative Training - Represented by green circles.
* Legend: Located at the bottom-center, labeled "Proposed PPO-Collaborative Training" with a green dotted line.
### Detailed Analysis
**Left Chart - PPO-RLHF (GPT-3.5):**
The blue data series shows an upward trend, starting at approximately 0.12 at 0K steps. The performance score increases rapidly up to around 30K steps, reaching approximately 0.5. From 30K to 70K steps, the rate of increase slows down, with the score plateauing around 0.72 at 70K steps.
* Approximate Data Points:
* 0K: 0.12
* 10K: 0.25
* 20K: 0.40
* 30K: 0.50
* 40K: 0.58
* 50K: 0.64
* 60K: 0.68
* 70K: 0.72
**Right Chart - Proposed PPO-Collaborative Training:**
The green data series also exhibits an upward trend, but appears to be consistently higher than the PPO-RLHF (GPT-3.5) performance. It starts at approximately 0.15 at 0K steps. The performance score increases rapidly up to around 30K steps, reaching approximately 0.55. From 30K to 70K steps, the rate of increase slows down, but remains higher than the blue series, reaching approximately 0.78 at 70K steps.
* Approximate Data Points:
* 0K: 0.15
* 10K: 0.28
* 20K: 0.45
* 30K: 0.55
* 40K: 0.65
* 50K: 0.70
* 60K: 0.75
* 70K: 0.78
### Key Observations
* The proposed PPO-Collaborative Training consistently outperforms the PPO-RLHF (GPT-3.5) method across all training steps.
* Both methods exhibit diminishing returns in performance gains as the number of training steps increases.
* The initial learning phase (0K to 30K steps) shows the most significant performance improvement for both methods.
### Interpretation
The data suggests that the proposed PPO-Collaborative Training approach is more effective than the standard PPO-RLHF (GPT-3.5) method for this particular task. The consistently higher performance scores indicate that the collaborative training strategy leads to better model learning and optimization. The diminishing returns observed at higher training steps suggest that further training beyond a certain point may not yield significant improvements. This could be due to the model reaching its capacity or the need for more sophisticated training techniques. The difference in performance is most pronounced in the initial stages of training, indicating that the collaborative approach is particularly beneficial for accelerating the learning process. The charts provide empirical evidence supporting the potential advantages of the proposed training method.
</details>
## E. Retrieval Enhancement Module
External knowledge is dynamically supplemented during the evidence verification stage. The retrieval probability model is as follows:
$$P ( e \vert V _ { k } ) = \frac { \sum _ { l = 1 } ^ { n } p ( S i m ( E m b ( e ) ) ; a ) } { \sum _ { l = 1 } ^ { n } p ( S i m ( C ) ; E m b ( V _ { k } ) ; a ) }$$
Where Sim (⋅,⋅) is the cosine similarity, and α = 1 . 5 is the temperature coefficient used to adjust the confidence level of the retrieval; the matching probability of each knowledge e and opinion Vk is obtained by normalization using the Softmax function, and the top M = 5 knowledge items with the highest probabilities are selected as evidence to strengthen the factual support of the opinion. This modular integration strategy is conceptually related to neuro-symbolic systems that combine language models with external tools and knowledge sources [910].
## III. EXPERIMENTAL DESIGN AND RESULT ANALYSIS
## A. Experimental Datasets
The experiment uses three complex reasoning datasets to ensure result generality: ① HotpotQA: A multi-hop QA benchmark with 113K training and 74K validation samples, requiring reasoning across 2 -5 documents. About 60% are "bridging" questions, stressing cross-document logic. ② WikiMultihopQA: Based on Wikipedia, with 25K training samples and 3.2 average reasoning steps per question. It focuses on entity-based long-chain reasoning. ③ MeetingBank: A group dialogue dataset with 5K+ real meeting samples, requiring integration of multi-round discussions to derive consistent conclusions.
The three datasets correspond to "document-level multihop," "entity-level multi-hop," and "dialogue-level integration" scenarios, respectively, comprehensively validating the model's performance across various complex inference tasks.
## B. Baseline Model and Evaluation Metrics
The baseline model selects mainstream complex inference methods to ensure fairness in the comparison: ① Single LLM model: GPT-3.5, Llama 2-7B (fine-tuned); ② Multi-proxy model: AutoGPT, MetaGPT; ③ Search enhancement model: RAG (Search Enhancement Generation), REALM.GPT-3.5 is selected as a baseline model due to its strong instructionfollowing ability, trained using reinforcement learning from human feedback .
Evaluation metrics focus on core performance and stability: ① Multi-hop reasoning accuracy (Acc): The precise match between the reasoning conclusion and the standard answer, measuring the correctness of the reasoning; ② Consistency index (Cons): The logical consistency rate of the conclusion in multiple rounds of reasoning, calculated by the overlap of the results of 5 consecutive reasoning iterations, measuring stability; ③ Reasoning efficiency (Time): The average time (in seconds) for reasoning per sample, measuring practicality.
## C. Experimental Procedure and Parameter Settings
The experiment includes three steps: ① Data preprocessing: Standardize formats and extract questions, context, and answers. ② GPT-3.5 baseline uses sequential prompting without state sharing: Step 2 inputs the raw question for an initial reasoning chain; Step 3 reuses the output as context for extended reasoning; Step 4 merges prior chains for a final answer. No memory compression or pruning is used, causing performance drops in long chains due to token overflow and diluted context -underscoring the need for collaborative memory and role division. ③ Performance testing: Run each model 10 times on the test set and average the results.
Key parameter configurations are as follows: Number of opinion generation agents K = 3 , Number of evidence retrievals M = 5 , Fact matching threshold τ = 0 . 75 , Reward function weight λ = 0 . 6 , PPO pruning coefficient ϵ = 0 . 2 , Entropy regularization coefficient β = 0 . 05 .
## D. Experimental Results and Analysis
## 1) Performance of the Main Experiment
Table 1 shows the comprehensive performance comparison of each model on the binary dataset. The model presented in this paper significantly outperforms the baseline in all core metrics. Table 1 shows that the proposed model improves accuracy by 16.8%, 14.3%, and 19.2% on HotpotQA, 2WikiMultihopQA, and MeetingBank, respectively, and improves consistency by 21.5%. Although the inference time is slightly higher than that of a single LLM, it is significantly lower than other multi-agent models, achieving a balance between accuracy, stability, and efficiency.
TABLE I. COMPARISON OF OVERALL PERFORMANCE OF VARIOUS MODELS ON BINARY DATASETS
| Model | HotpotQA(Acc/%) | 2WikiMultihopQA(Acc/%) | MeetingBank(Acc/%) | Cons/% | Time/s |
|-----------------------------------|-------------------|--------------------------|----------------------|----------|----------|
| GPT-3.5 | 62.3 | 58.7 | 51.2 | 65.8 | 2.1 |
| Llama 2-7B | 59.1 | 55.3 | 48.6 | 63.2 | 1.8 |
| AutoGPT | 68.5 | 63.2 | 57.9 | 70.2 | 4.3 |
| MetaGPT | 70.2 | 65.1 | 59.4 | 72.5 | 4.7 |
| RAG | 71.1 | 66.5 | 60.3 | 72.4 | 3.5 |
| REALM | 72.4 | 67.8 | 61.7 | 73.8 | 3.8 |
| This article's model | 79.1 | 73 | 70.4 | 87.3 | 3.9 |
| Relative improvement (vs GPT-3.5) | 16.8 | 14.3 | 19.2 | 21.5 | 1.8 |
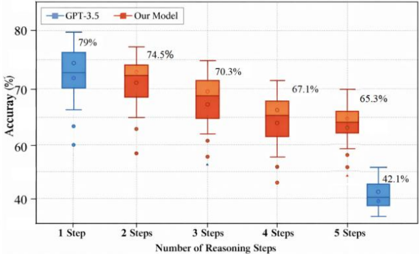
Figure 3 compares Acc between the proposed model and GPT-3.5 across reasoning steps (on 2WikiMultihopQA). The x- axis shows steps (1 -5), and the y-axis shows Acc (%). The box plot reveals GPT-3.5 accuracy drops sharply to 42.1% at 5 steps,
while the proposed model maintains 65.3%, demonstrating strong resistance to long-chain degradation via multi-agent architecture.
Figure 3. Comparison of Model Accuracy under Different Inference Steps.
<details>
<summary>Image 3 Details</summary>
### Visual Description
\n
## Box Plot: Accuracy vs. Reasoning Steps
### Overview
The image presents a comparative box plot illustrating the accuracy of two models, "GPT-3.5" and "Our Model," across varying numbers of reasoning steps (1 to 5). The y-axis represents accuracy in percentage (%), while the x-axis indicates the number of reasoning steps. Each model's performance is visualized using box plots, showing the distribution of accuracy scores for each step count.
### Components/Axes
* **X-axis:** "Number of Reasoning Steps" with markers at 1, 2, 3, 4, and 5.
* **Y-axis:** "Accuracy (%)" with a scale ranging from approximately 40% to 80%.
* **Legend:** Located at the top-center of the chart.
* "GPT-3.5" - Represented by a light blue color.
* "Our Model" - Represented by a reddish-orange color.
* **Data Series:** Two box plots, one for each model, displayed for each reasoning step.
* **Error Bars:** Vertical lines extending from the box plots, indicating the variability or confidence interval of the data.
* **Outliers:** Individual data points plotted as dots outside the error bars.
### Detailed Analysis
**GPT-3.5 (Light Blue)**
* **1 Step:** The box plot is centered around approximately 79%. The box extends from roughly 68% to 85%. Several outliers are present, ranging from approximately 58% to 62%.
* **2 Steps:** The box plot is centered around approximately 42%. The box extends from roughly 35% to 50%. Several outliers are present, ranging from approximately 30% to 35%.
* **3 Steps:** No data is present.
* **4 Steps:** No data is present.
* **5 Steps:** No data is present.
**Our Model (Reddish-Orange)**
* **1 Step:** The box plot is centered around approximately 74.5%. The box extends from roughly 65% to 80%. Several outliers are present, ranging from approximately 58% to 60%.
* **2 Steps:** The box plot is centered around approximately 70.3%. The box extends from roughly 60% to 78%. Several outliers are present, ranging from approximately 55% to 60%.
* **3 Steps:** The box plot is centered around approximately 67.6%. The box extends from roughly 60% to 75%. Several outliers are present, ranging from approximately 55% to 60%.
* **4 Steps:** The box plot is centered around approximately 65.3%. The box extends from roughly 55% to 70%. Several outliers are present, ranging from approximately 50% to 60%.
* **5 Steps:** The box plot is centered around approximately 65.3%. The box extends from roughly 55% to 70%. Several outliers are present, ranging from approximately 50% to 60%.
### Key Observations
* For GPT-3.5, accuracy decreases significantly as the number of reasoning steps increases from 1 to 2. No data is present for steps 3, 4, and 5.
* "Our Model" exhibits a gradual decrease in accuracy as the number of reasoning steps increases from 1 to 5, but the decrease is less dramatic than that observed for GPT-3.5.
* Both models show a wide range of accuracy scores (as indicated by the box plot spread and error bars), suggesting variability in performance.
* Outliers are present for both models at each step, indicating some instances of significantly higher or lower accuracy.
### Interpretation
The data suggests that GPT-3.5 performs well with a single reasoning step but suffers a substantial accuracy drop when required to perform two steps of reasoning. The absence of data for steps 3, 4, and 5 for GPT-3.5 could indicate a complete failure or inability to perform beyond two reasoning steps.
"Our Model," on the other hand, maintains a more consistent level of accuracy across all five reasoning steps, albeit with a gradual decline. This suggests that "Our Model" is more robust and capable of handling complex reasoning tasks compared to GPT-3.5.
The presence of outliers in both models indicates that performance can vary significantly depending on the specific input or task. The box plot spread and error bars highlight the uncertainty associated with the accuracy estimates.
The comparison between the two models suggests that the architecture or training of "Our Model" may be better suited for multi-step reasoning tasks than that of GPT-3.5. The data implies that GPT-3.5's strength lies in simple, single-step reasoning, while "Our Model" offers a more reliable performance across a wider range of reasoning complexities.
</details>
## 2) Validation of Model Structure Effectiveness
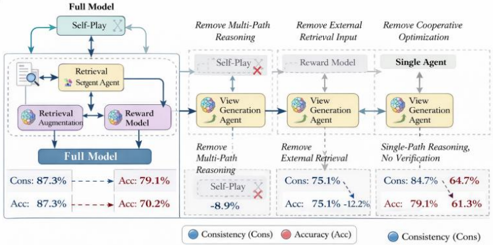
To assess module importance, ablation tests were conducted:
① no self-play; ② no retrieval enhancement; ③ no reward model; ④ single-agent (only opinion generation).Figure 4 shows changes in Cons (left y-axis, %) and Acc (right y-axis, %) across these settings. The x-axis shows the models: full / -selfplay / -retrieval / -reward / single-agent. The single-agent setup yields Cons 64.7% and Acc 61.3%. The full model improves Cons by 22.6% and Acc by 17.8%. Without retrieval, Cons drops 12.2%; without self-play, Acc drops 8.9%, confirming each module ' s necessity.
Figure 4. Comparison of Consistency and Accuracy.
<details>
<summary>Image 4 Details</summary>
### Visual Description
\n
## Diagram: Model Ablation Study
### Overview
The image presents a diagram illustrating an ablation study of a complex model, likely a reinforcement learning or game-playing agent. The diagram compares the performance of the "Full Model" against variations where specific components have been removed ("Remove Multi-Path Reasoning", "Remove External Retrieval Input", "Remove Cooperative Optimization"). Performance is measured by Consistency (Cons) and Accuracy (Acc).
### Components/Axes
The diagram is structured into four main sections, arranged horizontally:
1. **Full Model:** Depicts the complete model architecture.
2. **Remove Multi-Path Reasoning:** Shows the model with the multi-path reasoning component removed.
3. **Remove External Retrieval Input:** Shows the model with the external retrieval input component removed.
4. **Remove Cooperative Optimization:** Shows the model with the cooperative optimization component removed.
Each section includes a visual representation of the model architecture and performance metrics. The diagram also includes the following elements:
* **Components:** Retrieval Agent, Retrieval Augmentation, Reward Model, View Generation Agent, Self-Play.
* **Metrics:** Consistency (Cons), Accuracy (Acc).
* **Legend:**
* Blue: Consistency (Cons)
* Red: Accuracy (Acc)
* **Arrows:** Indicate the direction of information flow and the impact of component removal on performance.
* **Percentage Changes:** Displayed below each ablation, indicating the performance drop compared to the Full Model.
### Detailed Analysis or Content Details
**Full Model:**
* Consistency (Cons): 87.3% (Blue)
* Accuracy (Acc): 79.1% (Red)
* Consistency (Acc): 87.3% (Red)
* Accuracy (Acc): 70.2% (Red)
**Remove Multi-Path Reasoning:**
* Self-Play is marked with a red "X", indicating its removal.
* Consistency (Cons): 78.4% (Blue) - a drop of -8.9% compared to the Full Model.
* Accuracy (Acc): 75.1% (Red) - a drop of -12.2% compared to the Full Model.
**Remove External Retrieval Input:**
* Consistency (Cons): 75.1% (Blue)
* Accuracy (Acc): 75.1% (Red)
**Remove Cooperative Optimization:**
* The model is simplified to a "Single Agent".
* Consistency (Cons): 84.7% (Blue)
* Accuracy (Acc): 64.7% (Red)
### Key Observations
* Removing "Multi-Path Reasoning" has the most significant negative impact on Accuracy (-12.2%).
* Removing "Multi-Path Reasoning" also significantly impacts Consistency (-8.9%).
* Removing "External Retrieval Input" results in a moderate decrease in both Consistency and Accuracy.
* Removing "Cooperative Optimization" leads to a slight increase in Consistency but a substantial decrease in Accuracy.
* The "Full Model" exhibits the highest Consistency and a relatively high Accuracy.
### Interpretation
This diagram demonstrates the importance of each component within the "Full Model". The ablation study reveals that "Multi-Path Reasoning" is crucial for maintaining high Accuracy, while "Cooperative Optimization" appears to contribute more to Consistency than Accuracy. The removal of "External Retrieval Input" has a moderate impact on both metrics, suggesting it plays a supporting role.
The diagram suggests a trade-off between Consistency and Accuracy. Removing "Cooperative Optimization" increases Consistency but significantly reduces Accuracy, indicating that this component is essential for achieving high performance on the accuracy metric. The "Full Model" represents a balance between these two metrics, leveraging all components to achieve optimal results.
The use of arrows and percentage changes effectively communicates the impact of each ablation on performance, allowing for a clear understanding of the relative importance of each component. The diagram is a valuable tool for understanding the model's architecture and identifying areas for potential improvement. The diagram is a visual representation of a quantitative experiment, and the data suggests that the full model is the most effective configuration.
</details>
Further analysis shows that the retrieval enhancement module reduces factual errors by supplementing external facts, improving consistency. The self-game mechanism promotes multi-path reasoning, reducing logical blind spots and enhancing accuracy. The reward model, via multi-objective collaborative optimization, avoids goal conflicts and maintains performance balance. In contrast, single-agent models lack division of labor and coordination, fail to meet multidimensional reasoning needs, and struggle with factual verification, resulting in performance drops. This comparison highlights the superiority of the multi-agent role-based architecture, which addresses fact verification, logical integrity, and goal consistency through modular collaboration. Single agents, limited in cognitive scope, cannot balance factual accuracy and logical rigor or verify via multiple perspectives -explaining their core limitations. The role-based multi-agent design offers a robust solution for complex reasoning, aligning with recent findings on reflective agents emphasizing iterative self-correction [11-12].
## IV. CONCLUSION
The proposed group deliberation multi-agent dialogue model, through a three-level role-based architecture, self-game mechanism, retrieval enhancement module, and collaborative training strategy, effectively solves the problems of logical collapse, cyclic generation, and insufficient factuality in complex reasoning of single models. Experimental verification shows that the model's reasoning accuracy and consistency indicators on three typical datasets are significantly better than the baseline, and its reasoning efficiency is balanced, providing reliable support for scenarios such as multi-hop question answering and group decision-making. In addition to the promising performance, several limitations should be noted. First, the reported improvements are obtained under controlled experimental settings with fixed model configurations and dataset splits, and may not fully generalize to other task distributions or prompt formulations. Moreover, due to computational constraints, key hyperparameters were selected based on preliminary validation rather than exhaustive search. Furthermore, while repeated experiments reduce variance, formal statistical significance testing and detailed qualitative error analysis were not conducted. Future work will focus on automated hyperparameter optimization, rigorous significance evaluation, and systematic analysis of failure cases, particularly in scenarios involving ambiguous or conflicting evidence.
## REFERENCES
## [1] Du, Y., Li, S., Torralba, A., Tenenbaum, J. B., & Mordatch, I.
Improving Factuality and Reasoning in Language Models through Multi-Agent Debate. International Conference on Learning Representations (ICLR), 2024.
- [2] Song T, Tan Y, Zhu Z, et al. Multi-agents are social groups: Investigating social influence of multiple agents in human-agent interactions[J]. Proceedings of the ACM on Human-Computer Interaction, 2025, 9(7): 1-33.
- [3] Li, G., Hammoud, H., Itani, H., Khizbullin, D., & Ghanem, B.
3. CAMEL: Communicative Agents for 'Mind' Exploration of Large Language Models. Advances in Neural Information Processing Systems (NeurIPS), 2023.
- [4] Wang, X., Wei, J., Schuurmans, D., et al. Self-Consistency Improves Chain of Thought Reasoning in Language Models. International Conference on Learning Representations (ICLR), 2023.
- [5] Lewis, P., Perez, E., Piktus, A., et al. Retrieval-Augmented Generation for Knowledge-Intensive NLP Tasks. Advances in Neural Information Processing Systems (NeurIPS), 2020.
- [6] Yu, C., Velu, A., Vinitsky, E., Gao, J., Wang, Y., Bayen, A., & Wu, Y. The Surprising Effectiveness of PPO in Cooperative Multi-Agent Games.
7. Advances in Neural Information Processing Systems (NeurIPS), 2022. [7] Lowe, R., Wu, Y., Tamar, A., Harb, J., Abbeel, O. P., & Mordatch, I. Multi-Agent Actor-Critic for Mixed Cooperative-Competitive Environments. Advances in Neural Information Processing Systems (NeurIPS), 2017.
- [8] Ouyang, L., Wu, J., Jiang, X., et al. Training Language Models to Follow Instructions with Human Feedback. Advances in Neural Information Processing Systems (NeurIPS), 2022.
[9] Zhang, Z., Liu, Z., Zhou, M., et al. Multi-Agent Reinforcement Learning: A Selective Overview of Theories and Algorithms. Artificial Intelligence, vol. 285, 2020.
[10]Sun Y, Liu X. Research and Application of a Multi-Agent-Based Intelligent Mine Gas State Decision-Making System[J]. Applied Sciences, 2025, 15(2): 968.
- [11] Shinn, N., et al. Reflexion: Language Agents with Verbal Reinforcement Learning. NeurIPS Workshop, 2023.
- [12] Yao, S., et al. Tree of Thoughts: Deliberate Problem Solving with Large Language Models. Advances in Neural Information Processing Systems (NeurIPS), 2023.