# LsrIF: Logic-Structured Reinforcement Learning for Instruction Following
> Corresponding author.
Abstract
Instruction-following is critical for large language models, but real-world instructions often contain logical structures such as sequential dependencies and conditional branching. Existing methods typically construct datasets with parallel constraints and optimize average rewards, ignoring logical dependencies and yielding noisy signals. We propose a logic-structured training framework LsrIF that explicitly models instruction logic. We first construct a dataset LsrInstruct with constraint structures such as parallel, sequential, and conditional types, and then design structure-aware rewarding method LsRM including average aggregation for parallel structures, failure-penalty propagation for sequential structures, and selective rewards for conditional branches. Experiments show LsrIF brings significant improvements in instruction-following (in-domain and out-of-domain) and general reasoning. Analysis reveals that learning with explicit logic structures brings parameter updates in attention layers and sharpens token-level attention to constraints and logical operators.
LsrIF: Logic-Structured Reinforcement Learning for Instruction Following
Qingyu Ren 1, Qianyu He 1, Jingwen Chang 1, Jie Zeng 1, Jiaqing Liang 2 thanks: Corresponding author., Yanghua Xiao 1 footnotemark: Han Xia 3, Zeye Sun 3, Fei Yu 3 1 Shanghai Key Laboratory of Data Science, College of Computer Science and Artificial Intelligence, Fudan University, 2 School of Data Science, Fudan University, 3 Ant Group {qyren24,qyhe21,jwchang24, jzeng23}@m.fudan.edu.cn, {liangjiaqing, shawyh}@fudan.edu.cn
1 Introduction
<details>
<summary>x1.png Details</summary>

### Visual Description
\n
## Diagram: Complex Instruction Decomposition
### Overview
This diagram visually represents the decomposition of a "Complex Instruction" into its constituent parts: "Constraint" and "Logic". It illustrates a process for generating a short instructional paragraph, followed by a checklist, with conditional formatting based on the presence of the word "error" in the output. The diagram uses a flowchart-like structure with color-coding to differentiate components and flow.
### Components/Axes
The diagram consists of three main sections: a header containing the core equation, a central section illustrating the flow between "Constraint" and "Logic", and two lower boxes detailing the specifics of each component.
* **Header:** "Complex Instruction = Constraint + Logic"
* **Central Flow:**
* Arrow pointing from "Constraint" (blue) to a rounded rectangle containing text.
* Arrow pointing from "Logic" (yellow) to the same rounded rectangle.
* **Constraint Box:**
* Title: "Constraint"
* List:
1. "a short instructional"
2. "length does not exceed three sentences"
3. "......"
* **Logic Box:**
* Title: "Logic"
* List:
1. "First, then, finally"
2. "And"
3. "If, else"
4. "......"
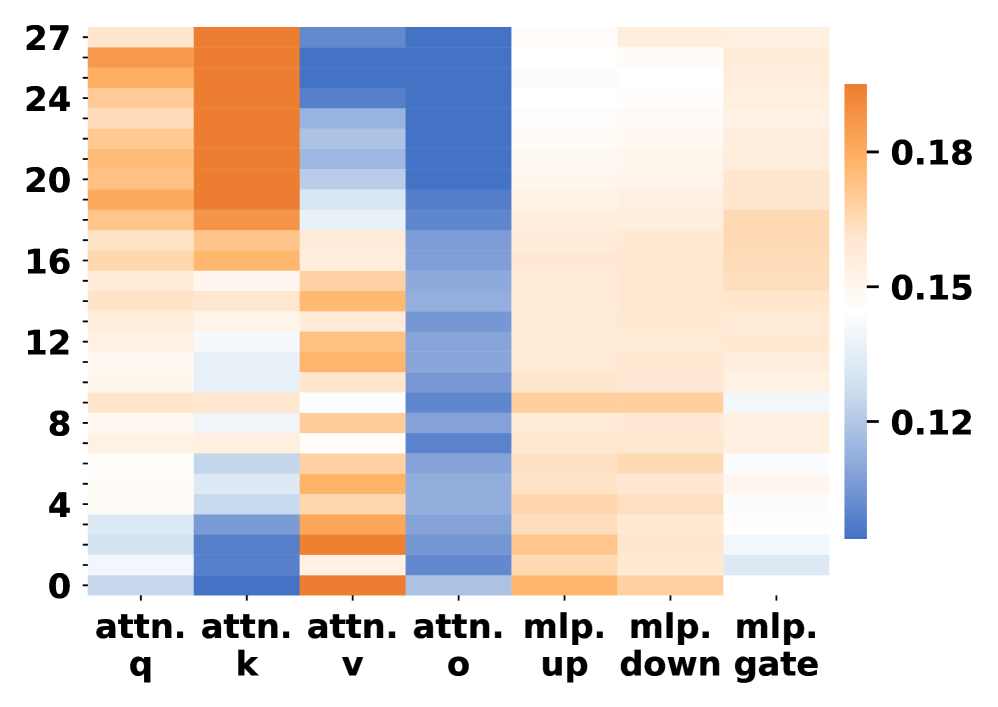
* **Instructional Paragraph Text (in rounded rectangle):** "First, generate a short instructional paragraph and ensure the total length does not exceed three sentences; then, append a clearly separated checklist section using bullet points; if the word “error” appears anywhere in the output, all checklist items must be written in lowercase English, else the instructional paragraph must begin with a bolded core idea; finally, apply a formal, technical writing style to the entire output."
### Detailed Analysis or Content Details
The diagram outlines a procedural process. The "Constraint" box defines limitations on the output (paragraph length, checklist format). The "Logic" box specifies the sequence of actions (first, then, finally) and a conditional statement (if/else). The central rounded rectangle contains the complete instruction, which combines the constraints and logic.
The instructional paragraph itself is approximately 50 words long. It details the steps to be taken, including length constraints, checklist appending, conditional formatting, and writing style.
### Key Observations
The diagram emphasizes a structured approach to instruction generation. The use of color-coding (blue for constraints, yellow for logic) aids in visual understanding. The "......" in both the Constraint and Logic boxes suggests that the lists are not exhaustive. The conditional formatting rule based on the presence of "error" indicates a quality control mechanism.
### Interpretation
The diagram illustrates a system for generating instructions that are both concise and well-formatted. The separation of "Constraint" and "Logic" suggests a modular design, where the constraints can be modified without affecting the underlying logic, and vice versa. The conditional formatting rule highlights the importance of error handling and provides a mechanism for adjusting the output based on the presence of errors. The overall design promotes clarity, consistency, and quality in instruction generation. The diagram is a meta-instruction, describing how to create instructions. It's a self-referential system.
</details>
Figure 1: Essentially, the complex instruction is the logical composition of constraints.
<details>
<summary>x2.png Details</summary>
### Visual Description
\n
## Diagram: Logic-Structured Dataset Construction & Structure-Aware Reward Modeling
### Overview
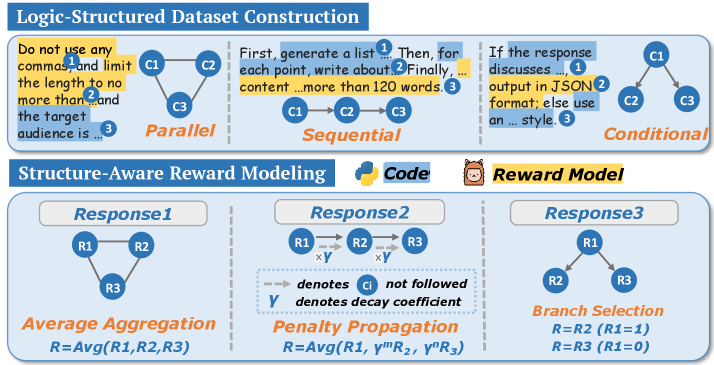
The image presents a diagram illustrating two key components of a system: Logic-Structured Dataset Construction and Structure-Aware Reward Modeling. The top section details different approaches to dataset construction (Parallel, Sequential, Conditional), while the bottom section outlines three reward modeling strategies (Average Aggregation, Penalty Propagation, Branch Selection). The diagram uses tree-like structures and arrows to represent relationships and flows within each component.
### Components/Axes
The diagram is divided into two main sections: "Logic-Structured Dataset Construction" (top) and "Structure-Aware Reward Modeling" (bottom). Each section contains three sub-diagrams representing different approaches. Each sub-diagram features nodes (C1, C2, C3 or R1, R2, R3) connected by lines or arrows. There are also text labels describing each approach and associated formulas. Icons for "Code" and a "Reward Model" (represented by a bear) are present. Numbered circles (1, 2, 3) are used to indicate steps or points within the descriptions.
### Detailed Analysis or Content Details
**Logic-Structured Dataset Construction:**
* **Parallel:** A diagram with three nodes labeled C1, C2, and C3. All nodes are connected to a central, unlabelled node. The text reads: "Do not use any commas, and limit the length to no more than… and the target audience is…". Numbered points: 1. "First, generate a list", 2. "Then, for each point, write about…", 3. "Finally, content…more than 120 words."
* **Sequential:** A diagram with three nodes labeled C1, C2, and C3. Nodes are connected sequentially: C1 -> C2 -> C3. The text reads: "If the response discusses… output in JSON format; else use an… style." Numbered points: 1. "First, generate a list", 2. "Then, for each point, write about…", 3. "Finally, content…more than 120 words."
* **Conditional:** A diagram with three nodes labeled C1, C2, and C3. The connections are branching, resembling a decision tree. The text reads: "If the response discusses… output in JSON format; else use an… style." Numbered points: 1. "First, generate a list", 2. "Then, for each point, write about…", 3. "Finally, content…more than 120 words."
**Structure-Aware Reward Modeling:**
* **Average Aggregation:** A tree structure with nodes R1, R2, and R3. R1 connects to R2 and R3. The formula is: "R = Avg(R1, R2, R3)".
* **Penalty Propagation:** A tree structure with nodes R1, R2, and R3. R1 connects to R2 with a solid arrow, and R2 connects to R3 with a dashed arrow. R1 also connects directly to R3 with a dashed arrow. The text includes: "denotes ⊣ not followed" and "γ denotes decay coefficient". The formula is: "R = Avg(R1, γ^R2, γ^R3)".
* **Branch Selection:** A tree structure with nodes R1, R2, and R3. R1 connects to R2 and R3. The text reads: "R = R2 (R1=1) R = R3 (R1=0)".
### Key Observations
* The "Logic-Structured Dataset Construction" section focuses on different ways to organize the creation of a dataset, emphasizing constraints on length and style.
* The "Structure-Aware Reward Modeling" section explores different methods for calculating a reward based on the structure of a response.
* The Penalty Propagation method introduces the concept of a "decay coefficient" (γ), suggesting that rewards diminish as the response deviates from a preferred structure.
* The Branch Selection method uses a binary decision (R1=1 or R1=0) to determine which branch (R2 or R3) receives the reward.
* The numbered points (1, 2, 3) are consistent across the dataset construction methods, suggesting a common workflow.
### Interpretation
This diagram illustrates a system designed to generate and evaluate responses based on a predefined logical structure. The dataset construction methods aim to create data that adheres to specific constraints, while the reward modeling strategies incentivize responses that conform to the desired structure. The use of tree structures and formulas suggests a formal, mathematical approach to both dataset creation and reward calculation. The inclusion of a decay coefficient in the Penalty Propagation method indicates a nuanced approach to reward assignment, where deviations from the ideal structure are penalized. The overall system appears to be geared towards generating structured, concise, and targeted responses, potentially for applications like question answering or dialogue systems. The icons for "Code" and "Reward Model" suggest that this is a system implemented in software, with a clear separation between the code that generates responses and the model that evaluates them. The bear icon for the reward model is likely a playful visual element.
</details>
Figure 2: Our framework LsrIF consists of two components: (LsrInstruct) logic-structured dataset construction, and (LsRM) structure-aware reward modeling with corresponding methods.
Instruction following is a core capability of large language models (LLMs) and is essential for their use in real-world applications Zhang et al. (2025); Lu et al. (2025); Ye et al. (2025). User instructions are often complex and may span multiple turns or agent-based interactions Qi et al. (2025); Deshpande et al. (2025). Beyond producing fluent text, effective instruction following requires models to correctly understand and satisfy multiple constraints, which are often expressed through structured and interdependent conditions He et al. (2024); An et al. (2025).
In essence, complex instructions are composed of multiple constraints connected by logical structures. Correct instruction following therefore requires not only satisfying individual constraints, but also adhering to the logical relationships between them. As shown in Fig. 1, the complex instruction contains three common types of logical relationships. Parallel (And) structures require all constraints to be satisfied simultaneously. Sequential (First–Then–Finally) structures impose an execution order, where later constraints depend on the successful completion of earlier ones. Conditional (If–Else) structures introduce branching logic, where the model must first evaluate a condition and then follow the correct branch.
Existing approaches for improving instruction following still face clear limitations when dealing with logically structured instructions. From the perspective of data construction, most training data simplify instructions by treating all constraints as parallel Sun et al. (2024); Huang et al. (2025). Although some datasets include logical structure, they are mainly used for evaluation rather than training Wen et al. (2024); Wang et al. (2025). In terms of reward modeling, the reward for the entire instruction is often computed as the average of the rewards for individual constraints Qin et al. (2025). This assumes that constraints are independent. However, for sequential or conditional instructions, failure at an early step makes later constraints irrelevant, and simple averaging can produce incorrect training signals. Finally, regarding interpretability for performance improvements, prior work typically shows gains in instruction-following performance and the preservation of general reasoning abilities Peng et al. (2025), yet the underlying reasons remain unexplored. Furthermore, it remains unclear whether gains in logically structured instruction following actually transfer to reasoning ability.
To address these limitations, we propose a logic-structured training framework LsrIF that explicitly models instruction logic in both data construction and reward design. (1) Logic-Structured Data (LsrInstruct). We define instruction structures using three basic logical forms: parallel, sequential, and conditional. Based on these forms, we construct a dataset of multi-constraint instructions covering multiple logical structures. (2) Logic-Structured Reward Modeling (LsRM). We design reward modeling methods that reflect the execution semantics of different structures. For parallel structures, rewards are aggregated by averaging. For sequential structures, we apply a decay mechanism so that failures in earlier steps reduce rewards for later ones. For conditional structures, rewards are assigned only to the constraints in the correct branch. (3) Interpretability for Performance Improvements. We further analyze how logic-structured training affects the model. We observe larger parameter updates in attention layers than in MLP layers. At the token level, trained models place more attention on logical connectors and constraint-related tokens. These changes also appear in general reasoning tasks, indicating that the learned ability transfers beyond instruction following.
Our contributions are summarized as follows: (1) We propose LsrIF, a logic-structured training framework. (2) LsrIF includes LsrInstruct, an instruction dataset capturing parallel, sequential, and conditional constraint logic structures, and LsRM, structure-aware reward modeling that aligns reward signals with logical execution semantics. (3) LsrIF improves both in-domain and out-of-domain instruction-following performance and general reasoning ability, with attention and token-level interpretability analysis.
2 Related Work
2.1 Instruction Following Data Construction
Existing work constructs datasets with multi-constraint instructions to improve instruction-following capabilities Qin et al. (2025); Cheng et al. (2024). However, these approaches directly concatenate constraints, ignoring potential structures among them, which fails to simulate real-world user instructions. While some datasets consider logical structures Wen et al. (2024); Wang et al. (2025), they are primarily designed for evaluation rather than training. In contrast, we construct a training dataset where constraints show explicit logical structures.
2.2 Reward Modeling for Instruction Following
Training paradigms for instruction following have evolved from supervised fine-tuning Sun et al. (2024) to Direct Preference Optimization Huang et al. (2025); Qi et al. (2024) and Reinforcement Learning with Verifiable Rewards (RLVR) Peng et al. (2025); Qin et al. (2025). Existing RLVR methods aggregate constraint-level rewards through simple averaging. However, this averaging strategy fails when constraint logical structures are not parallel (e.g., sequential or conditional). We propose structure-aware reward modeling, where different structures employ distinct reward modeling methods.
3 Method
Our approach consists of two main components: logic-structured dataset construction (LsrInstruct) and structure-aware reward modeling (LsRM). As illustrated in Fig. 2, we organize instructions into three logical structures—Parallel, Sequential, and Conditional and employ a structure-aware reward model with three corresponding methods: Average Aggregation for parallel structures, Penalty Propagation for sequential structures, and Branch Selection for conditional structures.
3.1 Logic-Structured Dataset Construction
To move beyond flat constraint concatenation, we formalize three logic structure types:
- Parallel Structure. A set of constraints $C=\{c_{1},c_{2},...,c_{n}\}$ that must all be satisfied simultaneously. This structure corresponds to the flat assumption commonly adopted in prior work, where constraints are treated as independent(e.g., “Respond in English and use no commas and limit the length to 100 words”).
- Sequential Structure. An ordered sequence of constraints $S=(c_{1},c_{2},...,c_{n})$ , where each constraint $c_{t}$ is meaningful only if all preceding constraints $(c_{1},...,c_{t-1})$ are successfully satisfied (e.g., “ First generate an outline, then write a summary, finally translate it into English”).
- Conditional Structure. A branching structure governed by a trigger constraint $c_{p}$ . The active execution branch is determined by whether $c_{p}$ is satisfied: if $c_{p}$ holds, the model must satisfy the true-branch constraint $c_{\text{true}}$ ; else, it must satisfy the false-branch constraint $c_{\text{false}}$ (e.g., “ If the input text contains code, explain its functionality; else, summarize the text”).
We construct the dataset by collecting seed instructions from Infinity-Instruct Li et al. (2025), Open Assistant Köpf et al. (2024), Self-Instruct Wang et al. (2022a) and Super-Natural Wang et al. (2022b), defining constraint types (hard constraints in Tab. 5, soft constraints in Tab. 6), and using GPT-4.1 to generate multi-constraint instructions that instantiate these logical structures. Each instruction follows logical structure with multiple constraints organized accordingly, enabling controlled analysis and structure-aware training. Detailed statistics of LsrInstruct are shown in Tab. 1.
| Logic Type | # Inst. | # Cons. Types | # Cons. | Evaluation |
| --- | --- | --- | --- | --- |
| Parallel | 17510 | 48 | 52106 |
<details>
<summary>figures/python.png Details</summary>

### Visual Description
\n
## Icon: Python Programming Language Logo
### Overview
The image depicts the official logo for the Python programming language. It is a stylized representation of two intertwined snakes, one blue and one yellow, forming a circular shape. The logo is set against a white background. This image does not contain any factual data or numerical values. It is a symbolic representation.
### Components/Axes
There are no axes or numerical components in this image. The key components are:
* **Blue Snake:** A darker shade of blue, forming the upper portion of the intertwined shape.
* **Yellow Snake:** A golden-yellow color, forming the lower portion of the intertwined shape.
* **White Background:** The surrounding space.
### Detailed Analysis or Content Details
The logo consists of two snake-like forms. The blue snake appears to be slightly darker and more prominent, while the yellow snake is a lighter shade. The snakes are intertwined in a way that creates a sense of continuous flow and cyclical movement. The shapes are smooth and rounded, giving the logo a friendly and approachable appearance. There is a small white highlight on the lower-right portion of the yellow snake.
### Key Observations
The logo is visually balanced, with the two snakes complementing each other. The color contrast between the blue and yellow is striking and helps to make the logo easily recognizable. The overall design is simple yet effective, conveying a sense of dynamism and sophistication.
### Interpretation
The Python logo is a visual metaphor for the language itself. The snakes represent the language's flexibility and adaptability, as well as its ability to "wrap around" different problems and solutions. The intertwining of the snakes symbolizes the integration of different programming paradigms and the language's versatility. The colors blue and yellow are often associated with creativity, intelligence, and energy, reflecting the language's strengths and potential. The logo is a powerful symbol of the Python community and its commitment to innovation and collaboration. The logo is a brand identifier, and does not contain any data or information beyond its symbolic meaning.
</details>
<details>
<summary>figures/gpt2.jpg Details</summary>

### Visual Description
\n
## Icon: Abstract Interlocking Design
### Overview
The image presents a stylized icon featuring an abstract, interlocking design composed of white lines against a solid purple background. The design appears to be a complex arrangement of curved and straight lines forming a central, roughly hexagonal shape. There is no numerical data or axes present.
### Components/Axes
There are no axes, scales, or legends in this image. The image consists solely of the icon itself and the background color.
### Detailed Analysis or Content Details
The icon is constructed from multiple white lines of approximately equal width. These lines intersect and overlap, creating a sense of depth and complexity. The lines are not uniform in curvature; some are sharply bent, while others are more gently curved. The overall shape is vaguely reminiscent of a flower or a stylized knot. The purple background is a consistent, flat color.
### Key Observations
The design is symmetrical around a central point, though the symmetry is not perfect. The interlocking nature of the lines suggests connection, integration, or complexity. The color contrast between the white lines and the purple background is high, making the icon visually prominent.
### Interpretation
This image is a logo or icon representing a concept related to interconnectedness, complexity, or a network. The hexagonal shape at the core could symbolize stability or structure. The purple color often represents creativity, wisdom, or spirituality. Without further context, it's difficult to determine the specific meaning, but the design suggests a modern, tech-focused brand or organization. The lack of data points or quantifiable information indicates this is a purely visual representation, intended to evoke a feeling or association rather than convey specific data. It is likely a branding element.
</details>
|
| Sequential | 10435 | 25 | 31295 |
<details>
<summary>figures/gpt2.jpg Details</summary>

### Visual Description
\n
## Icon: Abstract Interlocking Design
### Overview
The image presents a stylized icon featuring an abstract, interlocking design composed of white lines against a solid purple background. The design appears to be a complex arrangement of curved and straight lines forming a central, roughly hexagonal shape. There is no numerical data or axes present.
### Components/Axes
There are no axes, scales, or legends in this image. The image consists solely of the icon itself and the background color.
### Detailed Analysis or Content Details
The icon is constructed from multiple white lines of approximately equal width. These lines intersect and overlap, creating a sense of depth and complexity. The lines are not uniform in curvature; some are sharply bent, while others are more gently curved. The overall shape is vaguely reminiscent of a flower or a stylized knot. The purple background is a consistent, flat color.
### Key Observations
The design is symmetrical around a central point, though the symmetry is not perfect. The interlocking nature of the lines suggests connection, integration, or complexity. The color contrast between the white lines and the purple background is high, making the icon visually prominent.
### Interpretation
This image is a logo or icon representing a concept related to interconnectedness, complexity, or a network. The hexagonal shape at the core could symbolize stability or structure. The purple color often represents creativity, wisdom, or spirituality. Without further context, it's difficult to determine the specific meaning, but the design suggests a modern, tech-focused brand or organization. The lack of data points or quantifiable information indicates this is a purely visual representation, intended to evoke a feeling or association rather than convey specific data. It is likely a branding element.
</details>
|
| Conditional | 10574 | 25 | 42152 |
<details>
<summary>figures/gpt2.jpg Details</summary>

### Visual Description
\n
## Icon: Abstract Interlocking Design
### Overview
The image presents a stylized icon featuring an abstract, interlocking design composed of white lines against a solid purple background. The design appears to be a complex arrangement of curved and straight lines forming a central, roughly hexagonal shape. There is no numerical data or axes present.
### Components/Axes
There are no axes, scales, or legends in this image. The image consists solely of the icon itself and the background color.
### Detailed Analysis or Content Details
The icon is constructed from multiple white lines of approximately equal width. These lines intersect and overlap, creating a sense of depth and complexity. The lines are not uniform in curvature; some are sharply bent, while others are more gently curved. The overall shape is vaguely reminiscent of a flower or a stylized knot. The purple background is a consistent, flat color.
### Key Observations
The design is symmetrical around a central point, though the symmetry is not perfect. The interlocking nature of the lines suggests connection, integration, or complexity. The color contrast between the white lines and the purple background is high, making the icon visually prominent.
### Interpretation
This image is a logo or icon representing a concept related to interconnectedness, complexity, or a network. The hexagonal shape at the core could symbolize stability or structure. The purple color often represents creativity, wisdom, or spirituality. Without further context, it's difficult to determine the specific meaning, but the design suggests a modern, tech-focused brand or organization. The lack of data points or quantifiable information indicates this is a purely visual representation, intended to evoke a feeling or association rather than convey specific data. It is likely a branding element.
</details>
|
Table 1: Statistics of LsrInstruct. #Inst., #Cons. Types, #Cons. and Evaluation refer to the number of instructions, constraint types, total constraints, and evaluation methods.
3.2 Structure-Aware Reward Modeling
We adopt the Group Relative Policy Optimization (GRPO) Shao et al. (2024) training, where model optimization is driven by automatically computed signals indicating constraint satisfaction. For hard constraints, we use programmatic verification. For soft constraints, we employ a reward model to assess adherence. We train Qwen2.5-7B-Instruct as the reward model, where we exploit the natural partial order in and-type multi-constraint instructions to construct binary preference pairs and train the model via supervised fine-tuning with a binary classification objective following Ren et al. (2025).
Given constraint-level verification results, we aggregate these rewards according to the logical structure of each instruction. Formally, let $o$ denote a model output and $c$ denote an atomic constraint. We define a binary verification function $r(o,c)∈\{0,1\}$ , where $r(o,c)=1$ if output $o$ satisfies constraint $c$ , and $0$ otherwise. The aggregation of rewards according to logical structures is described as follows.
Reward for Parallel Structure (Average Aggregation).
For parallel constraint set $C=\{c_{1},...,c_{n}\}$ , we define:
$$
R_{\text{par}}(o,C)=\frac{1}{|C|}\sum_{c_{i}\in C}r(o,c_{i}). \tag{1}
$$
This coincides with standard RLVR aggregation under flat constraint assumptions.
Reward for Sequential Structure (Penalty Propagation).
For sequential structure $S=(c_{1},...,c_{n})$ , we introduce penalty propagation that discounts downstream rewards when earlier steps fail. The adjusted reward for $c_{i}$ is:
$$
r^{\prime}_{i}(o,S)=r(o,c_{i})\cdot\prod_{j<i}\gamma^{(1-r(o,c_{j}))}, \tag{2}
$$
where $\gamma∈[0,1)$ is a decay coefficient. The overall reward is:
$$
R_{\text{seq}}(o,S)=\frac{1}{|S|}\sum_{i=1}^{|S|}r^{\prime}_{i}(o,S). \tag{3}
$$
Reward for Conditional Structure (Branch Selection).
For conditional structure with trigger $c_{p}$ and branches $c_{\text{true}}$ , $c_{\text{false}}$ :
$$
R_{\text{cond}}(o,c_{p},c_{\text{true}},c_{\text{false}})=\begin{cases}r(o,c_{\text{true}}),&r(o,c_{p})=1,\\
r(o,c_{\text{false}}),&r(o,c_{p})=0.\end{cases} \tag{4}
$$
This ensures optimization focuses exclusively on the logically valid branch.
4 Experiment
| Models | Method | In-Domain | Out-of-Domain | | | | | | |
| --- | --- | --- | --- | --- | --- | --- | --- | --- | --- |
| IFEval | CFBench | FollowBench | ComplexBench | WritingBench | Collie | AgentIF | MultiChallenge | | |
| Pr.(L) | ISR | HSR | Overall | Avg. | Avg. | CSR | Overall | | |
| GPT-4o | Baseline | 84.8 | 65.3 | 70.4 | 71.6 | 75.5 | 49.8 | 58.5 | 12.9 |
| QwQ-32B | Baseline | 83.9 | 68.0 | 62.2 | 73.3 | 79.1 | 52.4 | 58.1 | 38.5 |
| Self-Supervised-7B | Baseline | 78.9 | 52.0 | 57.5 | 68.7 | 58.5 | 38.0 | 56.7 | 15.6 |
| VERIF-8B | Baseline | 87.1 | 41.0 | 56.9 | 54.7 | 50.8 | 28.3 | 56.6 | 15.0 |
| RAIF-7B | Baseline | 74.1 | 43.0 | 56.2 | 68.7 | 61.7 | 20.2 | 51.9 | 14.4 |
| SPAR-8B-DPO | Baseline | 82.4 | 37.0 | 56.1 | 63.8 | 47.0 | 27.7 | 53.6 | 17.1 |
| Crab-7B-DPO | Baseline | 57.7 | 25.0 | 49.4 | 59.0 | 45.4 | 19.6 | 47.2 | 14.1 |
| Conifer-7B-DPO | Baseline | 52.3 | 25.0 | 50.0 | 48.1 | 32.2 | 17.8 | 44.3 | 8.0 |
| Qwen2.5-1.5B-Instruct | Base | 43.6 | 22.0 | 34.6 | 45.9 | 44.8 | 13.0 | 42.8 | 12.0 |
| SFT | 64.0 | 24.0 | 37.4 | 49.8 | 44.4 | 16.1 | 46.4 | 10.2 | |
| LsrIF | 68.8 (+25.2) | 28.0 (+6.0) | 38.9 (+4.3) | 52.4 (+6.5) | 46.8 (+2.0) | 19.3 (+6.3) | 51.5 (+8.7) | 14.4 (+2.4) | |
| Qwen2.5-7B-Instruct | Base | 73.9 | 47.0 | 55.1 | 66.1 | 57.2 | 36.3 | 54.2 | 15.2 |
| SFT | 75.2 | 43.0 | 55.7 | 68.5 | 51.2 | 30.5 | 55.5 | 14.5 | |
| LsrIF | 79.7 (+5.8) | 54.0 (+7.0) | 57.5 (+2.4) | 70.0 (+3.9) | 63.2 (+6.0) | 37.3 (+1.0) | 56.5 (+2.3) | 18.7 (+3.5) | |
| Distill-Qwen-7B | Base | 61.7 | 36.0 | 41.7 | 55.2 | 53.0 | 25.2 | 47.2 | 13.9 |
| SFT | 65.1 | 40.0 | 43.1 | 55.8 | 53.6 | 28.3 | 44.2 | 14.2 | |
| LsrIF | 71.5 (+9.8) | 47.0 (+11.0) | 44.0 (+2.3) | 61.1 (+5.9) | 55.0 (+2.0) | 30.0 (+4.8) | 46.7 (-0.5) | 15.0 (+1.1) | |
| Llama-3.1-8B-Instruct | Base | 73.8 | 34.0 | 53.8 | 63.6 | 47.5 | 46.5 | 53.4 | 16.2 |
| SFT | 77.4 | 36.0 | 52.2 | 61.1 | 46.9 | 34.5 | 55.2 | 14.9 | |
| LsrIF | 81.5 (+7.7) | 40.0 (+6.0) | 58.4 (+4.6) | 63.9 (+0.3) | 48.0 (+0.5) | 47.6 (+1.1) | 57.8 (+4.4) | 18.7 (+2.5) | |
| Distill-Qwen-14B | Base | 74.9 | 55.0 | 51.2 | 72.7 | 61.0 | 34.4 | 54.5 | 17.2 |
| SFT | 79.3 | 56.0 | 56.8 | 70.5 | 59.2 | 36.1 | 59.2 | 16.4 | |
| LsrIF | 82.1 (+7.2) | 60.0 (+5.0) | 58.2 (+7.0) | 75.5 (+2.8) | 63.8 (+2.8) | 38.8 (+4.4) | 61.7 (+7.2) | 18.3 (+1.1) | |
| Qwen3-8B | Base | 87.8 | 66.0 | 56.4 | 78.5 | 75.1 | 45.5 | 64.4 | 29.8 |
| SFT | 80.6 | 62.0 | 53.2 | 74.3 | 74.7 | 35.0 | 63.3 | 25.6 | |
| LsrIF | 90.2 (+2.4) | 68.0 (+2.0) | 58.1 (+1.7) | 79.2 (+0.7) | 75.6 (+0.5) | 48.1 (+2.6) | 65.0 (+0.6) | 32.3 (+2.5) | |
Table 2: Model performance on in-domain and out-of-domain instruction following benchmarks.
4.1 Set-up
Models.
We conduct experiments on models of different scales from 1.5B to 14B to evaluate the effectiveness of our method across different architectures and parameter scales. Specifically, we evaluate on: (1) 1.5B: Qwen2.5-1.5B-Instruct; (2) 7B: Qwen2.5-7B-Instruct and Distill-Qwen-7B; (3) 8B: Llama-3.1-8B-Instruct and Qwen3-8B; (4) 14B: Distill-Qwen-14B. This diverse set of models allows us to assess the generalizability of our approach across different model families and scales.
Baselines.
We compare against both strong general-purpose models and specialized instruction-following optimized models. General-purpose baselines include GPT-4o and QwQ-32B. Specialized instruction-following baselines include RAIF-7B, Self-Supervised-7B, VERIF-8B, SPAR-8B-DPO, Conifer-7B-DPO, and Crab-7B-DPO, which are specifically optimized for instruction following tasks using various training paradigms including supervised fine-tuning, self-supervised learning, verification-based reinforcement learning training, and direct preference optimization.
Training Methods.
We compare three training methods: Base uses the original model directly without any additional training; SFT fine-tunes the model on the dataset generated by the strong model GPT-4.1 using supervised fine-tuning; LsrIF is our logic-structured reinforcement learning training method that employs structure-aware reward modeling to align optimization signals with logical constraint structure execution semantics. For each model scale, we evaluate all three methods to demonstrate the effectiveness of our approach.
Evaluation Benchmarks.
We evaluate models on both in-domain and out-of-domain instruction following benchmarks. In-domain benchmarks include IFEval Zhou et al. (2023) (Pr.(L)), CFBench Zhang et al. (2024) (ISR), and FollowBench Jiang et al. (2023) (HSR). Out-of-domain benchmarks include ComplexBench Wen et al. (2024) (Overall), WritingBench Wu et al. (2025) (Avg.), Collie Yao et al. (2023) (Avg.), AgentIF Qi et al. (2025) (CSR), and MultiChallenge Deshpande et al. (2025) (Overall). Details of the experiment set-up are provided in Appx. A.4.
4.2 Performance
Instruction Following Performance.
As shown in Tab. 2, LsrIF significantly improves instruction following capabilities across different models on both in-domain and out-of-domain benchmarks. LsrIF consistently outperforms Base and SFT across all model scales, with improvements on various metrics.
On in-domain benchmarks, LsrIF achieves substantial gains across all model scales. For smaller models, Qwen2.5-1.5B-Instruct shows remarkable improvements, improving by 25.2 on IFEval and 6.0 on CFBench. For 7B models, Qwen2.5-7B-Instruct improves by 5.8 on IFEval and 7.0 on CFBench. For stronger models, Qwen3-8B achieves strong performance with improvements of 2.4 on IFEval and 2.0 on CFBench. On out-of-domain benchmarks, LsrIF demonstrates consistent improvements across diverse evaluation scenarios. Qwen2.5-7B-Instruct improves by 6.0 on WritingBench and 3.5 on MultiChallenge. Qwen2.5-1.5B-Instruct shows improvements of 6.5 on ComplexBench and 8.7 on AgentIF.
Notably, LsrIF enables models to outperform specialized baseline models even while the base model initially underperforms. For instance, Qwen2.5-7B-Instruct underperforms RAIF-7B and Self-Supervised-7B, but after LsrIF training exceeds both baselines with substantial improvements. After LsrIF, Qwen3-8B achieves 90.2 on IFEval, higher than GPT-4o (84.8) and VERIF-8B (87.1), demonstrating state-of-the-art performance on this benchmark.
Logical Reasoning Performance.
We evaluate logical reasoning capabilities using Enigmata Chen et al. (2025), a comprehensive benchmark suite designed to assess logical reasoning abilities of large language models. Enigmata comprises 36 tasks distributed across seven categories, with each task equipped with generators that can produce infinite examples and rule-based verifiers. The benchmark evaluates four key reasoning subcategories: Logic (formal logical inference), Arithmetic (mathematical computation and reasoning), Graph (graph-based problem solving) and Search (path-finding task).
As shown in Tab. 3, LsrIF effectively enhances both logical reasoning and general capabilities. On Enigmata, LsrIF outperforms base models across all subcategories, with particularly strong gains on Arithmetic. For Distill-Qwen-7B, Arithmetic improves by 10.6, while Logic increases by 2.7 and Graph by 6.4. For Distill-Qwen-14B, Arithmetic shows the most substantial improvement, increasing by 18.0, with Logic improving by 3.7 and Graph by 2.2. The significant improvements on Arithmetic suggest that LsrIF ’s structure-aware reward modeling effectively captures mathematical constraint satisfaction, enabling models to better follow numerical and computational requirements in instructions.
| Model | Logic Reasoning (Enigmata) | General Capabilities | | | | | | | | |
| --- | --- | --- | --- | --- | --- | --- | --- | --- | --- | --- |
| Logic | Arithmetic | Graph | Search | Overall | AIME2024 | AIME2025 | GPQA-Diamond | MT-Bench | AlpacaEval2.0 | |
| Distill-Qwen-7B | 10.9 | 3.7 | 11.1 | 4.4 | 9.9 | 53.4 | 38.7 | 49.1 | 5.9 | 5.0 |
| Distill-Qwen-7B- LsrIF | 13.6 | 14.3 | 17.5 | 4.6 | 12.4 | 55.1 | 41.2 | 52.5 | 6.3 | 5.8 |
| Distill-Qwen-14B | 44.7 | 21.0 | 31.1 | 10.5 | 22.4 | 69.3 | 49.0 | 58.6 | 6.6 | 26.7 |
| Distill-Qwen-14B- LsrIF | 48.4 | 39.0 | 33.3 | 14.1 | 24.4 | 70.2 | 49.6 | 60.1 | 7.0 | 30.3 |
Table 3: Model performance on logic reasoning (Enigmata) and general capabilities benchmarks. We evaluate AIME using Avg@30 method. Bolded value indicates the best result for each model on the benchmark.
On general capabilities benchmarks, which encompass mathematics (AIME2024, AIME2025), science (GPQA-Diamond), and general instruction following (MT-Bench, AlpacaEval2.0), LsrIF brings consistent improvements across all evaluated benchmarks. These results demonstrate that LsrIF not only enhances logical reasoning capabilities but also improves general model performance across diverse evaluation domains.
<details>
<summary>x3.png Details</summary>
### Visual Description
\n
## Bar Chart: Performance Comparison of Language Models
### Overview
This bar chart compares the performance of four different language models – Distill-Qwen-7B (Base), Lim as a judge (Const.-Level), Our-RM-7B (Inst.-Level), and Our-RM-7B (Const.-Level) – across three evaluation benchmarks: IFEval, AIME, and CFBench. Performance is measured on the y-axis, while the x-axis represents the benchmarks.
### Components/Axes
* **X-axis:** Benchmarks - IFEval, AIME, CFBench
* **Y-axis:** Performance (Scale from 0 to 80)
* **Legend:**
* Distill-Qwen-7B (Base) - Light Orange
* Lim as a judge (Const.-Level) - Light Blue
* Our-RM-7B (Inst.-Level) - Light Green
* Our-RM-7B (Const.-Level) - Pale Yellow
* **Chart Type:** Bar Chart
* **Legend Position:** Top-right corner
### Detailed Analysis
The chart consists of three groups of four bars, one group for each benchmark.
**IFEval:**
* Distill-Qwen-7B (Base): Approximately 62.
* Lim as a judge (Const.-Level): Approximately 64.
* Our-RM-7B (Inst.-Level): Approximately 68.
* Our-RM-7B (Const.-Level): Approximately 70.
**AIME:**
* Distill-Qwen-7B (Base): Approximately 55.
* Lim as a judge (Const.-Level): Approximately 56.
* Our-RM-7B (Inst.-Level): Approximately 56.
* Our-RM-7B (Const.-Level): Approximately 55.
**CFBench:**
* Distill-Qwen-7B (Base): Approximately 38.
* Lim as a judge (Const.-Level): Approximately 43.
* Our-RM-7B (Inst.-Level): Approximately 44.
* Our-RM-7B (Const.-Level): Approximately 47.
### Key Observations
* **Our-RM-7B (Const.-Level)** consistently performs the best across all three benchmarks, although the difference is most pronounced in IFEval.
* **Distill-Qwen-7B (Base)** generally exhibits the lowest performance across all benchmarks.
* **Lim as a judge (Const.-Level)** and **Our-RM-7B (Inst.-Level)** show similar performance in AIME.
* The performance differences between the models are more significant in IFEval and CFBench than in AIME.
### Interpretation
The data suggests that the "Our-RM-7B" model, particularly when trained with a "Const.-Level" approach, outperforms the "Distill-Qwen-7B" baseline and the "Lim as a judge" model across the evaluated benchmarks. This indicates that the training methodology and model architecture of "Our-RM-7B" are more effective for these specific tasks. The relatively consistent performance of "Lim as a judge" and "Our-RM-7B (Inst.-Level)" in AIME suggests that the "Inst.-Level" training approach may be particularly suited for that benchmark. The lower performance of all models on CFBench could indicate that this benchmark presents a greater challenge or requires different capabilities than IFEval and AIME. The consistent ranking of the models across benchmarks suggests a general trend in their relative performance, rather than benchmark-specific anomalies.
</details>
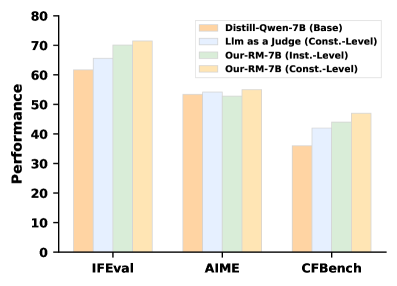
Figure 3: LsrIF performance on different reward forms. Const.-Level and Inst.-Level refer to constraint-level and instruction-level, respectively.
4.3 Ablation Studies
As shown in Tab. 4, removing any component degrades performance compared to the full LsrIF. Removing the LsRM, which ignores logical structure and averages rewards across all constraints, results in the largest drop, indicating its critical importance. Specifically, without LsRM, performance decreases by 2.9 on IFEval, 5.0 on CFBench, and 2.7 on AIME2024. This demonstrates that structure-aware reward modeling is essential for effectively capturing logical constraint relationships.
Removing sequential data from LsrInstruct also leads to performance decreases, with drops of 1.6 on IFEval and 3.0 on CFBench. Similarly, removing conditional data results in decreases of 1.8 on IFEval, 3.0 on CFBench, and 3.5 on AIME2024.
All ablation variants still outperform the base model. This indicates that even partial components of LsrIF provide substantial benefits over the base model. These results demonstrate that each component—the logic-structured reward modeling and logic-structured dataset construction play a crucial role in the overall effectiveness of LsrIF.
4.4 Robustness of LsrIF
| Config | Performance | | | |
| --- | --- | --- | --- | --- |
| IFEval | CFBench | AIME2024 | Enigmata | |
| Distill-Qwen-7B | 61.7 | 36.0 | 53.4 | 9.9 |
| Distill-Qwen-7B- LsrIF | 71.5 | 47.0 | 55.1 | 12.4 |
| w/o LsRM | 68.6 | 42.0 | 52.4 | 10.5 |
| w/o Sequential Data | 69.9 | 44.0 | 54.0 | 11.0 |
| w/o Conditional Data | 69.7 | 44.0 | 51.6 | 10.9 |
Table 4: Ablation study results on different abilities. Bolded values indicate the best performance.
<details>
<summary>x4.png Details</summary>
### Visual Description
\n
## Line Chart: Model Performance vs. Depth
### Overview
This line chart compares the performance "Score" of two language models, Distill-Qwen-7B and Distill-Qwen-14B, across different "Depth" levels (1, 2, and 3). Each model is evaluated with and without "LsrfF" (likely a feature or training method). The chart displays the score as a function of depth for each model and configuration.
### Components/Axes
* **X-axis:** "Depth" with markers at 1, 2, and 3.
* **Y-axis:** "Score" ranging from approximately 40 to 72.
* **Legend:** Located at the top-center of the chart.
* Distill-Qwen-7B (Base) - Solid Blue Line
* Distill-Qwen-7B (LsrfF) - Dashed Blue Line
* Distill-Qwen-14B (Base) - Dashed Green Line
* Distill-Qwen-14B (LsrfF) - Solid Green Line
### Detailed Analysis
**Distill-Qwen-7B (Base) - Solid Blue Line:**
The line slopes downward from Depth 1 to Depth 2, then slightly upward to Depth 3.
* Depth 1: Approximately 62.
* Depth 2: Approximately 43.
* Depth 3: Approximately 45.
**Distill-Qwen-7B (LsrfF) - Dashed Blue Line:**
The line slopes downward from Depth 1 to Depth 3.
* Depth 1: Approximately 53.
* Depth 2: Approximately 42.
* Depth 3: Approximately 40.
**Distill-Qwen-14B (Base) - Dashed Green Line:**
The line slopes downward from Depth 1 to Depth 2, then slightly upward to Depth 3.
* Depth 1: Approximately 71.
* Depth 2: Approximately 70.
* Depth 3: Approximately 70.
**Distill-Qwen-14B (LsrfF) - Solid Green Line:**
The line slopes downward from Depth 1 to Depth 3.
* Depth 1: Approximately 70.
* Depth 2: Approximately 68.
* Depth 3: Approximately 69.
### Key Observations
* Distill-Qwen-14B consistently outperforms Distill-Qwen-7B across all depths and configurations.
* The "LsrfF" feature generally decreases the score for both models, although the effect is more pronounced for Distill-Qwen-7B.
* The performance of Distill-Qwen-7B (Base) drops significantly between Depth 1 and Depth 2, then recovers slightly.
* Distill-Qwen-14B (Base) maintains a relatively stable score across all depths.
### Interpretation
The data suggests that Distill-Qwen-14B is a more robust model than Distill-Qwen-7B, as its performance is less sensitive to changes in depth. The "LsrfF" feature appears to have a detrimental effect on performance, potentially indicating that it is not well-suited for these models or this specific task. The drop in performance for Distill-Qwen-7B (Base) at Depth 2 could indicate a point of instability or a limitation in the model's ability to generalize to deeper levels. The consistent performance of Distill-Qwen-14B (Base) suggests it has a greater capacity to handle increasing depth without significant performance degradation. The chart demonstrates a trade-off between model size (7B vs 14B) and the application of the "LsrfF" feature. Further investigation is needed to understand the underlying reasons for these trends and to determine whether the "LsrfF" feature can be optimized for better performance.
</details>
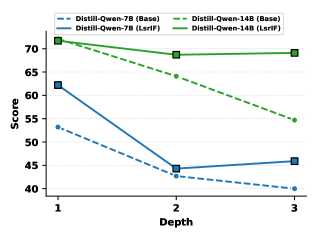
Figure 4: Performance on nested structures from Wen et al. (2024).
<details>
<summary>x5.png Details</summary>
### Visual Description
\n
## Heatmap: Attention and MLP Layer Contributions
### Overview
The image presents a heatmap visualizing the contribution of different attention and Multi-Layer Perceptron (MLP) components across various layers (numbered 0 to 27). The color intensity represents the magnitude of the contribution, with warmer colors (orange/red) indicating higher contributions and cooler colors (blue) indicating lower contributions.
### Components/Axes
* **X-axis:** Represents different components: "attn. q", "attn. k", "attn. v", "attn. o", "mlp. up", "mlp. down", "mlp. gate".
* **Y-axis:** Represents layer numbers, ranging from 0 to 27.
* **Color Scale:** Ranges from approximately 0.075 (blue) to 0.105 (orange/red). The scale is positioned on the right side of the heatmap.
### Detailed Analysis
The heatmap displays the contribution levels for each component at each layer. Here's a breakdown of the observed trends:
* **attn. q:** Shows a strong initial contribution at layers 0-4, then gradually decreases and remains relatively low from layer 8 onwards. The color transitions from orange to blue. Approximate values: Layer 0: ~0.100, Layer 4: ~0.095, Layer 8: ~0.080, Layer 27: ~0.075.
* **attn. k:** Exhibits a similar trend to "attn. q", with high contributions in the initial layers (0-8) and a decline thereafter. Approximate values: Layer 0: ~0.105, Layer 4: ~0.100, Layer 8: ~0.090, Layer 27: ~0.075.
* **attn. v:** Shows a moderate contribution across most layers, with a slight peak around layers 4-12. Approximate values: Layer 0: ~0.085, Layer 8: ~0.090, Layer 12: ~0.095, Layer 27: ~0.080.
* **attn. o:** Displays a relatively consistent, low contribution across all layers. Approximate values: ~0.075 - 0.085 across all layers.
* **mlp. up:** Shows a gradual increase in contribution from layer 0 to a peak around layer 16-20, then a slight decline. Approximate values: Layer 0: ~0.075, Layer 16: ~0.100, Layer 20: ~0.095, Layer 27: ~0.085.
* **mlp. down:** Exhibits a strong contribution in the later layers (16-27), with a peak around layer 24. Approximate values: Layer 16: ~0.085, Layer 24: ~0.105, Layer 27: ~0.095.
* **mlp. gate:** Shows a very strong contribution at layer 24, and is otherwise low. Approximate values: Layer 24: ~0.105, other layers: ~0.075.
### Key Observations
* Attention components ("attn. q", "attn. k", "attn. v") have higher contributions in the earlier layers, suggesting their importance in initial feature extraction.
* MLP components ("mlp. up", "mlp. down", "mlp. gate") become more prominent in the later layers, indicating their role in higher-level processing and decision-making.
* "mlp. gate" shows a very localized, strong contribution at layer 24, which could indicate a critical gating mechanism at that specific layer.
* "attn. o" consistently has the lowest contribution across all layers.
### Interpretation
This heatmap likely represents the attention weights or activation magnitudes within a transformer-based neural network. The data suggests a hierarchical processing structure where attention mechanisms are crucial in the initial stages, while MLP layers take over in the later stages. The strong contribution of "mlp. gate" at layer 24 could indicate a key control point in the network's decision-making process. The decreasing contribution of attention components as the network deepens suggests that the network relies less on direct attention and more on learned representations as it processes information. The heatmap provides valuable insights into the internal workings of the model and can be used to identify potential areas for optimization or further investigation.
</details>
(a) Qwen2.5-7B-Instruct
<details>
<summary>x6.png Details</summary>
### Visual Description
\n
## Heatmap: Attention and MLP Layer Contributions
### Overview
The image presents a heatmap visualizing the contributions of different attention and Multi-Layer Perceptron (MLP) components across various layers. The x-axis represents different components (attn. q, attn. k, attn. v, attn. o, mlp. up, mlp. down, mlp. gate), and the y-axis represents layer numbers ranging from 0 to 27. The color intensity indicates the magnitude of the contribution, with a colorbar on the right showing the scale from 0.12 to 0.18.
### Components/Axes
* **X-axis:** Represents different components:
* `attn. q` (Attention Query)
* `attn. k` (Attention Key)
* `attn. v` (Attention Value)
* `attn. o` (Attention Output)
* `mlp. up` (MLP Up-projection)
* `mlp. down` (MLP Down-projection)
* `mlp. gate` (MLP Gate)
* **Y-axis:** Represents layer numbers, ranging from 0 to 27, with markers at intervals of 4 (0, 4, 8, 12, 16, 20, 24, 27).
* **Colorbar:** Located on the right side of the heatmap, indicating the value scale.
* Minimum Value: 0.12 (represented by light blue)
* Maximum Value: 0.18 (represented by dark orange)
### Detailed Analysis
The heatmap displays varying levels of contribution for each component across different layers.
* **attn. q:** Shows a relatively consistent contribution across layers, generally around 0.14-0.16. There's a slight increase in contribution towards the higher layers (20-27).
* **attn. k:** Exhibits a strong contribution in the initial layers (0-8), peaking around 0.17-0.18. The contribution then decreases significantly in subsequent layers, falling to around 0.12-0.14.
* **attn. v:** Displays a pattern similar to `attn. k`, with high contribution in the initial layers (0-8) and a decline in later layers. The peak contribution is around 0.16-0.17.
* **attn. o:** Shows a gradual increase in contribution from lower layers (0-8) to higher layers (20-27), reaching a peak of approximately 0.17-0.18 in the highest layers.
* **mlp. up:** Exhibits a relatively consistent contribution across layers, generally around 0.14-0.16.
* **mlp. down:** Shows a similar pattern to `mlp. up`, with a consistent contribution around 0.14-0.16.
* **mlp. gate:** Displays a pattern of increasing contribution from lower layers to higher layers, peaking around 0.17-0.18 in the highest layers.
Specifically, approximate values (with uncertainty of +/- 0.02):
| Component | Layer 0 | Layer 4 | Layer 8 | Layer 12 | Layer 16 | Layer 20 | Layer 24 | Layer 27 |
|---|---|---|---|---|---|---|---|---|
| attn. q | 0.14 | 0.15 | 0.16 | 0.15 | 0.16 | 0.17 | 0.17 | 0.17 |
| attn. k | 0.18 | 0.17 | 0.16 | 0.14 | 0.13 | 0.13 | 0.13 | 0.14 |
| attn. v | 0.17 | 0.16 | 0.15 | 0.13 | 0.12 | 0.13 | 0.13 | 0.14 |
| attn. o | 0.12 | 0.13 | 0.14 | 0.15 | 0.16 | 0.17 | 0.17 | 0.18 |
| mlp. up | 0.14 | 0.15 | 0.15 | 0.15 | 0.16 | 0.16 | 0.16 | 0.16 |
| mlp. down | 0.14 | 0.15 | 0.15 | 0.15 | 0.16 | 0.16 | 0.16 | 0.16 |
| mlp. gate | 0.12 | 0.13 | 0.14 | 0.15 | 0.16 | 0.17 | 0.17 | 0.18 |
### Key Observations
* Attention Key (`attn. k`) and Attention Value (`attn. v`) components have the highest contributions in the initial layers, suggesting their importance in early stages of processing.
* Attention Output (`attn. o`) and MLP Gate (`mlp. gate`) components show increasing contributions in higher layers, indicating their growing significance in later stages.
* MLP Up-projection (`mlp. up`) and MLP Down-projection (`mlp. down`) maintain relatively consistent contributions across all layers.
* The heatmap reveals a shift in contribution from attention mechanisms in lower layers to MLP components in higher layers.
### Interpretation
This heatmap likely represents the contribution of different components within a deep learning model, potentially a Transformer-based architecture, across its layers. The data suggests that the initial layers rely heavily on attention mechanisms (specifically the Key and Value components) to extract and process input features. As the data flows through the network, the role of attention mechanisms shifts towards the Output component, while MLP components (particularly the Gate) become increasingly important for higher-level feature transformations and decision-making.
The consistent contribution of MLP Up and Down projections suggests their role in maintaining a stable feature representation throughout the network. The shift in contribution patterns could indicate that the model learns to initially focus on identifying relevant input features using attention, and then utilizes MLP layers to refine and integrate these features for final predictions. The heatmap provides valuable insights into the internal workings of the model and can be used to guide architectural modifications or optimization strategies.
</details>
(b) Distill-Qwen-7B
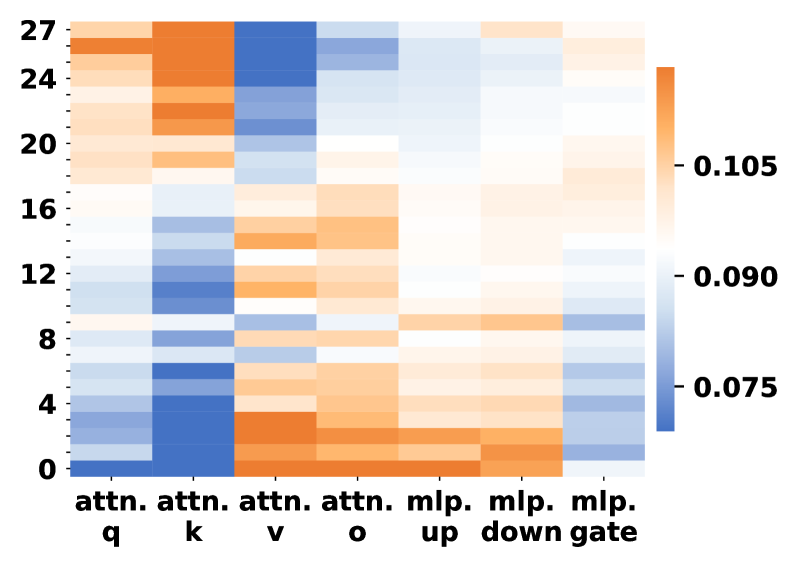
Figure 5: Parameter change rates of LLMs to the original ones across different modules. Darker orange colors indicate larger parameter changes.
<details>
<summary>x7.png Details</summary>
### Visual Description
\n
## Diagram: Procedural Flowchart
### Overview
The image presents a flowchart outlining a three-step procedural process. The flowchart utilizes numbered boxes and text labels to describe each step, accompanied by a crown icon in the top-right corner. The text is primarily in English, with some elements presented as code-like instructions.
### Components/Axes
The diagram consists of three numbered boxes arranged horizontally. Each box contains a textual instruction. A crown icon is positioned in the top-right corner of the diagram. The instructions are formatted as follows:
* Box 1: "First/then/else..."
* Box 2: "bullet/lowercase/bolded..."
* Box 3: "apply/formal/generate..."
### Detailed Analysis or Content Details
The flowchart progresses linearly from left to right.
* **Step 1:** The first box, labeled "1", contains the text "First, generate a short instructional paragraph and ensure the total length does not exceed three sentences".
* **Step 2:** The second box, labeled "2", contains the text "then, append a clearly separated checklist section using bullet points".
* **Step 3:** The third box, labeled "3", contains the text "if the word “error” appears anywhere in the output, all checklist items must be written in lowercase English, else the instructional paragraph must begin with a bolded core idea".
### Key Observations
The flowchart outlines a conditional process for generating text. The final step introduces a conditional check for the presence of the word "error", which alters the formatting of a subsequent checklist. The instructions are presented in a somewhat code-like manner, suggesting a programmatic or automated process.
### Interpretation
This diagram describes a process for generating a document with specific formatting rules. The flowchart emphasizes the importance of brevity in the initial paragraph and the conditional formatting of a checklist based on the presence of a specific keyword ("error"). The use of "First/then/else" and "apply/formal/generate" suggests a procedural or algorithmic approach to document creation. The crown icon may symbolize a quality control or approval step. The flowchart is a meta-instructional document, describing *how* to create a document, rather than the content of the document itself. The conditional logic suggests a robust process designed to handle potential errors and adapt the output accordingly.
</details>
(a) Instruction Following – More Attention on constraints and their underlying logic
<details>
<summary>x8.png Details</summary>
### Visual Description
\n
## Textual Analysis: Logical Reasoning Problem
### Overview
The image presents a logical reasoning problem with several premises and a conclusion. Certain phrases within the premises and conclusion are highlighted in blue. A legend on the right side of the image associates numbers with logical connectors. The task is to determine if the conclusion is true, false, or uncertain based on the given premises.
### Components/Axes
The image consists of:
* **Problem Statement:** A textual description of the logical reasoning problem.
* **Premises:** A series of statements providing the basis for the reasoning.
* **Conclusion:** A statement to be evaluated based on the premises.
* **Highlighting:** Blue highlighting emphasizes specific phrases within the text.
* **Legend:** A small table associating numbers with logical connectors:
| Number | Logical Connector |
|---|---|
| 1 | "or/and..." |
| 2 | "either/not..." |
| 3 | "often/attends..." |
### Content Details
The text of the problem is as follows:
"Please determine whether the conclusion is **true**, **false**, or **uncertain** based on these premises. Premises are: People in this club **who perform in school talent shows often attend** and are very engaged with school events. People in this club either **perform in school talent shows** or are inactive and **dis interested** community members. People in this club **who chaperone high school dances** are **not** students who attend the school. All people in this club **who are inactive and disinterested** members of their community **chaperone high school dances**. All young children and teenagers in this club **who wish to further their academic careers and educational opportunities** are students **who attend** the school. \nBonnie is in this club and she **either both attends** and is very engaged with school events and is a student **who attends** the school or **is not** someone **who both attends** and is very engaged with school events and is **not** a student **who attends** the school. Conclusion is: Bonnie **performs in school talent shows**."
The phrases highlighted in blue are those associated with the logical connector "often/attends..." (number 3 in the legend).
### Key Observations
The problem focuses on evaluating the logical relationship between Bonnie's characteristics and her participation in school talent shows. The premises establish connections between club membership, talent show participation, school engagement, student status, and community involvement. The conclusion asserts that Bonnie performs in school talent shows. The highlighting emphasizes the "often/attends" relationship, suggesting it may be crucial to the evaluation.
### Interpretation
The image presents a complex logical argument. The use of highlighting and a legend indicates that the problem is designed to test the ability to identify and apply logical connectors. The task requires careful analysis of the premises to determine whether the conclusion necessarily follows from the given information. The problem is not about extracting numerical data or identifying trends, but rather about understanding the logical structure of the argument. The problem is designed to be solved by applying principles of deductive reasoning. The presence of "uncertain" as a possible answer suggests that the premises may not provide sufficient information to definitively prove or disprove the conclusion. The problem is a test of logical reasoning skills, not a presentation of data.
</details>
(b) Logic Reasoning – More Attention on logical connectors
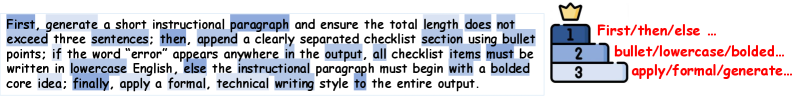
Figure 6: Comparison of attention importance changes for each token position in Qwen2.5-7B-Instruct before and after training on instruction following and logic reasoning tasks. Darker colors indicate greater increases.
4.4.1 Robustness to Reward Modeling
We compare our reward model with alternative reward methods to demonstrate robustness of our method to different reward forms. As shown in Fig. 3, all reward methods outperform the baseline, indicating that our method is robust to reward forms. LLM-as-a-Judge (Qwen2.5-7B-Instruct) with constraint-level rewards shows improvements over the base model on IFEval and CFBench. Our reward model with instruction-level rewards further improves performance on IFEval and CFBench, while our constraint-level variant achieves the best performance across all evaluated benchmarks.
Furthermore, our RM consistently outperforms LLM-as-a-Judge, demonstrating the superior effectiveness of our reward model. The constraint-level variant achieves substantial improvements over LLM-as-a-Judge on both IFEval and CFBench. Both instruction-level and constraint-level variants of our RM achieve competitive performance, with the constraint-level variant achieving the best overall results, indicating that our method is effective for different reward granularity. The superior performance of constraint-level rewards suggests that fine-grained constraint evaluation enables more precise optimization signals compared to instruction-level aggregation.
4.4.2 Generalization to Nested Structures
We conduct experiments to evaluate the performance of our method under nested logical-structure constraints. Although our training data only contains non-nested structures, LsrIF still improves performance on nested constraint structures: Selection_1 (depth 1), Selection_and_Chain_2 (depth 2), and Selection_and_Chain_3 (depth 3) from ComplexBench. As shown in Fig. 4, LsrIF maintains better performance across all depths compared to Base models. These results indicate that the improvements gained from training on non-nested structures generalize effectively to nested constraint structures, with the benefits becoming pronounced at higher nesting depths.
5 Interpretability Analysis
5.1 Parameter Change Patterns
Fig. 5 presents the relative parameter change rates across layers and modules after LsrIF training. The change rate is measured using the normalized Frobenius norm:
$$
\Delta=\frac{\|W_{\text{after}}-W_{\text{before}}\|_{F}}{\|W_{\text{before}}\|_{F}}\times 100\%, \tag{5}
$$
where $W_{\text{before}}$ and $W_{\text{after}}$ denote the parameters before and after training. For a model with $L$ layers, let $\Delta_{m}^{(l)}$ denote the change rate for module $m$ at layer $l$ .
Attention vs. MLP Modules. A clear pattern observed in Fig. 5 is that attention modules undergo substantially larger parameter changes than MLP modules across most layers. In particular, the query and key projection matrices exhibit the highest change rates, while MLP up and down projections show comparatively smaller and more uniform updates:
$$
\Delta^{(l)}_{\text{attn.q}},\ \Delta^{(l)}_{\text{attn.k}}\;>\;\Delta^{(l)}_{\text{mlp.up}},\ \Delta^{(l)}_{\text{mlp.down}},\quad \tag{6}
$$
Layer-wise Trends. This discrepancy between attention and MLP updates is consistent across layers. Although both module types display some variation along depth, attention-related parameters consistently dominate the overall magnitude of change, especially in lower and upper layers. In contrast, MLP parameters remain relatively stable throughout the network.
Model Consistency. The same trend holds for both Qwen2.5-7B-Instruct and Distill-Qwen-7B. While the distilled model shows larger absolute change magnitudes, the relative dominance of attention parameter updates over MLP updates remains consistent.
Overall, these results indicate that LsrIF primarily induces stronger updates in attention mechanisms, whereas MLP layers are affected to a much lesser extent.
5.2 Token-Level Information Flow Analysis
We analyze token-level information flow using gradient-based saliency attribution to quantify how training redirects attention to semantically critical tokens. For token $x_{i}$ with embedding $E_{i}$ , the attribution score is defined as
$$
S_{i}=\left|\sum_{d=1}^{D}\frac{\partial L}{\partial E_{i,d}}\cdot E_{i,d}\right|. \tag{7}
$$
The sequence-level loss function is defined as
$$
L(x,y)=\sum_{t=1}^{|y|}\log P(y_{t}\mid y_{<t},x). \tag{8}
$$
The change in attention importance is measured as
$$
\Delta S_{i}=S_{i}^{\text{after}}-S_{i}^{\text{before}}, \tag{9}
$$
where higher values indicate greater increases in attention importance.
As shown in Fig. 6, training shifts attention from diffuse to concentrated patterns, directly corresponding to parameter changes in attention query and key modules (Fig. 5). For instruction following tasks, we observe a hierarchical attention increase across three token categories: logical connectors (“First”, “then”, “else”) show the highest increase, constraint tokens (“bullet”, “lowercase”, “bolded”) show moderate increase, and action verbs (“apply”, “formal”) show lower increase. For logic reasoning tasks, we observe a similar hierarchical pattern: logical operators (“or”, “and”) show the highest increase, followed by choice/negation terms (“either”, “not”) and descriptive predicates (“attends”).
This hierarchical pattern indicates that the model prioritizes structural elements encoding logical relationships, aligning with structure-aware reward modeling. The substantial updates to $\Delta^{(l)}_{\text{attn.q}}$ and $\Delta^{(l)}_{\text{attn.k}}$ enable query and key representations that prioritize tokens encoding logical structures. The attention mechanism computes query-key similarities where query and key projections are updated to maximize attention weights for structural tokens, validating that LsrIF adapts attention mechanisms to capture constraint relationships rather than merely adjusting output representations.
6 Conclusion
In this work, we propose LsrIF, a logic-structured training framework. We construct LsrInstruct, a multi-constraint instruction dataset covering parallel, sequential, and conditional constraint logic structures, and design LsRM, structure-aware reward modeling that aligns training signals with logical execution semantics. LsrIF improves instruction following in both in-domain and out-of-domain settings, while also enhancing general reasoning ability. We also conduct attention and token-level interpretability analysis for model performance improvements.
7 Limitations
Our study has following main limitations. First, due to computational constraints, we do not evaluate our method on larger models such as 70B+, and validation at this scale would further strengthen the credibility and robustness of our approach. Second, our training data is primarily English. While results on CFBench indicate that logic-structured training can generalize to other languages, we encourage the community to construct multilingual logic-structured instruction datasets to more systematically assess and extend cross-lingual generalization.
References
- K. An, L. Sheng, G. Cui, S. Si, N. Ding, Y. Cheng, and B. Chang (2025) UltraIF: advancing instruction following from the wild. arXiv preprint arXiv:2502.04153. Cited by: §1.
- J. Chen, Q. He, S. Yuan, A. Chen, Z. Cai, W. Dai, H. Yu, Q. Yu, X. Li, J. Chen, et al. (2025) Enigmata: scaling logical reasoning in large language models with synthetic verifiable puzzles. arXiv preprint arXiv:2505.19914. Cited by: §A.4.3, §4.2.
- J. Cheng, X. Liu, C. Wang, X. Gu, Y. Lu, D. Zhang, Y. Dong, J. Tang, H. Wang, and M. Huang (2024) Spar: self-play with tree-search refinement to improve instruction-following in large language models. arXiv preprint arXiv:2412.11605. Cited by: §A.4.2, §2.1.
- K. Deshpande, V. Sirdeshmukh, J. B. Mols, L. Jin, E. Hernandez-Cardona, D. Lee, J. Kritz, W. E. Primack, S. Yue, and C. Xing (2025) MultiChallenge: a realistic multi-turn conversation evaluation benchmark challenging to frontier llms. In Findings of the Association for Computational Linguistics: ACL 2025, pp. 18632–18702. Cited by: §A.4.3, §1, §4.1.
- Y. Dubois, B. Galambosi, P. Liang, and T. B. Hashimoto (2024) Length-controlled alpacaeval: a simple way to debias automatic evaluators. arXiv preprint arXiv:2404.04475. Cited by: §A.4.3.
- S. Han, H. Schoelkopf, Y. Zhao, Z. Qi, M. Riddell, W. Zhou, J. Coady, D. Peng, Y. Qiao, L. Benson, et al. (2022) Folio: natural language reasoning with first-order logic. arXiv preprint arXiv:2209.00840. Cited by: §A.4.3.
- Q. He, J. Zeng, Q. He, J. Liang, and Y. Xiao (2024) From complex to simple: enhancing multi-constraint complex instruction following ability of large language models. arXiv preprint arXiv:2404.15846. Cited by: §1.
- H. Huang, J. Liu, Y. He, S. Li, B. Xu, C. Zhu, M. Yang, and T. Zhao (2025) Musc: improving complex instruction following with multi-granularity self-contrastive training. arXiv preprint arXiv:2502.11541. Cited by: §1, §2.2.
- Y. Jiang, Y. Wang, X. Zeng, W. Zhong, L. Li, F. Mi, L. Shang, X. Jiang, Q. Liu, and W. Wang (2023) Followbench: a multi-level fine-grained constraints following benchmark for large language models. arXiv preprint arXiv:2310.20410. Cited by: §A.4.3, §4.1.
- A. Köpf, Y. Kilcher, D. von Rütte, S. Anagnostidis, Z. R. Tam, K. Stevens, A. Barhoum, D. Nguyen, O. Stanley, R. Nagyfi, et al. (2024) Openassistant conversations-democratizing large language model alignment. Advances in Neural Information Processing Systems 36. Cited by: §3.1.
- J. Li, L. Du, H. Zhao, B. Zhang, L. Wang, B. Gao, G. Liu, and Y. Lin (2025) Infinity instruct: scaling instruction selection and synthesis to enhance language models. arXiv preprint arXiv:2506.11116. Cited by: §3.1.
- K. Lu, Z. Chen, S. Fu, C. H. Yang, J. Balam, B. Ginsburg, Y. F. Wang, and H. Lee (2025) Developing instruction-following speech language model without speech instruction-tuning data. In ICASSP 2025-2025 IEEE International Conference on Acoustics, Speech and Signal Processing (ICASSP), pp. 1–5. Cited by: §1.
- MAA (2024) American invitational mathematics examination - aime. Note: Accessed in February 2024 External Links: Link Cited by: §A.4.3.
- MAA (2025) American invitational mathematics examination - aime. Note: Accessed in February 2025 External Links: Link Cited by: §A.4.3.
- H. Peng, Y. Qi, X. Wang, B. Xu, L. Hou, and J. Li (2025) VerIF: verification engineering for reinforcement learning in instruction following. arXiv preprint arXiv:2506.09942. Cited by: §A.4.2, §1, §2.2.
- Y. Qi, H. Peng, X. Wang, A. Xin, Y. Liu, B. Xu, L. Hou, and J. Li (2025) Agentif: benchmarking instruction following of large language models in agentic scenarios. arXiv preprint arXiv:2505.16944. Cited by: §A.4.3, §1, §4.1.
- Y. Qi, H. Peng, X. Wang, B. Xu, L. Hou, and J. Li (2024) Constraint back-translation improves complex instruction following of large language models. arXiv preprint arXiv:2410.24175. Cited by: §A.4.2, §2.2.
- Y. Qin, G. Li, Z. Li, Z. Xu, Y. Shi, Z. Lin, X. Cui, K. Li, and X. Sun (2025) Incentivizing reasoning for advanced instruction-following of large language models. arXiv preprint arXiv:2506.01413. Cited by: §A.4.2, §1, §2.1, §2.2.
- D. Rein, B. L. Hou, A. C. Stickland, J. Petty, R. Y. Pang, J. Dirani, J. Michael, and S. R. Bowman (2024) Gpqa: a graduate-level google-proof q&a benchmark. In First Conference on Language Modeling, Cited by: §A.4.3.
- Q. Ren, Q. He, B. Zhang, J. Zeng, J. Liang, Y. Xiao, W. Zhou, Z. Sun, and F. Yu (2025) Instructions are all you need: self-supervised reinforcement learning for instruction following. arXiv preprint arXiv:2510.14420. Cited by: §A.4.2, §3.2.
- Z. Shao, P. Wang, Q. Zhu, R. Xu, J. Song, X. Bi, H. Zhang, M. Zhang, Y. Li, Y. Wu, et al. (2024) Deepseekmath: pushing the limits of mathematical reasoning in open language models. arXiv preprint arXiv:2402.03300. Cited by: §3.2.
- H. Sun, L. Liu, J. Li, F. Wang, B. Dong, R. Lin, and R. Huang (2024) Conifer: improving complex constrained instruction-following ability of large language models. arXiv preprint arXiv:2404.02823. Cited by: §A.4.2, §1, §2.2.
- C. Wang, Y. Zhou, Q. Wang, Z. Wang, and K. Zhang (2025) Complexbench-edit: benchmarking complex instruction-driven image editing via compositional dependencies. In Proceedings of the 33rd ACM International Conference on Multimedia, pp. 13391–13397. Cited by: §1, §2.1.
- Y. Wang, Y. Kordi, S. Mishra, A. Liu, N. A. Smith, D. Khashabi, and H. Hajishirzi (2022a) Self-instruct: aligning language models with self-generated instructions. arXiv preprint arXiv:2212.10560. Cited by: §3.1.
- Y. Wang, S. Mishra, P. Alipoormolabashi, Y. Kordi, A. Mirzaei, A. Arunkumar, A. Ashok, A. S. Dhanasekaran, A. Naik, D. Stap, et al. (2022b) Super-naturalinstructions: generalization via declarative instructions on 1600+ nlp tasks. arXiv preprint arXiv:2204.07705. Cited by: §3.1.
- B. Wen, P. Ke, X. Gu, L. Wu, H. Huang, J. Zhou, W. Li, B. Hu, W. Gao, J. Xu, et al. (2024) Benchmarking complex instruction-following with multiple constraints composition. Advances in Neural Information Processing Systems 37, pp. 137610–137645. Cited by: §A.4.3, §1, §2.1, Figure 4, §4.1.
- Y. Wu, J. Mei, M. Yan, C. Li, S. Lai, Y. Ren, Z. Wang, J. Zhang, M. Wu, Q. Jin, et al. (2025) Writingbench: a comprehensive benchmark for generative writing. arXiv preprint arXiv:2503.05244. Cited by: §A.4.3, §4.1.
- S. Yao, H. Chen, A. W. Hanjie, R. Yang, and K. Narasimhan (2023) Collie: systematic construction of constrained text generation tasks. arXiv preprint arXiv:2307.08689. Cited by: §A.4.3, §4.1.
- J. Ye, C. Huang, Z. Chen, W. Fu, C. Yang, L. Yang, Y. Wu, P. Wang, M. Zhou, X. Yang, et al. (2025) A multi-dimensional constraint framework for evaluating and improving instruction following in large language models. arXiv preprint arXiv:2505.07591. Cited by: §1.
- J. Zhang, R. Xie, Y. Hou, X. Zhao, L. Lin, and J. Wen (2025) Recommendation as instruction following: a large language model empowered recommendation approach. ACM Transactions on Information Systems 43 (5), pp. 1–37. Cited by: §1.
- T. Zhang, C. Zhu, Y. Shen, W. Luo, Y. Zhang, H. Liang, F. Yang, M. Lin, Y. Qiao, W. Chen, et al. (2024) Cfbench: a comprehensive constraints-following benchmark for llms. arXiv preprint arXiv:2408.01122. Cited by: §A.4.3, Table 6, §4.1.
- L. Zheng, W. Chiang, Y. Sheng, S. Zhuang, Z. Wu, Y. Zhuang, Z. Lin, Z. Li, D. Li, E. Xing, et al. (2023) Judging llm-as-a-judge with mt-bench and chatbot arena. Advances in neural information processing systems 36, pp. 46595–46623. Cited by: §A.4.3.
- Y. Zheng, R. Zhang, J. Zhang, Y. Ye, Z. Luo, Z. Feng, and Y. Ma (2024) Llamafactory: unified efficient fine-tuning of 100+ language models. arXiv preprint arXiv:2403.13372. Cited by: §A.3.
- J. Zhou, T. Lu, S. Mishra, S. Brahma, S. Basu, Y. Luan, D. Zhou, and L. Hou (2023) Instruction-following evaluation for large language models. arXiv preprint arXiv:2311.07911. Cited by: §A.4.3, Table 5, §4.1.
Appendix A Appendix
A.1 Dataset
A.1.1 Constraint Types
As shown in Tab. 5 and Tab. 6, we distinguish between soft and hard constraints on LLM outputs. Soft constraints cannot be reliably verified by fixed symbolic rules, as they target high-level, often subjective properties such as semantic focus, tone and emotion, stylistic form, audience- or author-specific style, and syntactic patterns. In contrast, hard constraints are explicitly rule-checkable: they specify concrete requirements on keywords and their frequencies, lengths (in words, sentences, or paragraphs), detectable formats (e.g., numbered bullets, titles, JSON), presence of placeholders or postscripts, and strict start/end markers or punctuation usage. Together, these constraint types provide a comprehensive taxonomy for characterizing both high-level communicative behavior and strictly verifiable surface properties in our instruction formulations.
| Instruction Group | Instruction | Description |
| --- | --- | --- |
| Keywords | Include Keywords | Response must include specified keywords (e.g., {keyword1}, {keyword2}). |
| Keyword Frequency | A particular word should appear a certain number of times ({N} times). | |
| Forbidden Words | Prohibits the inclusion of specified keywords ({forbidden words}). | |
| Letter Frequency | Requires a specific letter to appear a certain number of times ({N} times). | |
| Response Language | Entire response must be in a specified language ({language}) and no other. | |
| Length Constraints | Number Paragraphs | Specifies the exact number of paragraphs ({N}), separated by markdown divider ***. |
| Number Words | Constraint on the number of words: “at least / around / at most {N} words ”. | |
| Number Sentences | Constraint on the number of sentences: “at least / around / at most {N} sentences ”. | |
| Number Paragraphs + First Word | Requires {N} paragraphs (separated by two line breaks), with the {i} -th paragraph starting with a specified word ({first_word}). | |
| Detectable Content | Postscript | Requires an explicit postscript at the end, starting with a specified marker ({postscript marker}). |
| Number Placeholder | Response must contain at least {N} placeholders in square brackets (e.g., [address]). | |
| Detectable Format | Number Bullets | Requires exactly {N} bullet points using markdown format (e.g., * This is a point.). |
| Title | Answer must include a title wrapped in double angular brackets (e.g., <<poem of joy>>). | |
| Choose From | Response must be one of the provided options ({options}). | |
| Minimum Number Highlighted Section | Requires at least {N} sections highlighted using markdown (e.g., *highlighted section*). | |
| Multiple Sections | Response must have {N} sections, with each section’s beginning marked by a splitter (e.g., {section_splitter} X). | |
| JSON Format | Entire output must be wrapped in JSON format. | |
| Combination | Repeat Prompt | First repeat the request without change, then provide the answer. |
| Two Responses | Requires two different responses, separated by six asterisk symbols (******). | |
| Change Cases | All Uppercase | Entire response must be in English, using only capital letters. |
| All Lowercase | Entire response must be in English, using only lowercase letters, with no capital letters allowed. | |
| Frequency of All-capital Words | Words with all capital letters should appear “at least / around / at most {N} times ”. | |
| Start with / End with | End Checker | Response must end with a specific phrase ({end_phrase}), with no other words following it. |
| Quotation | Entire response must be wrapped in double quotation marks. | |
| Punctuation | No Commas | Prohibits the use of any commas in the entire response. |
Table 5: Hard Constraint Types Zhou et al. (2023).
| Constraint Type | Definition | Example |
| --- | --- | --- |
| Lexical content constraint | Requires specific terms or symbols with precise placement. | “…must include the word ‘beautiful’.” |
| Element constraint | Requires inclusion of specific entities or scenarios. | “…highlights the Great Wall.” |
| Semantic constraint | Focuses on themes, tone, or stance. | “Write a poem about London.” |
| Word Count | Limits the number of words. | “A 50-word poem.” |
| Sentence Count | Limits the number of sentences. | “…three sentences.” |
| Paragraph Count | Limits the number of paragraphs. | “…divided into 3 sections.” |
| Document Count | Limits the number of documents. | “…list 3 articles.” |
| Tone and emotion | Conforms to specific emotional tone. | “Write a letter in an angry and sarcastic tone.” |
| Form and style | Uses specified stylistic form and perception. | “Write a passage in an encyclopedic style.” |
| Audience-specific | Tailored to a specific audience group. | “Write a poem for a 6-year-old.” |
| Authorial style | Emulates specific authors’ styles. | “Write a passage in the style of Shakespeare.” |
| Fundamental format | Follows standard formats like JSON, HTML, etc. | “Output in JSON format.” |
| Bespoke format | Uses custom formatting protocols. | “Bold the main idea and output in unordered list.” |
| Specialized format | Tailored for specific applications or domains. | “Convert to electronic medical record format.” |
| Pragmatic constraint | Adapts to context like dialects or language policy. | “Output in English, classical Chinese, etc.” |
| Syntactic constraint | Follows specific phrase and clause structures. | “Use imperatives with nouns and verb phrases.” |
| Morphological constraint | Controls affixes, roots, and word formation. | “Output all content in lowercase English.” |
| Phonological constraint | Focuses on sounds, tone, and intonation. | “Single-syllable tongue twisters.” |
| Role-based constraint | Responds with specific role identity. | “You are Confucius, how do you decide?” |
| Task-specific constraint | Addresses a defined situational task. | “Work from home, how to report?” |
| Complex context constraint | Involves multi-faceted and nested reasoning. | “On the left, 10 total, what to do?” |
| Example constraint | Conforms to patterns from example pairs. | “input:x…, output:{…}; input:y…, output?” |
| Inverse constraint | Narrows response space via exclusions. | “No responses about political topics.” |
| Contradictory constraint | Combines requirements that are hard to satisfy simultaneously. | “A five-character quotation, 1000 words.” |
| Rule constraint | Follows symbolic or logical operation rules. | “Each answer adds 1+1=3, then 2+2=5.” |
Table 6: Soft Constraint Types Zhang et al. (2024).
/* Task Description */ 1. I currently have a seed question, but the seed questions are relatively simple. To make the instructions more complex, I want you to identify and return three composition constraints that can be added to the seed question. 2. I will provide [Seed Question] and [Constraint References], and you can use these references to propose the composition constraint that would increase the difficulty of the seed question. 3. You may choose one or more constraints from the [Constraint References] list, and combine them using the following composition rules. 4. Do not modify or rewrite the seed question. Your task is only to generate the new composite constraint that can be added to it. 5. Return the added constraint(s) in the JSON format described below, including all sub-constraints and their logical composition types. 6. Do not return anything else. No explanation, no reformulated question, no analysis—only the JSON structure. /* Logical Composition Types */ And: The output is required to satisfy multiple constraints simultaneously. Template: C1 and C2 and C3. Example: summarize the news in bullet points and within 100 words. Chain: The output is required to complete multiple tasks sequentially, each with its own constraints. Template: first C1, then C2, finally C3. Example: introduce “Mona Lisa”: year of creation, then background, then impact. Selection: The output is required to select different branches according to conditions, fulfilling the constraints of the corresponding branch. Template: if C1 then C2 otherwise C3. Example: if the painting has an animal, describe it in Chinese; otherwise, give year, background, and impact. /* JSON Output Format */ Return { "composite_constraints": [ ... ] } where each element contains a "composite_constraint" with fields "type": "<And/Chain/Selection>" and "sub_constraints" ("c1", "c2, "c3") each holding a "constraint" string that specifies one atomic constraint. /* Constraint References*/ 1. Lexical content constraint: must include specific terms or symbols with precise placement. 2. Element constraint: include specific entities or scenarios. 3. Semantic constraint: focus on themes, tone, or stance. 4. Word Count: limit the number of words. 5. Sentence Count: limit the number of sentences. 6. Paragraph Count: limit the number of paragraphs. 7. Document Count: limit the number of documents. 8. Tone and emotion: conform to specific emotional tone. 9. Form and style: use specified stylistic form and perception. 10. Audience-specific: tailored to a specific audience group. 11. Authorial style: emulate specific authors’ styles. 12. Fundamental format: follow standard formats like JSON, HTML, etc. 13. Bespoke format: use custom formatting protocols. 14. Specialized format: tailored for specific applications or domains. 15. Pragmatic constraint: adapt to context like dialects or language policy. 16. Syntactic constraint: follow specific phrase and clause structures. 17. Morphological constraint: control over affixes, roots, and word formation. 18. Phonological constraint: focus on sounds, tone, and intonation. 19. Role-based constraint: respond with specific role identity. 20. Task-specific constraint: address a defined situational task. 21. Complex context constraint: involve multi-faceted and nested reasoning. 22. Example constraint: conform to patterns from example pairs. 23. Inverse constraint: narrow response space via exclusions. 24. Contradictory constraint: combine requirements that are hard to satisfy simultaneously. 25. Rule constraint: follow symbolic or logical operation rules. /* Seed Question */ [Seed Question]: {} /* Modified Question */ [Modified Question]: (the seed question plus one of the generated composite constraints).
Table 7: Prompt template for constructing logically structured multi-constraint instructions.
A.1.2 Prompt for constructing logically structured multi-constraint instructions
As shown in Tab. 7, the template takes a seed question and a reference list of 25 constraint types. The model selects atomic constraints and combines them using three logical composition types (And, Chain, Selection): And requires satisfying multiple constraints simultaneously, Chain requires sequential task completion, and Selection requires conditional branch selection. The model generates three composite constraints in JSON format, each specifying its composition type and sub-constraints. These constraints are added to the seed question to form complex multi-constraint instructions.
A.2 Reward Model Training
We fine-tune Qwen2.5-7B-Instruct for a binary classification task to determine whether a response satisfies a given constraint. Training data consists of response-constraint pairs. Each sample is tokenized by concatenating the response and constraint into a single text sequence. We use full-parameter fine-tuning (not LoRA) with the HuggingFace Trainer framework. Training hyperparameters: learning rate 5e-6, batch size 1 per device, gradient accumulation steps 1, 3 epochs, FP16 precision, gradient checkpointing enabled, and DeepSpeed optimization configured via JSON. We use accuracy as the evaluation metric, computed by comparing predicted labels with ground truth labels. The training is performed on 8 NVIDIA H200 GPUs.
A.3 SFT Training
We perform supervised fine-tuning (SFT) on six models: Qwen2.5-1.5B-Instruct, Qwen2.5-7B-Instruct, Llama-3.1-8B-Instruct, Distill-Qwen-7B, Distill-Qwen-14B, and Qwen3-8B. The training is performed on 8 NVIDIA H200 GPUs. The training data consists of instruction-response pairs where responses are generated by the teacher model GPT-4.1. Training is conducted using LLaMA-Factory Zheng et al. (2024) with LoRA fine-tuning (rank=8, targeting all linear layers). We use a maximum sequence length of 20480 tokens, and employ 16 preprocessing workers and 4 dataloader workers. Training hyperparameters include: batch size of 1 per device with gradient accumulation of 8 steps, learning rate of 1.0e-4, 3 training epochs, cosine learning rate scheduler with 10% warmup ratio, and bfloat16 precision. Model-specific templates are applied according to each model’s architecture.
A.4 RL Training
A.4.1 Implementation Details
We apply GRPO training using the VeRL framework. Training is conducted on 8 NVIDIA H200 GPUs. Maximum prompt length is 2048 tokens, and maximum response length is 8192 tokens. The rollout batch size is set to 384, and data is shuffled with a random seed of 1. The algorithm employs the GRPO advantage estimator with KL penalty enabled. We use a low-variance KL penalty formulation with a coefficient of 1.0e-2. Training batches are organized with a global batch size of 96, micro-batches of size 4 per device for updates, and micro-batches of size 8 per device for experience generation. Gradient clipping is applied with a max norm of 1.0. The optimizer uses a learning rate of 1.0e-6 with a weight decay of 1.0e-2, and no learning rate warm-up. We leverage FSDP with full sharding enabled. For rollouts, we generate responses with a temperature of 1.0 and a group size of 5. Tensor parallelism of size 2 is applied. The maximum number of batched tokens is set to 16000. Different models are trained for varying numbers of epochs: Qwen2.5-7B-Instruct, Llama-3.1-8B-Instruct and Distill-Qwen-14B are trained for 1 epoch; Distill-Qwen-7B and Qwen2.5-1.5B-Instruct are trained for 5 epochs; and Qwen3-8B is trained for 4 epochs. For the sequential rewards, we set the decay coefficient $\gamma$ to $0.5$ , which represents a moderate penalty propagation strength. With $\gamma=0.5$ , each failed earlier step reduces the effective reward of subsequent steps by half, encouraging correct early decisions while still allowing partial credit for later successes. Empirically, this choice provides stable training dynamics and avoids overly aggressive reward suppression observed with smaller $\gamma$ values.
A.4.2 Baselines
RAIF-7B Qin et al. (2025): RAIF-7B (Incentivizing Reasoning) proposes a systematic approach to enhance large language models’ ability to handle complex instructions by incentivizing reasoning processes during test-time computation scaling. The method encourages models to engage in explicit reasoning steps when processing complex instructions, thereby improving instruction-following performance through enhanced computational reasoning capabilities.
Conifer-7B-DPO Sun et al. (2024): Conifer addresses complex constrained instruction-following through a two-stage training pipeline. The method first constructs a curriculum dataset organized from simple to complex instructions and performs supervised fine-tuning (SFT) on this dataset. Subsequently, it applies Direct Preference Optimization (DPO) training using an open-source preference dataset to further refine the model’s ability to follow complex constraints.
Crab-7B-DPO Qi et al. (2024): Crab employs a constraint back-translation strategy to improve complex instruction following. The method leverages Llama3-70B-Instruct as a strong teacher model to back-translate constraints into high-quality instruction-response pairs. This process creates a comprehensive dataset with complex constraints, which is then used for DPO training to enhance the model’s instruction-following capabilities.
SPAR-8B-DPO Cheng et al. (2024): SPAR (Self-play with tree-search refinement) introduces a self-play framework that integrates tree-search-based self-refinement mechanisms. The framework enables an LLM to play against itself, employing tree-search strategies to iteratively refine responses with respect to given instructions. This approach generates valid and comparable preference pairs while minimizing unnecessary variations, facilitating effective DPO training for instruction-following tasks.
VERIF Peng et al. (2025): VERIF (Verification Engineering for Reinforcement Learning) combines multiple verification approaches to enhance instruction following through reinforcement learning. The method integrates rule-based code verification with LLM-based verification from large reasoning models (RLVR), providing comprehensive verification signals that guide the reinforcement learning process toward better instruction-following performance.
Self-Supervised-7B Ren et al. (2025): Self-Supervised-7B presents a self-supervised reinforcement learning framework for instruction following that eliminates the need for external supervision. The method extracts reward signals directly from instructions and generates pseudo-labels for reward model training, thereby removing dependencies on human-annotated preference data. The framework introduces constraint decomposition strategies and efficient constraint-level binary classification methods to address sparse reward problems while maintaining computational efficiency. Experimental results demonstrate significant performance improvements across multiple datasets, including complex agentic tasks and multi-turn instruction-following scenarios.
A.4.3 Benchmarks
We evaluate instruction-following ability on various benchmarks:
IFEval Zhou et al. (2023): IFEval (Instruction-Following Evaluation) focuses on verifiable instructions that can be automatically checked for compliance. The benchmark includes instructions such as "write in more than 400 words" and "mention the keyword of AI at least 3 times", covering 25 distinct types of verifiable instructions across approximately 500 prompts. Each prompt may contain one or more verifiable instructions, enabling systematic evaluation of models’ ability to follow explicit, rule-based constraints.
CFBench Zhang et al. (2024): CFBench (Comprehensive Constraints Following Benchmark) is a large-scale benchmark featuring 1,000 carefully curated samples that span more than 200 real-life scenarios and over 50 natural language processing tasks. The benchmark systematically compiles constraints from real-world instructions and establishes a comprehensive framework for constraint categorization, including 10 primary categories and over 25 subcategories. Each constraint is seamlessly integrated within instructions to reflect realistic usage scenarios.
FollowBench Jiang et al. (2023): FollowBench provides a comprehensive evaluation framework covering five distinct types of fine-grained constraints: Content, Situation, Style, Format, and Example. To enable precise constraint-following assessment across varying difficulty levels, the benchmark introduces a multi-level mechanism that incrementally adds a single constraint to the initial instruction at each increased level, allowing for granular analysis of model performance.
ComplexBench Wen et al. (2024): ComplexBench is designed to comprehensively evaluate LLMs’ ability to follow complex instructions composed of multiple constraints. The benchmark proposes a hierarchical taxonomy for complex instructions, encompassing 4 constraint types, 19 constraint dimensions, and 4 composition types. It includes a manually collected high-quality dataset that systematically covers various constraint combinations and logical structures.
WritingBench Wu et al. (2025): WritingBench is a comprehensive benchmark designed to evaluate LLMs across diverse writing domains. The benchmark covers 6 core writing domains and 100 subdomains, encompassing creative, persuasive, informative, and technical writing. It provides systematic evaluation of models’ ability to generate high-quality written content that adheres to various stylistic and content requirements.
Collie Yao et al. (2023): Collie (Constrained Language Generation) employs a grammar-based framework that enables the specification of rich, compositional constraints across multiple generation levels, including word, sentence, paragraph, and passage levels. The benchmark encompasses diverse modeling challenges such as language understanding, logical reasoning, counting, and semantic planning, providing a systematic approach to evaluating constraint-following capabilities.
AgentIF Qi et al. (2025): AgentIF is the first benchmark specifically designed for systematically evaluating LLM instruction-following ability in agentic scenarios. The benchmark features three key characteristics: (1) Realistic: constructed from 50 real-world agentic applications; (2) Long: averaging 1,723 words with a maximum of 15,630 words; (3) Complex: averaging 11.9 constraints per instruction, covering diverse constraint types including tool specifications and condition constraints.
MultiChallenge Deshpande et al. (2025): MultiChallenge is a pioneering benchmark evaluating large language models on conducting multi-turn conversations with human users, a crucial yet underexamined capability. The benchmark identifies four categories of challenges in multi-turn conversations that are both common in real-world human-LLM interactions and challenging to current frontier LLMs. All four challenge categories require accurate instruction-following, context allocation, and in-context reasoning simultaneously.
We assess general reasoning and knowledge capabilities with the following datasets:
GPQA-Diamond Rein et al. (2024): GPQA-Diamond is a specialized subset of the GPQA (Graduate-Level Google-Proof Q&A) benchmark, comprising 198 meticulously crafted multiple-choice questions across biology, chemistry, and physics. These questions are designed to be exceptionally challenging, requiring domain expertise that makes them a rigorous test for AI models’ scientific knowledge and reasoning capabilities.
AIME2024 MAA (2024) and AIME2025 MAA (2025): The AIME (American Invitational Mathematics Examination) datasets consist of problems from the 2024 and 2025 AIME competitions, respectively. These datasets are commonly used to evaluate the mathematical reasoning ability of large language models. The AIME is a prestigious mathematics competition for high school students in the United States, and its problems require sophisticated mathematical reasoning and problem-solving skills.
FOLIO Han et al. (2022): FOLIO (First-Order Logic Inference Over Text) is a benchmark dataset developed to assess the logical reasoning capabilities of large language models. It consists of human-annotated examples that require deductive reasoning grounded in first-order logic (FOL). The benchmark evaluates models’ ability to perform formal logical inference over natural language text, bridging natural language understanding and formal reasoning.
Enigmata Chen et al. (2025): Enigmata is a comprehensive suite designed to enhance logical reasoning capabilities of large language models. The benchmark comprises 36 tasks distributed across seven categories, with each task equipped with generators that can produce infinite examples and rule-based verifiers. This generator-verifier design supports scalable multi-task reinforcement learning training, fine-grained analysis, and seamless integration with reinforcement learning with verifiable rewards (RLVR). Models trained on Enigmata demonstrate strong performance across multiple puzzle reasoning benchmarks and exhibit good generalization to advanced mathematical and STEM reasoning tasks.
MT-Bench Zheng et al. (2023): MT-Bench (Multi-Turn Benchmark) is an evaluation framework designed to assess chat assistants’ performance in multi-turn conversations. The benchmark contains 80 high-quality multi-turn open-ended questions covering diverse topics such as writing, role-playing, mathematics, and coding. Model responses are scored by GPT-4, providing direct scores without requiring pairwise comparisons. MT-Bench enables systematic evaluation of models’ conversational abilities and their capacity to maintain context and coherence across multiple interaction turns.
AlpacaEval 2.0 Dubois et al. (2024): AlpacaEval 2.0 is an automated evaluation benchmark designed to assess instruction-following capabilities of language models. The benchmark leverages GPT-4 as an automated annotator to compare model-generated responses with reference outputs, evaluating how well models adhere to user instructions. The benchmark is characterized by its efficiency, low cost, and reliability, enabling rapid assessment of model performance. AlpacaEval 2.0 provides a standardized evaluation protocol for comparing instruction-following models across diverse tasks and scenarios.
A.4.4 Case Study
Tab. 8 illustrates the model’s transformation in constraint-aware reasoning and output generation. Before training, the model’s reasoning process shows awareness of constraints (e.g., "Let me make sure it’s clear without commas") but fails to translate this awareness into compliant output: the generated riddle contains commas and uses keywords inappropriately (e.g., "afternoon embroidered" rather than natural keyword integration). The constraint compliance is [False, False]. After training, the model’s reasoning becomes more systematic, explicitly planning constraint satisfaction (e.g., "I’ll have to structure the sentences carefully to avoid [commas]") and naturally incorporating keywords. This improved reasoning directly translates to compliant output: the riddle contains no commas and integrates both keywords naturally. The constraint compliance improves to [True, True], demonstrating effective alignment between reasoning and constraint satisfaction.
| Case | Content |
| --- | --- |
| Before Training | Input: Write a riddle about embroidery that has the answer "needle". Include keywords ’afternoon’ and ’distressed’ in the response. Don’t use any commas in your answer. Think: Alright, I need to create a riddle about embroidery where the answer is "needle." The riddle should include the keywords ’afternoon’ and ’distressed.’ Let me break this down. First, I’ll think about what embroidery entails. Embroidery involves stitching, so maybe using words like "stitch," "needle," or "cloth." Since the answer is "needle," I need to hint at it without stating it directly. For ’afternoon,’ perhaps I can use something related to the time of day, like "quietly" or "evening," but in a way that ties into embroidery. Maybe "afternoon" can relate to when someone is stitching, so "quietly" could work, as it’s a gentle activity. ’Distressed’ can be tricky. Maybe I can imply it through the feeling of the fabric or the process. Perhaps something like "snag" or "torn," but I need to tie it back to embroidery. Maybe the needle moves too fast, causing something to snag, making the work look distressed. Putting it together, I want a riddle that flows naturally. Let me try: "What does an afternoon embroidered with a needle bring?" Hmm, that’s close. Maybe tweak it to add the distressed element. Wait, "What does an afternoon embroidered with a needle bring?" The answer is "a needle," but maybe I can add a clue about the distress. So, "What does an afternoon embroidered with a needle bring? A stitched, but maybe a little snag, a sewing that’s a bit hurried, so a small, worried look." That uses ’afternoon’ as ’embroidered’ and ’needle’ as the answer. The ’distressed’ part is hinted at by ’snag’ and ’hurried,’ which can make someone worried about the work. I think that works. Let me make sure it’s clear without commas. The response is: "What does an afternoon embroidered with a needle bring? A stitched, but maybe a little snag, a sewing that’s a bit hurried, so a small, worried look." That includes both keywords and hints at the needle being the answer. </think> Output: What does an afternoon embroidered with a needle bring? A stitched, but maybe a little snag, a sewing that’s a bit hurried, so a small, worried look. Constraint Compliance: [False, False] |
| After Training | Input: Write a riddle about embroidery that has the answer "needle". Include keywords ’afternoon’ and ’distressed’ in the response. Don’t use any commas in your answer. Think: Alright, I need to help the user create a riddle about embroidery with the answer "needle." They specifically want me to include the keywords ’afternoon’ and ’distressed.’ Hmm, let me break this down. First, I should understand what a riddle entails. It’s a question or statement that requires thinking to solve, often with a clever twist. Since the answer is "needle," I need to think about how to incorporate that into a riddle. The user mentioned not using any commas, so I’ll have to structure the sentences carefully to avoid that. Let me start brainstorming some ideas. Embroidery is about stitching, so maybe I can relate ’needle’ to the tool used. Including ’afternoon’… perhaps something about the time of day. Maybe the needle is used in the afternoon? Or the result of using it in the afternoon. ’Distressed’ could relate to something that’s been repaired or fixed, like a hole that’s been mended. Putting it together, I think of the process of sewing. If someone is sewing in the afternoon and notices a hole, they might use a needle. So, maybe the riddle is about something that’s fixed in the afternoon with a needle. That way, the keyword ’distressed’ can describe the hole that’s being mended. So, the riddle could go like: "What is used in the afternoon to mend a hole that’s been distressed?" The answer would be the needle. Let me make sure it flows without commas and makes sense. Yes, that should work. I’ll present it as a riddle, so it’s a question that leads to the answer with the given keywords. </think> Output: What do you use in the afternoon to mend a hole that’s been distressed? The answer is a needle. Constraint Compliance: [True, True] |
Table 8: Comparison of the outputs of R1-Distill-Qwen-7B before and after training for the instruction in IFEval.
<details>
<summary>figures/files/qwen-7b-reward.png Details</summary>
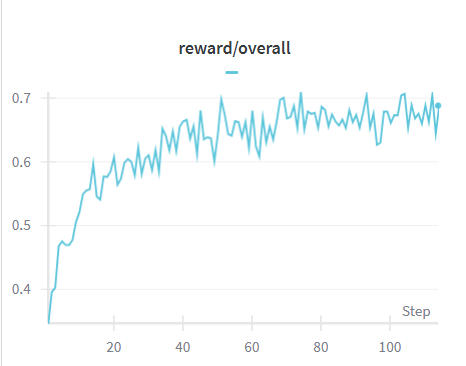
### Visual Description
\n
## Line Chart: Reward Over Time
### Overview
The image displays a line chart illustrating the 'reward/overall' metric over 'Step'. The chart shows a generally increasing trend with fluctuations, indicating a learning or optimization process where the reward improves over time, but not monotonically.
### Components/Axes
* **Title:** reward/overall
* **X-axis:** Step (ranging from approximately 0 to 100)
* **Y-axis:** Reward (ranging from approximately 0.4 to 0.7)
* **Data Series:** A single teal-colored line representing the 'reward/overall' value.
### Detailed Analysis
The line representing 'reward/overall' starts at approximately 0.4 at Step 0. It exhibits a steep upward slope until around Step 10, reaching a value of approximately 0.55. From Step 10 to Step 40, the line fluctuates, generally trending upwards, reaching a peak of around 0.68 at Step 30. Between Step 40 and Step 60, the line experiences more pronounced fluctuations, oscillating between approximately 0.65 and 0.72. From Step 60 to Step 100, the line continues to fluctuate, with a slight downward trend, ending at approximately 0.69 at Step 100.
Here's a breakdown of approximate data points:
* Step 0: Reward ≈ 0.4
* Step 10: Reward ≈ 0.55
* Step 20: Reward ≈ 0.62
* Step 30: Reward ≈ 0.68
* Step 40: Reward ≈ 0.66
* Step 50: Reward ≈ 0.70
* Step 60: Reward ≈ 0.65
* Step 70: Reward ≈ 0.71
* Step 80: Reward ≈ 0.67
* Step 90: Reward ≈ 0.69
* Step 100: Reward ≈ 0.69
### Key Observations
* The reward initially increases rapidly, suggesting quick learning or adaptation.
* The fluctuations after Step 10 indicate a more complex learning process, potentially encountering challenges or exploring different strategies.
* The overall trend is positive, indicating that the system is generally improving its reward over time.
* There is a slight plateau or even a minor decrease in reward towards the end of the observed steps (between 80 and 100).
### Interpretation
The chart likely represents the performance of a reinforcement learning agent or an optimization algorithm. The 'Step' axis represents the iteration or time step, and the 'reward/overall' axis represents the cumulative reward obtained by the agent. The initial rapid increase suggests that the agent quickly learns the basic principles of the environment. The subsequent fluctuations indicate that the agent is exploring more complex strategies or encountering more challenging scenarios. The slight decrease in reward towards the end could indicate that the agent has reached a local optimum or is experiencing diminishing returns. Further investigation would be needed to determine the cause of this plateau and whether further optimization is possible. The data suggests a successful learning process, but with potential for further improvement.
</details>
(a) Reward Dynamics of Qwen2.5-7B-Instruct.
<details>
<summary>figures/files/qwen-7b-length.png Details</summary>
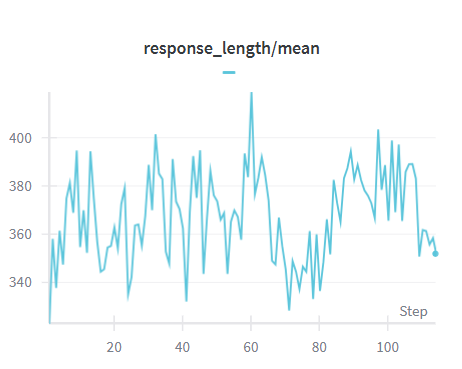
### Visual Description
\n
## Line Chart: Response Length / Mean
### Overview
The image presents a line chart illustrating the relationship between 'response_length' and 'mean' over a series of 'Steps'. The chart displays a fluctuating trend, with the response length varying around a central mean value.
### Components/Axes
* **X-axis:** Labeled "Step", ranging from approximately 0 to 100. The axis has tick marks at intervals of 10.
* **Y-axis:** No explicit label, but the title "response\_length/mean" suggests it represents the ratio of response length to the mean. The scale ranges from approximately 340 to 420, with tick marks at intervals of 20.
* **Data Series:** A single blue line representing the 'response_length/mean' value.
* **Title:** "response\_length/mean" positioned at the top-center of the chart.
### Detailed Analysis
The blue line exhibits a highly variable pattern.
* **Initial Trend (Step 0-20):** The line generally slopes upward, starting at approximately 350 and reaching a peak around 390 at Step 20.
* **Fluctuation (Step 20-60):** The line fluctuates significantly between approximately 360 and 400, with several peaks and troughs. A prominent peak occurs around Step 60, reaching a value of approximately 415.
* **Decline (Step 60-80):** After the peak at Step 60, the line declines to a low point of approximately 345 around Step 80.
* **Final Trend (Step 80-100):** The line shows an upward trend again, fluctuating between approximately 360 and 390, ending at around 355 at Step 100.
Approximate data points (read from the chart):
* Step 0: ~350
* Step 10: ~370
* Step 20: ~390
* Step 30: ~380
* Step 40: ~395
* Step 50: ~375
* Step 60: ~415
* Step 70: ~360
* Step 80: ~345
* Step 90: ~370
* Step 100: ~355
### Key Observations
* The response length/mean ratio is highly dynamic, with substantial fluctuations throughout the observed steps.
* The highest value occurs around Step 60, indicating a peak in response length relative to the mean at that point.
* The lowest value occurs around Step 80, suggesting a dip in response length relative to the mean.
* There is no clear overall trend (upward or downward) over the entire range of steps.
### Interpretation
The chart suggests that the response length, relative to its mean, is not stable and varies considerably as the 'Step' progresses. This could indicate a changing pattern in the data being processed, or a dynamic system where the response length is influenced by multiple factors. The peak at Step 60 and the trough at Step 80 might correspond to specific events or conditions within the system. The absence of a clear overall trend suggests that the system is not consistently increasing or decreasing in response length relative to the mean. Further investigation would be needed to understand the underlying causes of these fluctuations and the significance of the observed peaks and troughs. The chart provides a visual representation of the variability in the response length/mean ratio, which could be useful for monitoring system performance or identifying potential anomalies.
</details>
(b) Response Length Dynamics of Qwen2.5-7B-Instruct.
<details>
<summary>figures/files/distill-7b-reward.png Details</summary>
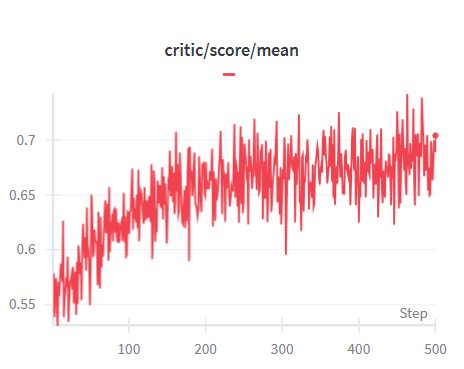
### Visual Description
\n
## Line Chart: Critic Score Mean Over Steps
### Overview
The image displays a line chart illustrating the trend of the mean critic score over a series of steps. The chart shows a generally increasing trend with significant fluctuations.
### Components/Axes
* **Title:** "critic/score/mean" positioned at the top-center of the chart. A horizontal line is present below the title.
* **X-axis:** Labeled "Step" at the bottom-right. The scale ranges from approximately 0 to 500, with tick marks at intervals of 100.
* **Y-axis:** The left side of the chart represents the Y-axis, with a scale ranging from approximately 0.55 to 0.72, with tick marks at intervals of 0.05.
* **Data Series:** A single red line representing the "critic/score/mean".
* **Legend:** There is no explicit legend, but the line color (red) is associated with the title "critic/score/mean".
### Detailed Analysis
The red line representing the critic score mean starts at approximately 0.55 at Step 0 and generally increases, reaching a peak of approximately 0.72 around Step 450. The line exhibits substantial volatility throughout the entire range.
Here's a breakdown of approximate values at specific steps:
* Step 50: Approximately 0.58
* Step 100: Approximately 0.62
* Step 150: Approximately 0.65
* Step 200: Approximately 0.67
* Step 250: Approximately 0.68
* Step 300: Approximately 0.69
* Step 350: Approximately 0.70
* Step 400: Approximately 0.70
* Step 450: Approximately 0.72
* Step 500: Approximately 0.68
The trend is generally upward, but with frequent and significant dips and peaks. The line appears to plateau between steps 350 and 400 before a final increase and subsequent decrease.
### Key Observations
* The critic score mean demonstrates a clear upward trend over the 500 steps.
* The volatility is high, indicating substantial fluctuations in the critic score.
* There is a period of relative stability between steps 350 and 400.
* The final value at Step 500 is lower than the peak at Step 450, suggesting a recent decline.
### Interpretation
The chart suggests that the critic score, on average, improves over time (as measured by "Step"). However, the large fluctuations indicate that individual critic scores vary considerably. The plateau around steps 350-400 could represent a period of consolidation or diminishing returns in score improvement. The final dip at Step 500 might indicate a recent negative event or change in the evaluated subject. The "Step" variable is not defined, but it likely represents a progression of some kind – perhaps iterations of a process, time intervals, or stages of development. The data suggests a learning curve or improvement process, but one that is not smooth or predictable. The high volatility could be due to inherent subjectivity in critic evaluations, external factors influencing scores, or the nature of the subject being evaluated.
</details>
(c) Reward Dynamics of Distill-Qwen-7B.
<details>
<summary>figures/files/distill-7b-length.png Details</summary>
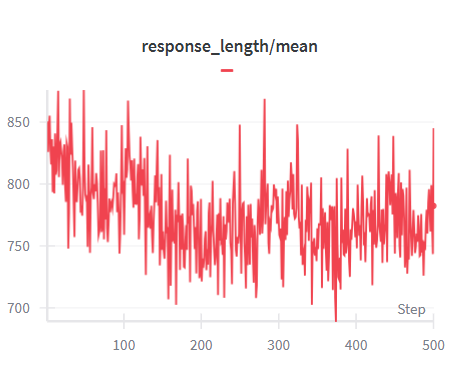
### Visual Description
\n
## Line Chart: Response Length / Mean
### Overview
The image presents a line chart illustrating the relationship between "response_length" and "mean" over a series of "Steps". The chart displays a fluctuating line, indicating changes in response length relative to the mean as the step number increases.
### Components/Axes
* **Title:** "response\_length/mean" positioned at the top-center of the chart.
* **X-axis:** Labeled "Step", ranging from approximately 0 to 500. The axis is linear.
* **Y-axis:** The scale ranges from approximately 700 to 850. The axis represents the value of "response\_length/mean".
* **Data Series:** A single line, colored red, representing the "response\_length/mean" values.
* **Gridlines:** Horizontal gridlines are present to aid in reading values.
### Detailed Analysis
The red line representing "response\_length/mean" begins at approximately 840 at Step 0. The line generally slopes downward from Step 0 to approximately Step 300, with significant fluctuations. From Step 300 to Step 500, the line continues to fluctuate, but appears to stabilize around a value of approximately 770-790.
Here's a breakdown of approximate values at specific steps:
* Step 0: ~840
* Step 50: ~820
* Step 100: ~800
* Step 150: ~790
* Step 200: ~770
* Step 250: ~750
* Step 300: ~740
* Step 350: ~760
* Step 400: ~770
* Step 450: ~780
* Step 500: ~785
The line exhibits high volatility throughout the entire range of steps, with frequent peaks and troughs. The amplitude of these fluctuations appears to decrease slightly after Step 300, but remains substantial.
### Key Observations
* **Downward Trend:** There is a general downward trend in "response\_length/mean" from Step 0 to Step 300.
* **Stabilization:** After Step 300, the line appears to stabilize, fluctuating within a narrower range.
* **High Volatility:** The data exhibits significant volatility throughout the entire range of steps.
* **No Clear Cyclicity:** While there are fluctuations, there is no immediately obvious cyclical pattern.
### Interpretation
The chart suggests that the average response length, relative to some mean value, decreases over the first 300 steps. After this initial decrease, the response length stabilizes, but continues to fluctuate. The high volatility indicates that the response length is sensitive to changes at each step.
The initial decrease could be due to a learning process, where the system is becoming more efficient at generating responses. The stabilization after Step 300 could indicate that the system has reached a steady state. The continued fluctuations suggest that there are still factors influencing the response length, even after the system has stabilized.
Without further context, it is difficult to determine the specific meaning of "response\_length" and "Step". However, the chart provides valuable insights into the behavior of the system over time. It would be useful to investigate the factors that contribute to the volatility and to understand why the response length decreases initially.
</details>
(d) Response Length Dynamics of Distill-Qwen-7B.
<details>
<summary>figures/files/distill-14b-reward.png Details</summary>
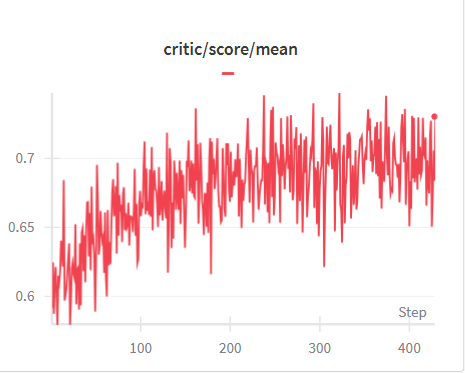
### Visual Description
\n
## Line Chart: Critic Score Mean Over Steps
### Overview
The image displays a line chart illustrating the mean critic score over a series of steps. The chart shows a fluctuating trend, generally increasing over time, with significant volatility.
### Components/Axes
* **Title:** "critic/score/mean" with a horizontal line underneath.
* **X-axis:** Labeled "Step". The scale ranges from approximately 0 to 450, with tick marks at 0, 100, 200, 300, and 400.
* **Y-axis:** No explicit label, but represents the mean critic score. The scale ranges from approximately 0.60 to 0.75, with tick marks at 0.60, 0.65, 0.70, and 0.75.
* **Data Series:** A single red line representing the mean critic score.
### Detailed Analysis
The red line begins at approximately 0.61 at Step 0. The line generally trends upwards, but with substantial fluctuations.
* **0-100 Steps:** The line exhibits high volatility, increasing from 0.61 to approximately 0.68.
* **100-200 Steps:** The line continues to increase, reaching a peak of around 0.72 at Step 150, then fluctuating between 0.68 and 0.72.
* **200-300 Steps:** The line remains volatile, oscillating between approximately 0.66 and 0.73.
* **300-400 Steps:** The line shows a slight upward trend, with fluctuations between 0.68 and 0.74.
* **400-450 Steps:** The line increases to a final value of approximately 0.74.
It's difficult to provide precise values due to the density of the line and the lack of a grid. The values are approximate based on visual estimation.
### Key Observations
* The mean critic score generally increases over the 450 steps.
* The score is highly volatile, with frequent and significant fluctuations.
* There are no clear, sustained periods of increase or decrease, only oscillations around an upward trend.
* The final score at Step 450 is approximately 0.74, significantly higher than the initial score at Step 0.
### Interpretation
The chart suggests that the critic score, while fluctuating, is generally improving over time. The high volatility indicates that the score is sensitive to changes or events occurring at each step. The upward trend suggests a positive overall trajectory, but the fluctuations imply that the improvement is not consistent. This could represent a learning process, where initial scores are lower and more variable, but gradually converge towards a higher mean as the process matures. The data does not provide information about *why* the score is changing, only *that* it is changing. Further investigation would be needed to understand the factors driving the fluctuations and the overall trend.
</details>
(e) Reward Dynamics of Distill-Qwen-14B.
<details>
<summary>figures/files/distill-14b-length.png Details</summary>
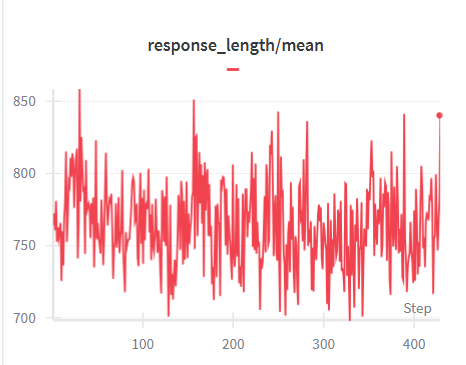
### Visual Description
\n
## Line Chart: Response Length / Mean
### Overview
The image displays a line chart illustrating the relationship between "response_length" and "mean" over a series of "Steps". The chart shows a fluctuating line, indicating variations in response length relative to the mean.
### Components/Axes
* **Title:** "response\_length/mean" positioned at the top-center of the chart.
* **X-axis:** Labeled "Step", ranging from approximately 0 to 400. The axis is divided into increments of 100.
* **Y-axis:** Ranges from approximately 700 to 850. The scale is linear, with increments of approximately 50.
* **Data Series:** A single line, colored red, representing the "response\_length/mean" values.
### Detailed Analysis
The red line exhibits a highly volatile pattern.
* **Initial Trend (Step 0-100):** The line starts at approximately 820 and generally declines, with significant fluctuations, reaching a low point around 730 at Step 50.
* **Mid-Range Trend (Step 100-300):** The line oscillates between approximately 730 and 840, with frequent peaks and troughs. There is no clear upward or downward trend during this period.
* **Final Trend (Step 300-400):** The line remains volatile, but shows a slight upward trend, culminating in a peak of approximately 845 at Step 400.
Approximate data points (readings are approximate due to the chart's resolution):
* Step 0: ~820
* Step 50: ~730
* Step 100: ~780
* Step 150: ~830
* Step 200: ~750
* Step 250: ~800
* Step 300: ~770
* Step 350: ~810
* Step 400: ~845
### Key Observations
* The response length/mean is highly variable, with fluctuations of approximately 100-120 units around the mean.
* There is no consistent long-term trend; the line oscillates without a clear upward or downward direction.
* The highest value observed is around 845, and the lowest is around 730.
* The final data point at Step 400 shows a slight increase, but it's unclear if this indicates a sustained trend.
### Interpretation
The chart suggests that the response length, relative to the mean, is subject to significant random variation. This could be due to several factors, such as:
* **Data Noise:** The underlying data may contain inherent noise or errors.
* **External Factors:** External variables not represented in the chart may be influencing the response length.
* **System Dynamics:** The system generating the responses may exhibit inherent instability or fluctuations.
The lack of a clear trend suggests that the response length is not systematically increasing or decreasing over time. The final uptick at Step 400 could be a temporary fluctuation or the beginning of a new trend, but further data would be needed to confirm this. The chart is useful for identifying the range of variation in response length and for detecting potential anomalies or outliers.
</details>
(f) Response Length Dynamics of Distill-Qwen-14B.
<details>
<summary>figures/files/qwen3-8b-reward.png Details</summary>
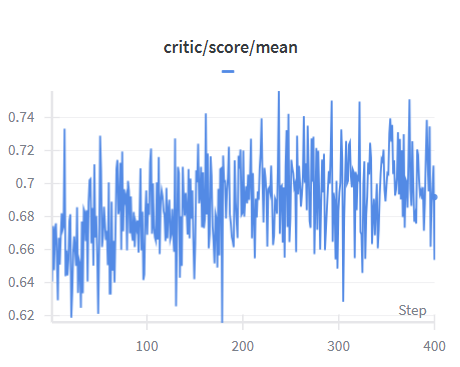
### Visual Description
\n
## Line Chart: critic/score/mean
### Overview
The image displays a line chart illustrating the trend of "critic/score/mean" over "Step". The chart shows a fluctuating line with values ranging approximately from 0.62 to 0.74. The chart appears to represent a time series or iterative process where the mean critic score is being tracked.
### Components/Axes
* **Title:** "critic/score/mean" positioned at the top-center.
* **Subtitle:** A single dash "-" positioned directly below the title.
* **X-axis:** Labeled "Step", ranging from approximately 0 to 400. The axis has tick marks at intervals of 100.
* **Y-axis:** Ranges from approximately 0.62 to 0.74. The axis has tick marks at intervals of 0.02.
* **Data Series:** A single blue line representing the "critic/score/mean".
* **Legend:** There is no explicit legend, as there is only one data series.
### Detailed Analysis
The blue line representing "critic/score/mean" exhibits a highly volatile pattern.
* **Initial Trend (Step 0-100):** The line starts at approximately 0.66 and fluctuates, generally trending slightly upwards.
* **Mid-Range (Step 100-300):** The line continues to fluctuate, with peaks reaching around 0.73 and troughs dipping to around 0.67. The fluctuations appear relatively consistent in amplitude.
* **Final Trend (Step 300-400):** The line continues to fluctuate, with a slight downward trend towards the end of the chart. The final value is approximately 0.69.
Approximate data points (sampled):
* Step 0: ~0.66
* Step 50: ~0.68
* Step 100: ~0.70
* Step 150: ~0.71
* Step 200: ~0.72
* Step 250: ~0.70
* Step 300: ~0.71
* Step 350: ~0.69
* Step 400: ~0.68
### Key Observations
* The data is highly noisy, with frequent and substantial fluctuations.
* There is no clear long-term trend, although there might be a very slight downward trend towards the end of the observed steps.
* The mean critic score appears to be consistently above 0.66 throughout the entire period.
* The maximum observed value is approximately 0.74, and the minimum is approximately 0.62.
### Interpretation
The chart suggests that the critic score is subject to significant variability. This could be due to a number of factors, such as the inherent subjectivity of criticism, changes in the criteria used for evaluation, or the influence of external events. The lack of a strong trend indicates that there is no consistent improvement or decline in the critic score over time. The consistent values above 0.66 suggest a generally positive reception, despite the fluctuations. The data could represent the evaluation of a creative work (e.g., a movie, a book, a game) over multiple iterations or reviews. The fluctuations might reflect different opinions or interpretations of the work. The slight downward trend at the end could indicate a potential decline in quality or a shift in critical sentiment, but further data would be needed to confirm this.
</details>
(g) Reward Dynamics of Qwen3-8B.
<details>
<summary>figures/files/qwen3-8b-length.png Details</summary>
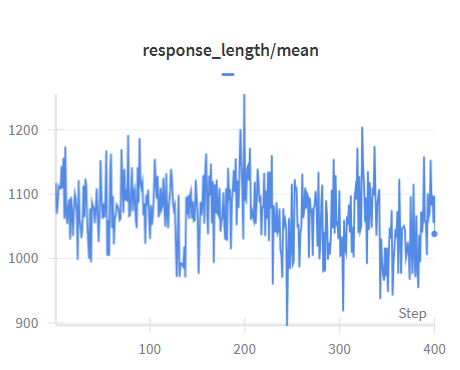
### Visual Description
\n
## Line Chart: Response Length / Mean
### Overview
The image presents a line chart illustrating the relationship between 'Step' and 'response_length/mean'. The chart displays a fluctuating line representing the ratio of response length to the mean, plotted against a step number. The data appears to be time-series or sequential, with the 'Step' value increasing along the x-axis.
### Components/Axes
* **Title:** "response\_length/mean" positioned at the top-center of the chart.
* **X-axis:** Labeled "Step", ranging from approximately 0 to 400. The axis is divided into increments of 100.
* **Y-axis:** No explicit label, but the scale ranges from approximately 900 to 1200. The axis is divided into increments of 100.
* **Data Series:** A single blue line representing 'response\_length/mean'.
* **Data Point:** A small blue circle marks the final data point at Step 400.
### Detailed Analysis
The blue line exhibits significant fluctuations throughout the plotted range.
* **Initial Trend (Step 0-100):** The line generally fluctuates around a value of approximately 1100, with minor variations.
* **Mid-Range (Step 100-300):** The line shows more pronounced fluctuations, dipping to a minimum of approximately 950 around Step 200, and peaking at approximately 1250 around Step 210. There's a general downward trend from Step 100 to Step 200, followed by an upward trend to Step 210, then a return to values around 1100.
* **Final Trend (Step 300-400):** The line continues to fluctuate, remaining mostly between 1000 and 1150. The final data point at Step 400 is approximately 1110.
Approximate data points (with uncertainty of +/- 20):
* Step 0: ~1120
* Step 50: ~1080
* Step 100: ~1130
* Step 150: ~1050
* Step 200: ~950
* Step 250: ~1100
* Step 300: ~1030
* Step 350: ~1140
* Step 400: ~1110
### Key Observations
* The 'response\_length/mean' ratio is highly variable.
* There is no clear long-term trend; the line oscillates around a central value of approximately 1100.
* The most significant dip in the ratio occurs around Step 200.
* The highest peak occurs around Step 210.
### Interpretation
The chart suggests that the response length, relative to its mean, is unstable and subject to considerable variation as the 'Step' progresses. The fluctuations could indicate changes in the nature of the responses being measured, external factors influencing response length, or inherent randomness in the process. The dip around Step 200 might represent a period where responses were significantly shorter than average, while the peak around Step 210 indicates a period of unusually long responses. Without further context, it's difficult to determine the cause of these fluctuations. The data could be related to a system's performance, user behavior, or any process where response length is a key metric. The lack of a clear trend suggests that the system is not consistently improving or degrading in terms of response length relative to its mean.
</details>
(h) Response Length Dynamics of Qwen3-8B.
Figure 7: Training dynamics of reward and response length.
<details>
<summary>x9.png Details</summary>
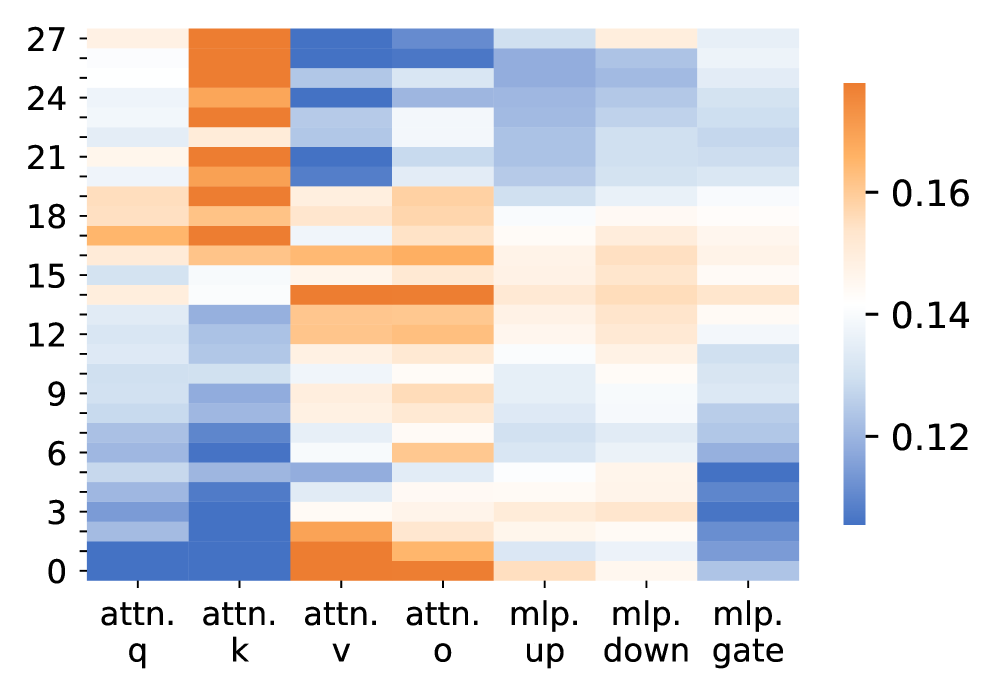
### Visual Description
\n
## Heatmap: Attention and MLP Layer Contributions
### Overview
The image presents a heatmap visualizing the contribution of different attention and Multi-Layer Perceptron (MLP) layers across a range of indices, likely representing layers within a neural network. The heatmap uses a color gradient to represent the magnitude of the contribution, with warmer colors (orange/red) indicating higher contributions and cooler colors (blue) indicating lower contributions.
### Components/Axes
* **X-axis:** Represents different layers: "attn. q", "attn. k", "attn. v", "attn. o", "mlp. up", "mlp. down", "mlp. gate". These likely refer to Query, Key, Value, Output components of an attention mechanism, and Up, Down, Gate components of an MLP.
* **Y-axis:** Represents indices ranging from 0 to 27, in increments of 3. These likely correspond to layer numbers or positions within the network. The axis is labeled with numerical values.
* **Color Scale (Legend):** Located on the right side of the image, the color scale ranges from approximately 0.12 (blue) to 0.16 (red). This scale indicates the magnitude of the values represented by the heatmap colors.
### Detailed Analysis
The heatmap displays a pattern of varying contributions across layers and indices.
* **attn. q:** Shows a strong, consistent contribution across all indices, with values generally between 0.14 and 0.16 (orange). The contribution appears relatively uniform.
* **attn. k:** Exhibits a peak contribution around index 6, reaching approximately 0.16 (red). The contribution decreases towards both ends of the index range, falling to around 0.12 (blue) at indices 0 and 27.
* **attn. v:** Shows a moderate contribution, with a peak around index 3, reaching approximately 0.14 (orange). The contribution is generally lower than "attn. q" and "attn. k".
* **attn. o:** Displays a relatively low and consistent contribution across all indices, generally between 0.12 and 0.13 (light blue).
* **mlp. up:** Shows a moderate contribution, with a peak around index 24, reaching approximately 0.15 (orange). The contribution decreases towards lower indices.
* **mlp. down:** Exhibits a peak contribution around index 0, reaching approximately 0.15 (orange). The contribution decreases towards higher indices.
* **mlp. gate:** Shows a moderate contribution, with a peak around index 6, reaching approximately 0.14 (orange). The contribution is generally lower than "mlp. up" and "mlp. down".
Specifically, approximate values (with uncertainty of +/- 0.01) are:
| Layer | Index 0 | Index 3 | Index 6 | Index 9 | Index 12 | Index 15 | Index 18 | Index 21 | Index 24 | Index 27 |
| --------- | ------- | ------- | ------- | ------- | -------- | -------- | -------- | -------- | -------- | -------- |
| attn. q | 0.15 | 0.15 | 0.15 | 0.15 | 0.15 | 0.15 | 0.15 | 0.15 | 0.15 | 0.15 |
| attn. k | 0.12 | 0.13 | 0.16 | 0.14 | 0.13 | 0.14 | 0.14 | 0.14 | 0.13 | 0.12 |
| attn. v | 0.13 | 0.14 | 0.15 | 0.13 | 0.12 | 0.13 | 0.12 | 0.12 | 0.12 | 0.12 |
| attn. o | 0.12 | 0.12 | 0.12 | 0.12 | 0.12 | 0.12 | 0.12 | 0.12 | 0.12 | 0.12 |
| mlp. up | 0.13 | 0.13 | 0.13 | 0.14 | 0.14 | 0.14 | 0.14 | 0.15 | 0.15 | 0.14 |
| mlp. down | 0.15 | 0.14 | 0.13 | 0.12 | 0.12 | 0.12 | 0.12 | 0.13 | 0.13 | 0.13 |
| mlp. gate | 0.13 | 0.13 | 0.14 | 0.13 | 0.12 | 0.13 | 0.13 | 0.13 | 0.13 | 0.12 |
### Key Observations
* "attn. q" consistently exhibits the highest contribution across all indices.
* "attn. k" shows a distinct peak around index 6, suggesting a particularly important role for this layer at that position.
* "mlp. up" and "mlp. down" show opposing trends, with "mlp. up" increasing towards higher indices and "mlp. down" decreasing.
* "attn. o" consistently exhibits the lowest contribution.
### Interpretation
The heatmap suggests that the Query component of the attention mechanism ("attn. q") is consistently important throughout the network. The peak in "attn. k" at index 6 indicates a specific layer or position where the Key component plays a crucial role. The opposing trends in "mlp. up" and "mlp. down" suggest a complementary relationship between these layers, potentially representing an encoding and decoding process. The low contribution of "attn. o" might indicate that the output of the attention mechanism is less directly influential than its query, key, and value components.
This data could be used to analyze the relative importance of different layers in a neural network, potentially guiding pruning or optimization efforts. The heatmap provides a visual representation of layer contributions, allowing for quick identification of key components and potential areas for improvement. The observed patterns suggest a complex interplay between attention and MLP layers, highlighting the importance of considering both mechanisms when analyzing network behavior.
</details>
(a) Qwen2.5-1.5B-Instruct
<details>
<summary>x10.png Details</summary>
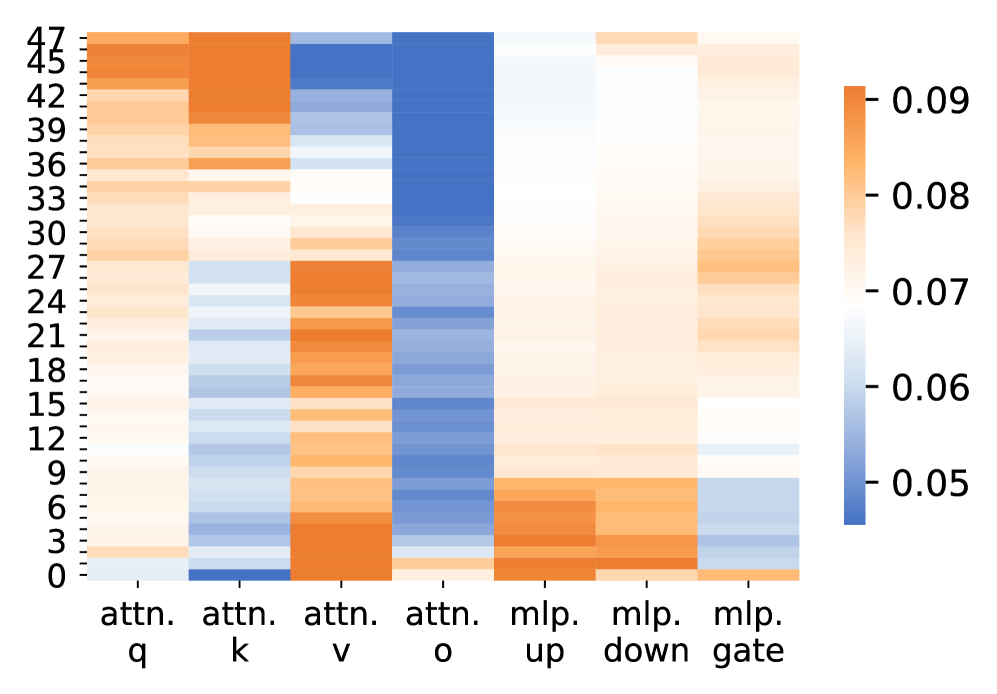
### Visual Description
\n
## Heatmap: Attention and MLP Component Analysis
### Overview
The image presents a heatmap visualizing the relationships between different components of a neural network, specifically attention mechanisms (q, k, v, o) and Multi-Layer Perceptron (MLP) layers (up, down, gate), across a range of layer indices (0 to 47). The color intensity represents a numerical value, likely indicating the strength of a relationship or activation level.
### Components/Axes
* **X-axis:** Represents the network components: "attn. q", "attn. k", "attn. v", "attn. o", "mlp. up", "mlp. down", "mlp. gate".
* **Y-axis:** Represents layer indices, ranging from 0 to 47, in increments of 3. The labels are: 0, 3, 6, 9, 12, 15, 18, 21, 24, 27, 30, 33, 36, 39, 42, 45, 47.
* **Color Scale (Legend):** Located in the top-right corner, the color scale ranges from 0.05 (lightest blue) to 0.09 (darkest orange). The color gradient is linear.
### Detailed Analysis
The heatmap displays a matrix of values, where each cell's color corresponds to a value based on the color scale.
* **attn. q:** Shows a gradual increase in value from approximately 0.05 at layer 0 to around 0.085 at layer 42, then a slight decrease to approximately 0.075 at layer 47.
* **attn. k:** Displays a relatively consistent value around 0.055 across all layers, with minor fluctuations.
* **attn. v:** Shows a peak around layer 21, reaching a value of approximately 0.09, then decreasing to around 0.06 at layer 47.
* **attn. o:** Exhibits a strong peak around layer 30, reaching a value of approximately 0.09, and then decreases to around 0.06 at layer 47.
* **mlp. up:** Shows a relatively consistent value around 0.08 across all layers, with minor fluctuations.
* **mlp. down:** Displays a gradual increase in value from approximately 0.05 at layer 0 to around 0.08 at layer 42, then a slight decrease to approximately 0.07 at layer 47.
* **mlp. gate:** Shows a relatively consistent value around 0.06 across all layers, with minor fluctuations.
### Key Observations
* The "attn. v" and "attn. o" components exhibit distinct peaks at layers 21 and 30 respectively, suggesting these layers are particularly active or important for these attention mechanisms.
* "mlp. up" consistently shows higher values than other components, indicating a strong activation or influence across all layers.
* "attn. k" maintains a relatively low and stable value across all layers.
* The values for "attn. q" and "mlp. down" show a similar trend of increasing from layer 0 to layer 42, then decreasing slightly.
### Interpretation
This heatmap likely represents the magnitude of gradients or activations within a neural network during training or inference. The varying intensities suggest that different components and layers contribute differently to the network's overall function.
The peaks in "attn. v" and "attn. o" could indicate that these attention mechanisms are crucial for processing information at specific stages of the network. The consistent high values in "mlp. up" suggest that this MLP layer plays a significant role in feature transformation or information propagation.
The relatively low values in "attn. k" might indicate that this component is less sensitive or less influential in the network's operation.
The overall trend of increasing and then decreasing values in "attn. q" and "mlp. down" could be related to the network's learning process, where these components initially become more important and then stabilize or become less critical as training progresses.
The heatmap provides a visual overview of the network's internal dynamics, which can be useful for understanding its behavior, identifying potential bottlenecks, and optimizing its performance.
</details>
(b) Distill-Qwen-14B
<details>
<summary>x11.png Details</summary>
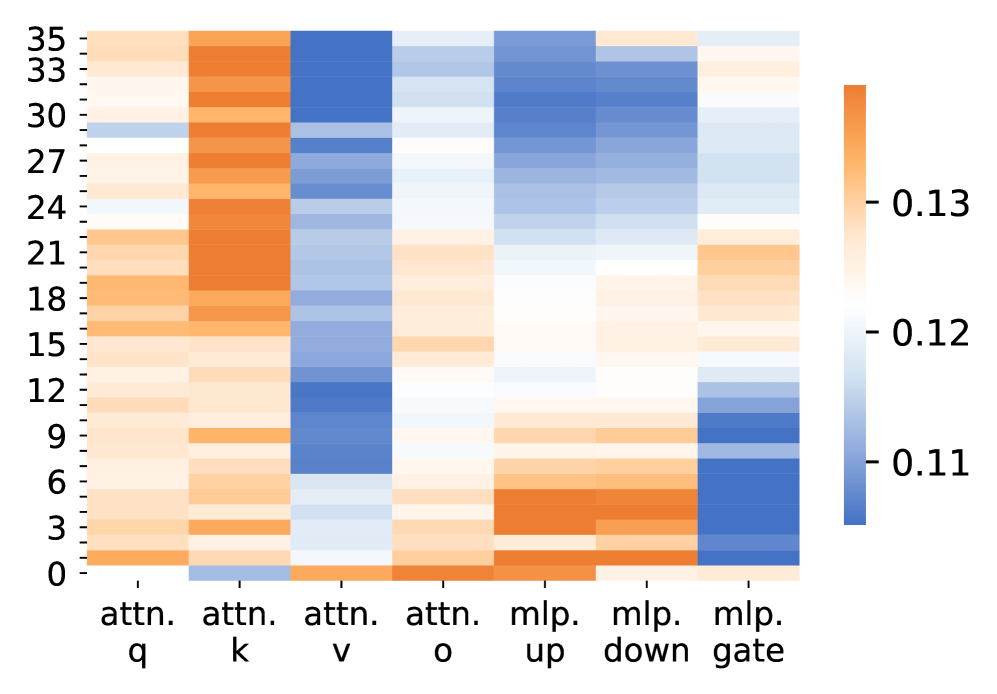
### Visual Description
\n
## Heatmap: Attention and MLP Layer Correlation
### Overview
The image presents a heatmap visualizing correlation values between different layers within a neural network architecture. The layers are labeled as "attn. q", "attn. k", "attn. v", "attn. o", "mlp. up", "mlp. down", and "mlp. gate". The heatmap displays correlation values ranging from approximately 0.11 to 0.13. The vertical axis represents a numerical index from 0 to 35.
### Components/Axes
* **X-axis:** Represents the different layers: "attn. q", "attn. k", "attn. v", "attn. o", "mlp. up", "mlp. down", "mlp. gate".
* **Y-axis:** Represents a numerical index ranging from 0 to 35, with increments of 3. The values are: 0, 3, 6, 9, 12, 15, 18, 21, 24, 27, 30, 33, 35.
* **Color Scale (Legend):** Located on the right side of the heatmap. It ranges from approximately 0.11 (blue) to 0.13 (orange).
* **Data Representation:** The heatmap uses color intensity to represent correlation values.
### Detailed Analysis
The heatmap shows correlation values for each layer combination across the index range.
* **attn. q:** Values are predominantly orange, indicating higher correlation values (around 0.12-0.13) across the entire index range. There's a slight gradient, with values appearing slightly lower towards the top (index 0-6) and slightly higher towards the bottom (index 27-35).
* **attn. k:** Similar to "attn. q", values are mostly orange, with a range of approximately 0.12-0.13. A slight gradient is visible, with a minor decrease in correlation towards the top of the index range.
* **attn. v:** Displays a mix of orange and light blue. The correlation values are generally lower than "attn. q" and "attn. k", ranging from approximately 0.11 to 0.13. There's a noticeable gradient, with lower values at the top (index 0-9) and higher values towards the bottom (index 24-35).
* **attn. o:** Shows a similar pattern to "attn. v", with a mix of orange and light blue. Correlation values range from approximately 0.11 to 0.13, with a gradient from lower values at the top to higher values at the bottom.
* **mlp. up:** Predominantly light blue, indicating lower correlation values (around 0.11-0.12). The values are relatively consistent across the index range.
* **mlp. down:** Displays a mix of light blue and orange. Correlation values range from approximately 0.11 to 0.13, with a gradient from lower values at the top to higher values at the bottom.
* **mlp. gate:** Shows a mix of light blue and orange, with a more pronounced gradient. Correlation values range from approximately 0.11 to 0.13, with lower values at the top and higher values at the bottom.
### Key Observations
* The "attn. q" and "attn. k" layers consistently exhibit the highest correlation values across the index range.
* "mlp. up" consistently shows the lowest correlation values.
* "attn. v", "attn. o", "mlp. down", and "mlp. gate" show a gradient in correlation values, increasing from the top to the bottom of the index range.
* The correlation values are relatively small, ranging only from 0.11 to 0.13.
### Interpretation
The heatmap suggests that the query and key attention mechanisms ("attn. q" and "attn. k") are strongly correlated with each other throughout the different indices. This could indicate that these layers are working in a coordinated manner to process information. The lower correlation values observed in the "mlp. up" layer suggest that this layer might be more independent or have a different role in the network's processing. The gradient observed in "attn. v", "attn. o", "mlp. down", and "mlp. gate" could indicate that the correlation between these layers changes as the network processes information at different stages (represented by the index). The small magnitude of the correlation values overall suggests that the layers are not strongly dependent on each other, which could be a characteristic of a well-designed neural network architecture that promotes diversity and avoids overfitting. The heatmap provides insights into the relationships between different layers within the network, which can be useful for understanding the network's behavior and identifying potential areas for improvement.
</details>
(c) Qwen3-8B
Figure 8: Parameter change rates of LLMs to the original ones across different modules.
A.4.5 Training Dynamics Analysis
As shown in Fig. 7, we present the reward and response length dynamics during training across four models: Qwen2.5-7B-Instruct, Distill-Qwen-7B, Distill-Qwen-14B, and Qwen3-8B. For reward scores, all models exhibit a consistent pattern: an initial rapid increase followed by stabilization with oscillations. Qwen2.5-7B-Instruct shows the steepest initial improvement, rising from 0.4 to 0.6 within 20 steps, while Distill-Qwen models demonstrate more gradual increases over 200-400 steps, reaching stable scores around 0.65-0.7. Qwen3-8B displays higher volatility with scores fluctuating between 0.62 and 0.74. In contrast, response length shows high variability across all models with no clear monotonic trend. Response lengths vary substantially by model scale: Qwen2.5-7B-Instruct generates shorter responses (340-400 tokens), while Distill-Qwen models and Qwen3-8B produce longer outputs (700-850 and 900-1200 tokens, respectively). The high variance in response length suggests that the training process maintains flexibility in output generation while improving constraint satisfaction, as evidenced by the stable reward trends.
A.4.6 Full Parameter Change Patterns
As shown in Fig. 8, we extend the parameter change analysis to three additional models: Qwen2.5-1.5B-Instruct, Distill-Qwen-14B, and Qwen3-8B. The analysis reveals consistent patterns across all models: attention query (attn.q) and key (attn.k) modules exhibit the highest parameter change rates, particularly concentrated in the bottom and top layers, while attention value (attn.v) and output (attn.o) modules consistently show minimal changes across all layers. MLP modules (mlp.up, mlp.down, mlp.gate) demonstrate moderate change rates, falling between the high changes in attn.q/attn.k and the low changes in attn.v/attn.o.
<details>
<summary>x12.png Details</summary>
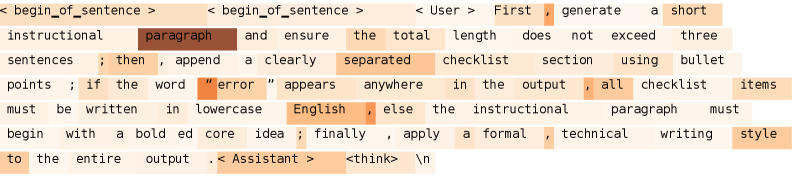
### Visual Description
\n
## Text Block: Instruction Set
### Overview
The image presents a block of text, seemingly generated by a language model, containing instructions for its own operation. The text is color-coded, likely to highlight specific commands or keywords. The overall purpose is to define the model's behavior for a particular task – detailed technical document extraction from images.
### Components/Axes
There are no axes or components in the traditional sense. The image consists of a single block of text with color highlighting. The text is segmented by `<begin_of_sentence>` and `<User>` tags. The color scheme appears to be used to differentiate instructions from user input.
### Detailed Analysis or Content Details
The text can be transcribed as follows:
`<begin_of_sentence> <begin_of_sentence> User> First, generate a short instructional paragraph and ensure the total length does not exceed three sentences ; then, append a clearly separated checklist section using bullet points ; if the word “error” appears anywhere in the output, all checklist items must be written in lowercase English ; else the instructional paragraph must begin with a bold ed core idea ; finally, apply a formal technical writing style to the entire output <Assistant> think \n`
The text is segmented into distinct parts:
1. Initial tags: `<begin_of_sentence> <begin_of_sentence>`
2. User instruction: `User> First, generate a short instructional paragraph and ensure the total length does not exceed three sentences ; then, append a clearly separated checklist section using bullet points ; if the word “error” appears anywhere in the output, all checklist items must be written in lowercase English ; else the instructional paragraph must begin with a bold ed core idea ; finally, apply a formal technical writing style to the entire output`
3. Assistant prompt: `<Assistant> think \n`
The color coding is as follows (approximate):
* `paragraph`: Brown
* `and`: Light Orange
* `ensure`: Light Orange
* `the`: Pale Yellow
* `total`: Pale Yellow
* `length`: Pale Yellow
* `does`: Pale Yellow
* `not`: Pale Yellow
* `exceed`: Pale Yellow
* `three`: Pale Yellow
* `sentences`: Pale Yellow
* `;`: Pale Yellow
* `then`: Light Orange
* `append`: Light Orange
* `a`: Pale Yellow
* `clearly`: Pale Yellow
* `separated`: Pale Yellow
* `checklist`: Pale Yellow
* `section`: Pale Yellow
* `using`: Pale Yellow
* `bullet`: Pale Yellow
* `points`: Pale Yellow
* `;`: Pale Yellow
* `if`: Light Orange
* `word`: Pale Yellow
* `“error”`: Red
* `appears`: Pale Yellow
* `anywhere`: Pale Yellow
* `in`: Pale Yellow
* `output`: Pale Yellow
* `,`: Pale Yellow
* `all`: Pale Yellow
* `checklist`: Pale Yellow
* `items`: Pale Yellow
* `must`: Pale Yellow
* `be`: Pale Yellow
* `written`: Pale Yellow
* `lowercase`: Pale Yellow
* `English`: Pale Yellow
* `;`: Pale Yellow
* `else`: Light Orange
* `instructional`: Pale Yellow
* `paragraph`: Pale Yellow
* `must`: Pale Yellow
* `begin`: Pale Yellow
* `with`: Pale Yellow
* `a`: Pale Yellow
* `bold`: Pale Yellow
* `ed`: Pale Yellow
* `core`: Pale Yellow
* `idea`: Pale Yellow
* `;`: Pale Yellow
* `finally`: Light Orange
* `apply`: Light Orange
* `a`: Pale Yellow
* `formal`: Pale Yellow
* `technical`: Pale Yellow
* `writing`: Pale Yellow
* `style`: Pale Yellow
* `to`: Pale Yellow
* `entire`: Pale Yellow
* `output`: Pale Yellow
* `<Assistant>`: Light Orange
* `think`: Light Orange
* `\n`: Light Orange
### Key Observations
The text is a self-referential instruction set. The color coding is a visual cue, likely intended for parsing by a machine or for emphasis. The presence of tags like `<begin_of_sentence>` suggests a structured generation process.
### Interpretation
The data demonstrates a meta-cognitive process where a language model is given instructions on *how* to generate output, including stylistic guidelines and conditional logic. The use of tags and color coding indicates a desire for precise control over the output format. The conditional statement regarding the word "error" suggests a built-in error handling mechanism. The overall structure is designed to ensure the model adheres to a specific technical writing style and provides a checklist for verification. The instruction to "think" is a prompt to engage the model's reasoning capabilities.
---
## Checklist:
* generate a short instructional paragraph and ensure the total length does not exceed three sentences
* then, append a clearly separated checklist section using bullet points
* if the word “error” appears anywhere in the output, all checklist items must be written in lowercase english
* else the instructional paragraph must begin with a bolded core idea
* finally, apply a formal technical writing style to the entire output
</details>
(a) Before Training - Distill-Qwen-7B
<details>
<summary>x13.png Details</summary>
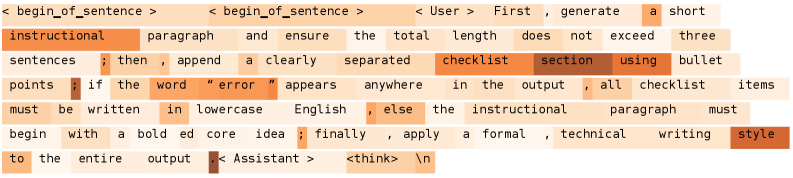
### Visual Description
\n
## Heatmap: Textual Instruction Generation Control
### Overview
The image presents a heatmap visualizing the intensity of a process related to generating a short instructional paragraph and a subsequent checklist. The heatmap appears to represent the activation or weighting of different words or phrases within a prompt, likely used to control the behavior of a language model. The color gradient ranges from light yellow to dark red, indicating varying levels of intensity.
### Components/Axes
The image does not have explicit axes labels. However, the horizontal axis represents a sequence of words/phrases, and the vertical axis appears to represent some internal state or activation level. The heatmap is composed of rectangular cells, each colored according to its intensity. The text is arranged horizontally, and the color intensity varies across the text.
### Detailed Analysis or Content Details
The following text is present, arranged horizontally across the heatmap:
`< begin_of_sentence >`
`< begin_of_sentence >`
`User > First, generate a short instructional paragraph and ensure the total length does not exceed three sentences ; then, append a clearly separated checklist section using bullet points if the word “error” appears anywhere in the output, all checklist items must be written in lowercase English, else the instructional paragraph must begin with a bold ed core idea ; finally, apply a formal, technical writing style to the entire output < Assistant > think . \n`
The color intensity varies across this text. The highest intensity (darkest red) appears to be associated with the word "error". Other areas of high intensity include "begin_of_sentence", "User", "generate", "checklist", "lowercase", "bold", "idea", and "Assistant". The intensity is generally lower for words like "a", "the", "and", "to", "in", "if", "else", "must", "apply", "style", and punctuation marks.
### Key Observations
The heatmap highlights the importance of the word "error" in influencing the output. The presence of this word seems to trigger a specific set of instructions related to checklist formatting (lowercase bullet points). The instructions themselves are also highlighted, suggesting they are key components of the prompt. The phrase "begin_of_sentence" appears to be a significant marker.
### Interpretation
This heatmap likely represents the internal weighting or activation of different parts of a prompt given to a language model. The darker red areas indicate words or phrases that have a stronger influence on the model's behavior. The emphasis on "error" suggests a conditional logic within the prompt – if the model detects an error, it should format the checklist in a specific way. The overall structure of the prompt is also important, as evidenced by the highlighting of phrases like "generate", "checklist", and "instructional paragraph". The heatmap provides insight into how the language model interprets and responds to different parts of the prompt, revealing the critical elements that drive its output. The use of `< begin_of_sentence >` suggests a tokenization or sequence-processing approach. The presence of "User >" and "< Assistant >" indicates a turn-taking structure in a conversational context.
</details>
(b) After Training - Distill-Qwen-7B
<details>
<summary>x14.png Details</summary>
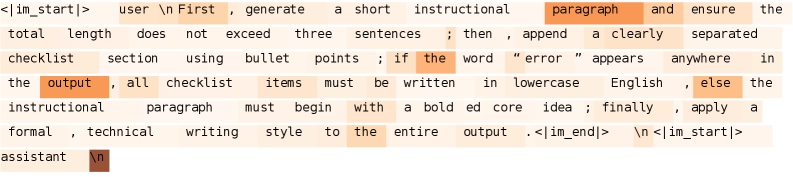
### Visual Description
\n
## Text Block: Instruction Set
### Overview
The image presents a block of text containing an instruction set, seemingly intended for a language model or similar AI assistant. The text is highlighted with different colors, likely indicating specific keywords or conditions.
### Components/Axes
There are no axes or components in the traditional sense. The image consists solely of text with color highlighting. The text appears to be in English.
### Detailed Analysis or Content Details
The text reads as follows:
“<im_start> user \n First, generate a short instructional paragraph ensure the total length does not exceed three sentences ; then, append a clearly separated checklist section using bullet points ; if the word “error” appears anywhere in the output, all checklist items must be written in lowercase English, else the instructional paragraph must begin with a bold ed core idea ; finally, apply a formal, technical writing style to the entire output. <im_end> \n<im_start> assistant \n”
The following words are highlighted:
* "user" (orange)
* "First" (orange)
* "instructional" (orange)
* "paragraph" (orange)
* "ensure" (orange)
* "total" (orange)
* "length" (orange)
* "does" (orange)
* "not" (orange)
* "exceed" (orange)
* "three" (orange)
* "sentences" (orange)
* "then" (orange)
* "append" (orange)
* "clearly" (orange)
* "separated" (orange)
* "checklist" (orange)
* "section" (orange)
* "using" (orange)
* "bullet" (orange)
* "points" (orange)
* "if" (orange)
* "word" (orange)
* "error" (orange)
* "appears" (orange)
* "anywhere" (orange)
* "output" (orange)
* "all" (orange)
* "items" (orange)
* "must" (orange)
* "be" (orange)
* "written" (orange)
* "lowercase" (orange)
* "English" (orange)
* "else" (orange)
* "begin" (orange)
* "bold" (orange)
* "core" (orange)
* "idea" (orange)
* "finally" (orange)
* "apply" (orange)
* "formal" (orange)
* "technical" (orange)
* "writing" (orange)
* "style" (orange)
* "entire" (orange)
* "assistant" (brown)
### Key Observations
The text is a set of instructions for an AI assistant. The highlighting seems to emphasize keywords related to the task requirements. The presence of `<im_start>` and `<im_end>` tags suggests this is part of a larger dialogue or interaction system.
### Interpretation
The data suggests a system for controlling the behavior of a language model. The instructions are designed to elicit a specific type of response: a concise instructional paragraph followed by a checklist. The conditional logic regarding the word "error" and the formatting of the checklist indicates a quality control mechanism. The emphasis on "formal, technical writing style" suggests a preference for precise and objective communication. The use of tags `<im_start>` and `<im_end>` indicates this is likely a turn in a conversational AI system. The highlighting is likely used to draw attention to key elements of the instruction set.
</details>
(c) Before Training - Qwen3-8B
<details>
<summary>x15.png Details</summary>
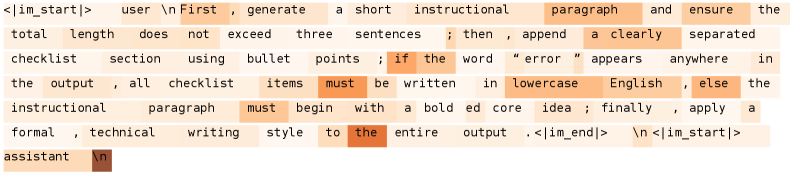
### Visual Description
\n
## Heatmap: Instruction Generation Parameters
### Overview
The image presents a heatmap visualizing the relative importance or activation levels of words within a prompt instruction. The heatmap displays the text of an instruction given to a language model, with color intensity representing the degree of activation or relevance of each word. The color scale ranges from a dark reddish-brown to a light peach color, indicating varying levels of importance.
### Components/Axes
The image does not have explicit axes labels or a legend. However, the horizontal axis represents the sequence of words in the instruction, and the vertical axis is implicitly a measure of activation or importance. The color intensity serves as the visual indicator of the value along this implicit vertical axis.
### Detailed Analysis
The instruction text is: "First generate a short instructional paragraph ensure the total length does not exceed three sentences ; then append a clearly separated checklist section using bullet points ; if the word “error” appears anywhere in the output , all checklist items must be written in lowercase English , else the instructional paragraph must begin with a bold ed core idea ; finally , apply a formal , technical writing style to the entire output ."
Here's a breakdown of the heatmap's color intensity across the instruction:
* **"First"**: Light peach, low activation.
* **"generate"**: Peach, slightly higher activation.
* **"a"**: Very light peach, minimal activation.
* **"short"**: Peach, slightly higher activation.
* **"instructional"**: Peach, moderate activation.
* **"paragraph"**: Peach, moderate activation.
* **"ensure"**: Peach, moderate activation.
* **"the"**: Very light peach, minimal activation.
* **"total"**: Peach, moderate activation.
* **"length"**: Peach, moderate activation.
* **"does"**: Very light peach, minimal activation.
* **"not"**: Very light peach, minimal activation.
* **"exceed"**: Peach, moderate activation.
* **"three"**: Peach, moderate activation.
* **"sentences"**: Peach, moderate activation.
* **";"**: Very light peach, minimal activation.
* **"then"**: Peach, moderate activation.
* **"append"**: Peach, moderate activation.
* **"a"**: Very light peach, minimal activation.
* **"clearly"**: Peach, moderate activation.
* **"separated"**: Peach, moderate activation.
* **"checklist"**: Peach, moderate activation.
* **"section"**: Peach, moderate activation.
* **"using"**: Very light peach, minimal activation.
* **"bullet"**: Peach, moderate activation.
* **"points"**: Peach, moderate activation.
* **";"**: Very light peach, minimal activation.
* **"if"**: Peach, moderate activation.
* **"the"**: Very light peach, minimal activation.
* **"word"**: Peach, moderate activation.
* **“error”**: Dark reddish-brown, highest activation.
* **"appears"**: Peach, moderate activation.
* **"anywhere"**: Peach, moderate activation.
* **"in"**: Very light peach, minimal activation.
* **"the"**: Very light peach, minimal activation.
* **"output"**: Peach, moderate activation.
* **","**: Very light peach, minimal activation.
* **"all"**: Peach, moderate activation.
* **"checklist"**: Peach, moderate activation.
* **"items"**: Peach, moderate activation.
* **"must"**: Peach, moderate activation.
* **"be"**: Very light peach, minimal activation.
* **"written"**: Peach, moderate activation.
* **"in"**: Very light peach, minimal activation.
* **"lowercase"**: Peach, moderate activation.
* **"English"**: Peach, moderate activation.
* **","**: Very light peach, minimal activation.
* **"else"**: Peach, moderate activation.
* **"the"**: Very light peach, minimal activation.
* **"instructional"**: Peach, moderate activation.
* **"paragraph"**: Peach, moderate activation.
* **"must"**: Peach, moderate activation.
* **"begin"**: Peach, moderate activation.
* **"with"**: Very light peach, minimal activation.
* **"a"**: Very light peach, minimal activation.
* **"bold"**: Peach, moderate activation.
* **"ed"**: Peach, moderate activation.
* **"core"**: Peach, moderate activation.
* **"idea"**: Peach, moderate activation.
* **";"**: Very light peach, minimal activation.
* **"finally"**: Peach, moderate activation.
* **","**: Very light peach, minimal activation.
* **"apply"**: Peach, moderate activation.
* **"a"**: Very light peach, minimal activation.
* **"formal"**: Peach, moderate activation.
* **","**: Very light peach, minimal activation.
* **"technical"**: Peach, moderate activation.
* **"writing"**: Peach, moderate activation.
* **"style"**: Peach, moderate activation.
* **"to"**: Very light peach, minimal activation.
* **"the"**: Very light peach, minimal activation.
* **"entire"**: Peach, moderate activation.
* **"output"**: Peach, moderate activation.
* **"."**: Very light peach, minimal activation.
### Key Observations
The word “error” exhibits the highest activation level, suggesting its critical importance in the instruction. Words like "generate", "instructional", "paragraph", "checklist", "must", and "apply" also show relatively high activation, indicating their significance in defining the task. Articles ("a", "the") and conjunctions ("if", "else") have the lowest activation levels, as expected.
### Interpretation
The heatmap demonstrates the language model's focus during instruction processing. The high activation of "error" likely reflects the conditional logic it needs to implement – the entire behavior of the checklist generation hinges on the presence of this word. The moderate activation of other keywords suggests they are essential for understanding the overall task requirements. The heatmap provides insight into which parts of the instruction the model prioritizes, which can be valuable for optimizing prompt engineering and ensuring the model accurately interprets the desired behavior. The color gradient provides a visual representation of the relative importance of each word, allowing for a quick assessment of the instruction's key components.
</details>
(d) After Training - Qwen3-8B
Figure 9: Token-level information flow analysis. Darker orange indicates higher attention importance.
A.4.7 Full Token-Level Information Flow Analysis
As shown in Fig. 9, we extend the token-level information flow analysis to Distill-Qwen-7B and Qwen3-8B models on complex instruction-following tasks. Before training, both models exhibit relatively diffuse attention patterns, with only a subset of tokens (e.g., "instructional", "paragraph", "checklist", "error") showing moderate importance. After training, both models demonstrate a dramatic shift towards uniformly high attention importance across virtually all tokens in the prompt, including conjunctions, prepositions, and specific constraints.