# Trust Me on This: A User Study of Trustworthiness for RAG Responses
**Authors**: Weronika Łajewska, Krisztian Balog
> Work done while at University of Stavanger, prior to joining Amazon.
institutetext: Amazon institutetext: University of Stavanger, Stavanger, Norway email: lajewska@amazon.lu, krisztian.balog@uis.no
## Abstract
The integration of generative AI into information access systems often presents users with synthesized answers that lack transparency. This study investigates how different types of explanations can influence user trust in responses from retrieval-augmented generation systems. We conducted a controlled, two-stage user study where participants chose the more trustworthy response from a pair—one objectively higher quality than the other—both with and without one of three explanation types: (1) source attribution, (2) factual grounding, and (3) information coverage. Our results show that while explanations significantly guide users toward selecting higher quality responses, trust is not dictated by objective quality alone: Users’ judgments are also heavily influenced by response clarity, actionability, and their own prior knowledge.
## 1 Introduction
As generative AI becomes integrated into information access systems, from conversational agents to summaries on search engine result pages, users are increasingly presented with concise responses—often just a few sentences—without visibility into which sources the response was based on. This shift conceals crucial information that users typically rely on to assess the novelty, reliability, and relevance of retrieved content [25]. Retrieval-augmented generation (RAG) [13, 7, 10, 20] has recently emerged as a prominent approach to generating more factually grounded and diverse responses by leveraging external documents. However, RAG models still fall short on transparency: they offer no indication of low-confidence outputs or known limitations, whether stemming from incomplete retrieval or flaws in generation. Because users see only the final output, the responsibility lies with the system to surface potential issues, thereby promoting transparency and enabling users to judge the response quality. Although explainability has been extensively studied in areas such as decision support and recommender systems [2, 18, 26, 23, 14, 24, 27], it remains underexplored in the context of retrieval-augmented response generation.
While prior work establishes that explanations can enhance the user-perceived usefulness of a generated response [12], trust operates on a different, more critical level. Usefulness can be seen as the immediate utility of a response for a given task, relating to its clarity, format, or relevance. Trust, however, concerns the user’s belief in the credibility and factual correctness of the information itself. A user might find a well-structured summary useful for getting a quick overview, but they will only trust it for a critical decision if they believe it to be factually sound. Therefore, trust is a distinct and vital prerequisite for the meaningful adoption of these systems, moving beyond surface-level utility to user confidence and reliance. Therefore, this paper investigates the next logical step by asking: How do different types of explanations influence user trust in responses from retrieval-augmented generation systems?
To answer this question, we conducted a controlled user study with a two-stage, within-subject design. We extended an existing response generation pipeline with a post-hoc module to generate three distinct types of explanations: (1) source attribution via supporting passages, (2) factual grounding by linking response statements to sources, and (3) information coverage through the surfacing of relevant but omitted aspects of the topic. Study participants were shown a pair of responses for a given query, where one response was of higher objective quality than the other. Initially, they chose the response they found more trustworthy. Subsequently, they were presented with the exact same pair of responses, but now enhanced with one of the explanation types, and were prompted to make their trust judgment again. This two-stage design enabled a direct measurement of how explanations altered a user’s perception of trustworthiness.
The results of our study show that users’ trust judgments do not always align with the objective quality of responses. Many participants preferred the objectively lower quality response when it was clearer, more detailed, or more actionable. Source attribution had the strongest positive effect on trust, but only in factual or technical contexts, while it was largely ignored in subjective questions. Finally, as indicated in the free-text comments provided by users, the relevance of information and users’ own background knowledge strongly shaped trust decisions, with some participants dismissing or overlooking explanations when they felt confident in their own understanding of the topic. All collected user data, input responses, and corresponding annotations from this study are available in the public repository: https://github.com/iai-group/trustworthy-rag/.
## 2 Related Work
Trust is a key factor in human–machine interaction, particularly in information-intensive tasks such as retrieval-augmented response generation, which synthesizes relevant information into concise, comprehensive responses [13]. System trustworthiness is not inherent but is instead communicated through trust cues—features of the interface, documentation, or explanations that shape users’ judgments [16]. When these cues are misleading or poorly designed, they can foster misplaced trust or confusion [16]. Because such cues are often processed heuristically rather than analytically, users tend to rely on mental shortcuts that can result in inconsistent or biased trust assessments. Providing explanations is one approach to addressing these challenges: explainable systems are expected to clarify their capabilities, communicate uncertainty, and make their reasoning transparent [1]. However, explanations can have mixed effects—they can enhance trust but may also lead to overtrust or inaccurate mental models, especially among users with low domain expertise [4].
Generated responses often contain unsupported claims or incorrect citations [17]. Commercial conversational search systems, such as Perplexity.ai, Microsoft Copilot, and Google Gemini, display source links, but explanations are generally limited to attribution, overlooking other important aspects. Additional factors that influence trust include bias [6, 5], unanswerability [8, 9], and response completeness [3]. Prior work on trustworthy RAG and question answering has focused mainly on grounding and factual correctness (e.g., avoiding hallucinations) rather than directly on user trust [15, 21, 17, 22]. High-quality explanations related to source, system confidence, and response limitations have been shown to improve the perceived usefulness of responses [12], echoing findings in broader AI research where calibrated confidence improves trust [27]. However, their effect on user trust remains largely unexplored. In this work, we adopt a user-centered perspective to investigate how different explanation strategies shape trust judgments in RAG responses for information-seeking queries.
<details>
<summary>x1.png Details</summary>
### Visual Description
## [Diagram]: Survey Interface for Response Evaluation
### Overview
The image displays a structured, multi-part survey or questionnaire interface designed to evaluate and compare two responses to a given question. The interface is divided into clear sections with instructions, a question block, and two identical question blocks below it, each presenting a pair of responses for evaluation. The design uses color-coded headers and a clean, form-like layout.
### Components/Axes
The diagram is segmented into the following regions, from top to bottom:
1. **Header (Instructions Box):**
* **Background Color:** Light yellow.
* **Title:** "Instructions" (bold, centered).
* **Text Content:** A paragraph explaining the task: "You will be presented with multiple questions. For each question, you will see two pairs of responses. Read two variants of responses, indicate which aspects of the topic they cover, and decide which response do you trust more. We want to know your first impression, so do not change your responses once you move to the next question. Rely solely on your judgment and refrain from using additional sources other than the ones provided in this task."
2. **Question Block 1:**
* **Header:** A red-bordered box with the title "Question 1".
* **Response Panels:** Two side-by-side panels with green headers.
* **Left Panel Header:** "Response 1 (no explanations)"
* **Right Panel Header:** "Response 2 (no explanations)"
* **Content within each Response Panel:**
* A prompt: "Which aspects/facets/points of view are discussed in this response? (Select all that are discussed!)"
* A checklist with placeholder items: "aspect 1", "aspect 2", and "..." (indicating more items).
* **Evaluation Section (below the two panels):**
* **Prompt:** "Which response do you trust more?"
* **Radio Button Options:**
* "Trust Response A a lot more"
* "Trust Response A slightly more"
* "Trust them about the same"
* "Trust Response B slightly more"
* "Trust Response B a lot more"
* **Text Input Field:** Labeled "In your own words, explain your preferences and justify your choice." with a blank line for a written response.
3. **Question Block 2:**
* **Header:** A red-bordered box with the title "Question 1" (identical to the first block).
* **Response Panels:** Two side-by-side panels with green headers.
* **Left Panel Header:** "Response 1 (with explanations)"
* **Right Panel Header:** "Response 2 (with explanations)"
* **Content within each Response Panel:** Identical to the first block (checklist prompt and items).
* **Evaluation Section:** Identical to the first block (trust rating radio buttons and explanation text field).
### Detailed Analysis
* **Spatial Layout:** The interface is vertically stacked. The instructions are at the top. The two "Question 1" blocks are arranged one above the other, separated by a thin horizontal line. Within each question block, the two response panels are placed side-by-side (left and right), with the evaluation section centered below them.
* **Text Transcription:** All text is in English. The transcription is exact as provided in the Components section above.
* **Visual Elements:** The design uses color (yellow, red, green) and borders to create a clear visual hierarchy and separate different functional areas (instructions, question, response options, evaluation). Checkboxes (□) and radio buttons (○) are used as standard form elements.
### Key Observations
1. **Repetitive Structure:** The two main question blocks are structurally identical, differing only in the header label for the response panels ("no explanations" vs. "with explanations"). This suggests a controlled comparison within the same question context.
2. **Task Design:** The task requires a two-step evaluation for each response pair: first, a categorical selection (aspects covered), and second, a comparative judgment (trust rating) with qualitative justification.
3. **Placeholder Content:** The use of "aspect 1", "aspect 2", and "..." indicates this is a template or mock-up of the interface, not a live instance with specific content.
4. **Instructional Emphasis:** The instructions explicitly stress forming a "first impression," not changing responses, and relying solely on provided information, highlighting a focus on immediate, unbiased judgment.
### Interpretation
This diagram illustrates the design of a **human evaluation protocol**, likely for assessing the quality, trustworthiness, or coverage of AI-generated or human-written responses. The structure serves several investigative purposes:
* **Comparative Analysis:** By presenting two responses side-by-side, it forces a direct comparison, which is a common method in A/B testing or preference ranking.
* **Multi-Dimensional Assessment:** It separates the evaluation into **coverage** (which aspects are discussed) and **trust** (a holistic judgment). This allows researchers to analyze whether trust correlates with the number or type of aspects covered.
* **Control for Explanation:** The two identical blocks ("no explanations" vs. "with explanations") suggest an experiment to test the impact of providing justifications or reasoning within the responses themselves on the evaluator's trust. This is a key variable in studies of explainable AI (XAI) or persuasive communication.
* **Qualitative & Quantitative Data:** The interface collects both structured data (checkbox selections, radio button ratings) and unstructured data (free-text explanations), enabling mixed-methods analysis of evaluator reasoning.
The design prioritizes clarity and consistency to minimize confounding variables in the evaluation process. The explicit instructions aim to standardize the evaluator's mindset, making the collected data more reliable for analyzing patterns in human judgment when comparing information sources.
</details>
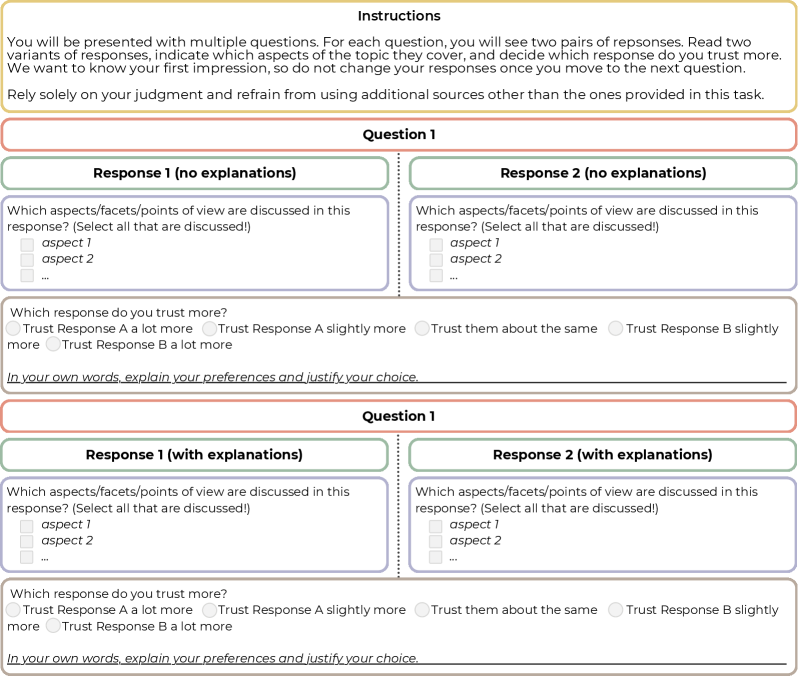
Figure 1: User study design (example on a single query).
## 3 User Study
To investigate the impact of different explanation types on users’ trust in RAG responses, we designed and conducted a user study. The study evaluates three key dimensions of response quality—source attribution, factual grounding, and information coverage—each associated with a corresponding explanation type. Our goal is to measure how truthful explanations revealing the quality of a response alter a user’s initial trust judgment.
### Experiment Design.
We employed a within-subject study design where the core task involved a two-step comparison. As visualized in Figure 1, participants were first presented with a pair of responses—one high-quality and one limited-quality, shown in random order—without explanations, and were asked the question: “Which response do you trust more?”. After providing their initial judgment on a 5-point Likert scale, they were shown the exact same pair or responses, but this time enhanced with one of the explanation types. This design directly measures the shift in user trust attributable to the presence of an explanation. Even though the modification of the scores for the first pair of responses (without explanations) is not blocked by the UI, users were instructed to not change it after moving to the next question. After each comparison (both with and without explanations), users were also asked to justify their choice in a free-text comment.
We conducted separate experiments for each of the three explanation types, allowing us to isolate and evaluate the independent effect of each response dimension on user trust.
### Responses and Explanations.
We selected 30 queries from the TREC CAsT ’22 dataset [19] (10 for each response dimension). No more than two queries were selected from the same CAsT topic. Factual, information-intensive queries were prioritized for source attribution and factual grounding explanations, whereas queries involving complex or controversial topics were prioritized for information coverage explanations. For each query, responses were generated using GINGER, a modular pipeline for response creation based on information nuggets extracted from retrieved documents [11]. This approach ensures grounding in specific facts, facilitates source attribution, and maximizes information inclusion within length constraints. To systematically study the effect of explanations, we manipulated the quality of the generated responses by altering the underlying source passages: High-quality responses were based on relevant passages with high coverage of the information requested in the query. Limited-quality responses were based on only partially relevant passages covering a single aspect of the topic or were generated based solely on LLM’s parametric memory without relying on external relevant passages—see Table 1 for details.
To generate explanations, we extended the GINGER pipeline with a post-hoc explanation module that includes source attribution, statement grounding, and additional topic facets revealment. Crucially, all explanations shown to users are truthful, accurately revealing the shortcomings of limited-quality responses.
Table 1: Summary of explanation types and manipulated response characteristics.
| Response Dimension/ | High-quality | Limited-quality |
| --- | --- | --- |
| Explanation | Response | Response |
| Source Attribution | Based on relevant passages with clear source attribution | Relying on information from LLM parametric memory |
| Supporting passages: Clarifies whether the response is grounded in verifiable sources | List of supporting passages | “The response has no traceable origin and it cannot be attributed to specific source documents.” |
| Factual Grounding | Each factual statement is traceable to a relevant passage | Response is generated from parametric memory without traceable origin |
| Statement-level links: Clarifies whether each claim in the response can be traced to a supporting source | List of supporting passages linked inline to supported statements | “The response is not supported by verifiable references, and the individual claims cannot be reliably cross-checked against sources.” |
| Information Coverage | Covers multiple facets of the query topic | Covers only a single aspect or misses major points |
| Missing aspects highlighted: Discloses whether important information is missing from the response | “The response covers multiple aspects of the topic, providing a broad view.” | “The response focuses on just one aspect and may miss important points related to: Keyword: {keyword} ” |
### Participants and Procedure.
We recruited skilled and engaged crowd workers from Amazon Mechanical Turk through a qualification task containing 5 query-response pairs, each followed by a question about topic aspects covered in the given response. Each qualified worker completed a human intelligence task (HIT) that included 2 queries per explanation type, resulting in 6 unique queries per HIT. For each query, participants compared two response variants, first without explanations and then with explanations. In total, each worker evaluated 12 response comparisons. After each response comparison, workers were asked to justify their choice in a free-text comment. We follow a within-subject design to control for individual differences as each participant serves as their own control, reducing variability and increasing the sensitivity of the analysis, as well as to use recruited crowd workers more efficiently by collecting multiple data points from each one. We designed 5 different HITs in total, each completed by 10 different participants. This setup ensures balanced coverage and enables us to independently assess the effect of each type of explanation on user trust.
### Study Execution.
The qualification study and main data collection were conducted over a period of one week (18–25 September, 2025). The qualification task was released to 50 workers, of whom 36 met the threshold (correctly answering at least 4 out of 5 test questions) and were invited to participate in the user study. In total, 21 crowd workers contributed to the study: 6 completed all 5 HITs, 2 completed 3 HITs, 1 completed 2 HITs, and the remainder submitted a single HIT. Data quality was assessed through a control question accompanying each unique response, in which participants identified which aspects from a list were covered. Because a ground-truth set of aspects was available for each response, this served as a quality check. Participants correctly identified aspects in 425 out of 600 cases, indicating high overall data quality. The total cost of the study was $316, including $68 in Amazon Mechanical Turk fees. To further acknowledge high-quality contributions, four workers received a $2 bonus for particularly insightful justifications of their trust decisions.
## 4 Results and Analysis
<details>
<summary>x2.png Details</summary>
### Visual Description
## Horizontal Stacked Bar Chart: Trust Scores by Explanation Type and Condition
### Overview
This image displays a horizontal stacked bar chart comparing "Trust scores" across three different "Explanation types" (Source Attribution, Grounding, Information Coverage). Each explanation type is evaluated under two conditions: "Shown" and "Not shown". The chart visualizes the proportion of respondents' trust in a reliable versus an unreliable response.
### Components/Axes
* **Y-Axis (Vertical):** Labeled "Explanation type". It lists three main categories, each split into two sub-categories:
1. Source Attribution - Not shown
2. Source Attribution - Shown
3. Grounding - Not shown
4. Grounding - Shown
5. Information Coverage - Not shown
6. Information Coverage - Shown
* **X-Axis (Horizontal):** Labeled "Proportion". It has a linear scale from 0.0 to 1.0, with major tick marks at 0.0, 0.2, 0.4, 0.6, 0.8, and 1.0.
* **Legend:** Positioned to the right of the chart, titled "Trust scores". It defines five color-coded categories:
* Dark Blue: "Trust reliable response a lot more"
* Light Blue: "Trust reliable response slightly more"
* Grey: "Trust both responses about the same"
* Light Orange/Peach: "Trust unreliable response slightly more"
* Dark Red: "Trust unreliable response a lot more"
* **Condition Labels:** The text "Not shown" and "Shown" appears to the right of each corresponding bar, aligned with the y-axis categories.
### Detailed Analysis
The chart consists of six horizontal bars, each representing 100% (proportion 1.0) of responses for that condition. The bars are segmented by color according to the legend.
**1. Source Attribution - Not shown:**
* **Trend:** The bar is dominated by the grey ("same") and red ("unreliable a lot more") segments, with smaller blue segments.
* **Approximate Proportions (from left to right):**
* Dark Blue (Reliable a lot more): ~0.08
* Light Blue (Reliable slightly more): ~0.17 (cumulative ~0.25)
* Grey (Same): ~0.25 (cumulative ~0.50)
* Light Orange (Unreliable slightly more): ~0.25 (cumulative ~0.75)
* Dark Red (Unreliable a lot more): ~0.25 (cumulative 1.00)
**2. Source Attribution - Shown:**
* **Trend:** A significant shift towards the blue ("reliable") segments compared to the "Not shown" condition.
* **Approximate Proportions:**
* Dark Blue: ~0.30
* Light Blue: ~0.25 (cumulative ~0.55)
* Grey: ~0.20 (cumulative ~0.75)
* Light Orange: ~0.10 (cumulative ~0.85)
* Dark Red: ~0.15 (cumulative 1.00)
**3. Grounding - Not shown:**
* **Trend:** Similar pattern to "Source Attribution - Not shown", with large grey and red segments.
* **Approximate Proportions:**
* Dark Blue: ~0.05
* Light Blue: ~0.20 (cumulative ~0.25)
* Grey: ~0.25 (cumulative ~0.50)
* Light Orange: ~0.30 (cumulative ~0.80)
* Dark Red: ~0.20 (cumulative 1.00)
**4. Grounding - Shown:**
* **Trend:** Marked increase in the blue segments, particularly the dark blue.
* **Approximate Proportions:**
* Dark Blue: ~0.25
* Light Blue: ~0.25 (cumulative ~0.50)
* Grey: ~0.25 (cumulative ~0.75)
* Light Orange: ~0.10 (cumulative ~0.85)
* Dark Red: ~0.15 (cumulative 1.00)
**5. Information Coverage - Not shown:**
* **Trend:** This bar has the largest dark red segment among all "Not shown" conditions.
* **Approximate Proportions:**
* Dark Blue: ~0.10
* Light Blue: ~0.25 (cumulative ~0.35)
* Grey: ~0.20 (cumulative ~0.55)
* Light Orange: ~0.25 (cumulative ~0.80)
* Dark Red: ~0.20 (cumulative 1.00)
**6. Information Coverage - Shown:**
* **Trend:** Shows the most balanced distribution between trust in reliable and unreliable responses among the "Shown" conditions.
* **Approximate Proportions:**
* Dark Blue: ~0.20
* Light Blue: ~0.35 (cumulative ~0.55)
* Grey: ~0.20 (cumulative ~0.75)
* Light Orange: ~0.10 (cumulative ~0.85)
* Dark Red: ~0.15 (cumulative 1.00)
### Key Observations
1. **Consistent "Shown" Effect:** For all three explanation types, the "Shown" condition results in a substantially larger combined proportion of the two blue segments (trusting the reliable response more) compared to the "Not shown" condition.
2. **Reduction in Extreme Distrust:** The dark red segment ("Trust unreliable response a lot more") is consistently smaller in the "Shown" bars than in their corresponding "Not shown" bars.
3. **Grey Segment Stability:** The grey segment ("Trust both responses about the same") remains relatively stable in size (around 0.20-0.25) across all six bars.
4. **Most Impactful Shift:** The "Source Attribution" type appears to show the most dramatic visual shift from "Not shown" to "Shown", with the dark blue segment roughly tripling in size.
### Interpretation
This chart demonstrates the **positive impact of providing explanations** on user trust calibration. When explanations (Source Attribution, Grounding, or Information Coverage) are shown, users are significantly more likely to appropriately trust a reliable response over an unreliable one. Conversely, when no explanation is shown, a larger proportion of users inappropriately trust the unreliable response more, or are unable to distinguish between them.
The data suggests that **explanations act as a critical signal for reliability**. The consistent pattern across all three types implies this is a general effect of transparency, not specific to one explanation method. The persistence of the grey segment indicates a subset of users remains uncertain regardless of explanation, highlighting a potential area for improving explanation clarity or user education. From a Peircean perspective, the "Shown" conditions provide a clearer **indexical sign** (the explanation) linking the AI's response to its underlying process, thereby allowing users to make a more informed **abductive inference** about which response to trust. This has major implications for designing trustworthy AI systems: providing explanations is not just a feature but a fundamental requirement for enabling users to make sound judgments.
</details>
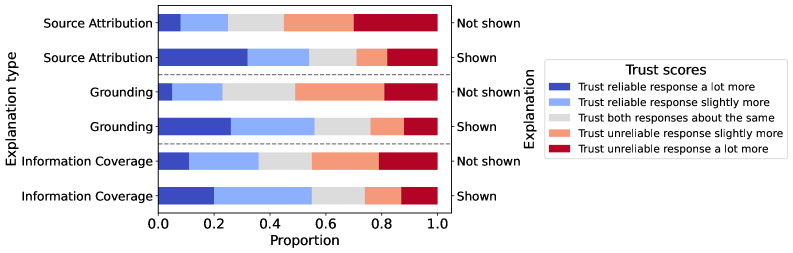
Figure 2: Proportion of user trust judgments for each explanation type, comparing responses with and without explanations. Colors indicate the direction of preference.
Figure 2 presents the distribution of trust preferences across explanation presence and types. Overall, showing explanations increases the likelihood of users selecting the reliable response, which was chosen as more trustworthy in 165/300 cases with explanations compared to 84/300 without. This result clearly indicates that providing explanations helps guide users toward more reliable information.
Delving into how users’ perceptions change, we find that explanations prompted a shift in preference from the unreliable to the reliable response in 69 out of 300 cases. The effect varied by explanation type, with grounding causing the largest shift (27 cases), followed by source attribution (23 cases) and information coverage (19 cases). This variation may also be influenced by the nature of queries: grounding queries were often factual and required information-intensive responses (“I know that there are similar schemes to Ponzi schemes. Can you compare them?”). By contrast, for information coverage queries that are often opinion-based (“What do you think is the best Marvel movie?”), breadth and depth were easily assessed from the response alone.
### Qualitative Analysis.
User justifications reveal a tension between objective quality and the perceived usability of responses. Participants often favored a limited-quality response when it was clearer or more actionable (“Response B gives practical, named resources … which makes the advice more actionable”). Similarly, specific examples frequently boosted perceived trustworthiness regardless of their factuality (“Response A provides clear examples of geographic and economic biases … giving a broad perspective”).
Information coverage also emerged as a recurring theme, though its effects were mixed. Participants valued comprehensive coverage when it was relevant (“Response B covers a broader range including the resignation of aides, which adds depth to the impact”), but viewed it as distracting when it did not directly address the query (“Response B’s focus on a broader view isn’t necessarily helpful, given the query is specifically asking for meat dishes”).
Source attribution was another important factor, though its influence was highly context-dependent. In fact-based domains, sources often tipped the balance (“Without citations, response B’s numbers can’t be verified, while response A’s quoted sources look authoritative”). Yet in subjective queries, participants tended to dismiss their importance (“Sources are not needed for subjective questions”; “I don’t care about response B’s citing of sources, since this is an inherently subjective question”). While preliminary, these findings highlight the need for further investigation into how explanation strategies vary across query types.
Finally, users’ background knowledge shaped trust decisions when they could not easily assess response quality. In such cases, participants either trusted both responses equally (“Without any previous knowledge, there isn’t much that I can really say here. No real difference”) or relied on their own expertise to guide judgments (“… I know for sure response one is factually correct but response two cannot be verified, which makes me even discredit the response more”). Since users’ background knowledge was not explicitly measured in this study, these observations are indicative rather than conclusive and warrant a more systematic and focused analysis of the role of background knowledge in future work.
## 5 Conclusion
We conducted a user study to examine how the presence and type of explanations affect user trust in responses from retrieval-augmented generation systems. Our findings show that users’ trust judgments often diverge from the objective quality of responses, with many favoring limited-quality responses that seem clearer, more detailed, or more actionable. Based on the results of our study, future response generation systems should adapt explanations based on query type and response complexity, use source-based explanations primarily for factual domains, and personalize explanations according to users’ prior knowledge. Future work should also investigate the long-term effects of these explanations on how users’ trust evolves and calibrates over time.
### 5.0.1 Acknowledgements
This research was partially supported by the Norwegian Research Center for AI Innovation, NorwAI (Research Council of Norway, project nr. 309834).
### 5.0.2 Disclosure of Interests.
The authors have no competing interests to declare that are relevant to the content of this article.
## References
- Amershi et al. [2019] Amershi, S., Weld, D., Vorvoreanu, M., Fourney, A., Nushi, B., Collisson, P., Suh, J., Iqbal, S., Bennett, P.N., Inkpen, K., Teevan, J., Kikin-Gil, R., Horvitz, E.: Guidelines for human-AI interaction. In: Proceedings of the 2019 CHI Conference on Human Factors in Computing Systems, pp. 1–13, CHI ’19 (2019)
- Balog and Radlinski [2020] Balog, K., Radlinski, F.: Measuring recommendation explanation quality: The conflicting goals of explanations. In: Proceedings of the 43rd International ACM SIGIR Conference on Research and Development in Information Retrieval, pp. 329–338, SIGIR ’20 (2020)
- Bolotova et al. [2020] Bolotova, V., Blinov, V., Zheng, Y., Croft, W.B., Scholer, F., Sanderson, M.: Do people and neural nets pay attention to the same words: Studying eye-tracking data for non-factoid QA evaluation. In: Proceedings of the 29th ACM International Conference on Information & Knowledge Management, pp. 85–94, CIKM ’20 (2020)
- Cau et al. [2023] Cau, F.M., Hauptmann, H., Spano, L.D., Tintarev, N.: Supporting high-uncertainty decisions through AI and logic-style explanations. In: Proceedings of the 28th International Conference on Intelligent User Interfaces, pp. 251–263, IUI ’23 (2023)
- Draws et al. [2021] Draws, T., Tintarev, N., Gadiraju, U.: Assessing viewpoint diversity in search results using ranking fairness metrics. ACM SIGKDD Explorations Newsletter 23 (1), 50–58 (2021)
- Gao and Shah [2020] Gao, R., Shah, C.: Toward creating a fairer ranking in search engine results. Information Processing & Management 57 (1), 102–138 (2020)
- Gienapp et al. [2024] Gienapp, L., Scells, H., Deckers, N., Bevendorff, J., Wang, S., Kiesel, J., Syed, S., Fröbe, M., Zuccon, G., Stein, B., Hagen, M., Potthast, M.: Evaluating generative ad hoc information retrieval. In: Proceedings of the 47th International ACM SIGIR Conference on Research and Development in Information Retrieval, p. 1916–1929, SIGIR ’24 (2024)
- Hu et al. [2019] Hu, M., Wei, F., Peng, Y., Huang, Z., Yang, N., Li, D.: Read + verify: Machine reading comprehension with unanswerable questions. In: Proceedings of the AAAI Conference on Artificial Intelligence, pp. 6529–6537, AAAI ’19 (2019)
- Huang et al. [2019] Huang, K., Tang, Y., Huang, J., He, X., Zhou, B.: Relation module for non-answerable predictions on reading comprehension. In: Proceedings of the 23rd Conference on Computational Natural Language Learning, pp. 747–756, CoNLL ’19 (2019)
- Izacard and Grave [2021] Izacard, G., Grave, E.: Leveraging passage retrieval with generative models for open domain question answering. In: Proceedings of the 16th Conference of the European Chapter of the Association for Computational Linguistics: Main Volume, pp. 874–880, EACL ’21 (2021)
- Łajewska and Balog [2025] Łajewska, W., Balog, K.: GINGER: Grounded information nugget-based generation of responses. In: Proceedings of the 48th International ACM SIGIR Conference on Research and Development in Information Retrieval, p. 2723–2727, SIGIR ’25 (2025)
- Łajewska et al. [2024] Łajewska, W., Spina, D., Trippas, J., Balog, K.: Explainability for transparent conversational information-seeking. In: Proceedings of the 47th International ACM SIGIR Conference on Research and Development in Information Retrieval, pp. 1040–1050, SIGIR ’24 (2024)
- Lewis et al. [2020] Lewis, P., Perez, E., Piktus, A., Petroni, F., Karpukhin, V., Goyal, N., Küttler, H., Lewis, M., Yih, W.t., Rocktäschel, T., Riedel, S., Kiela, D.: Retrieval-augmented generation for knowledge-intensive NLP tasks. In: Proceedings of the 34th International Conference on Neural Information Processing Systems, pp. 9459–9474, NIPS ’20 (2020)
- Li et al. [2023] Li, L., Zhang, Y., Chen, L.: Personalized prompt learning for explainable recommendation. ACM Transactions on Information Systems 41 (4), 1–26 (2023)
- Li et al. [2024] Li, S., Park, S., Lee, I., Bastani, O.: TRAQ: Trustworthy retrieval augmented question answering via conformal prediction. In: Duh, K., Gomez, H., Bethard, S. (eds.) Proceedings of the 2024 Conference of the North American Chapter of the Association for Computational Linguistics: Human Language Technologies (Volume 1: Long Papers), NAACL-HLT ’24 (2024)
- Liao and Sundar [2022] Liao, Q., Sundar, S.S.: Designing for responsible trust in AI systems: A communication perspective. In: Proceedings of the 2022 ACM Conference on Fairness, Accountability, and Transparency, pp. 1257–1268, FAccT ’22 (2022)
- Liu et al. [2023] Liu, N., Zhang, T., Liang, P.: Evaluating verifiability in generative search engines. In: Findings of the Association for Computational Linguistics: EMNLP 2023, pp. 7001–7025, EMNLP ’23 (2023)
- Nunes and Jannach [2017] Nunes, I., Jannach, D.: A systematic review and taxonomy of explanations in decision support and recommender systems. User Modeling and User-Adapted Interaction 27 (3-5), 393–444 (2017)
- Owoicho et al. [2022] Owoicho, P., Dalton, J., Aliannejadi, M., Azzopardi, L., Trippas, J.R., Vakulenko, S.: TREC CAsT 2022: Going beyond user ask and system retrieve with initiative and response generation. In: The Thirty-First Text REtrieval Conference Proceedings, TREC ’22 (2022)
- Ram et al. [2023] Ram, O., Levine, Y., Dalmedigos, I., Muhlgay, D., Shashua, A., Leyton-Brown, K., Shoham, Y.: In-context retrieval-augmented language models. Transactions of the Association for Computational Linguistics 11, 1316–1331 (2023)
- Rashkin et al. [2021] Rashkin, H., Nikolaev, V., Lamm, M., Aroyo, L., Collins, M.: Measuring attribution in natural language generation models. Computational Linguistics 49 (4), 777–840 (2021)
- Schuster et al. [2023] Schuster, T., Lelkes, A.D., Sun, H., Gupta, J., Berant, J., Cohen, W.W., Metzler, D.: SEMQA: Semi-extractive multi-source question answering. In: Proceedings of the 2024 Conference of the North American Chapter of the Association for Computational Linguistics: Human Language Technologies, pp. 1363–1381, NAACL-HLT ’23 (2023)
- Wang et al. [2024] Wang, S., Zhang, X., Wang, Y., Ricci, F.: Trustworthy recommender systems. ACM Transactions on Intelligent Systems and Technology 15 (4), 1–20 (2024)
- Wang and Yin [2021] Wang, X., Yin, M.: Are explanations helpful? a comparative study of the effects of explanations in AI-assisted decision-making. In: Proceedings of the 26th International Conference on Intelligent User Interfaces, pp. 318–328, IUI ’21’ (2021)
- Xu and Chen [2006] Xu, Y.C., Chen, Z.: Relevance judgment: What do information users consider beyond topicality? Journal of the American Society for Information Science and Technology 57 (7), 961–973 (2006)
- Zhang and Chen [2020] Zhang, Y., Chen, X.: Explainable recommendation: A survey and new perspectives. Foundations and Trends® in Information Retrieval 14 (1), 1–101 (2020)
- Zhang et al. [2020] Zhang, Y., Liao, Q.V., Bellamy, R.K.E.: Effect of confidence and explanation on accuracy and trust calibration in AI-assisted decision making. In: Proceedings of the 2020 Conference on Fairness, Accountability, and Transparency, pp. 295–305, FAT ’20 (2020)