# Visual Generation Unlocks Human-Like Reasoning through Multimodal World Models
**Authors**: Jialong Wu, Xiaoying Zhang, Hongyi Yuan, Xiangcheng Zhang, Tianhao Huang, Changjing He, Chaoyi Deng, Renrui Zhang, Youbin Wu, Mingsheng Long
1]Tsinghua University 2]ByteDance Seed [*]Work done at ByteDance Seed [†]Corresponding authors
(January 27, 2026)
## Abstract
Humans construct internal models of the world and reason by manipulating the concepts within these models. Recent advances in artificial intelligence (AI), particularly chain-of-thought (CoT) reasoning, approximate such human cognitive abilities, where world models are believed to be embedded within large language models. Expert-level performance in formal and abstract domains such as mathematics and programming has been achieved in current systems, which rely predominantly on verbal reasoning as their primary information-processing pathway. However, they still lag far behind humans in domains like physical and spatial intelligence, which require richer representations and prior knowledge. The emergence of unified multimodal models (UMMs) capable of both verbal and visual generation has therefore sparked interest in more human-like reasoning grounded in complementary multimodal pathways, though a clear consensus on their benefits has not yet been reached. From a world-model perspective, this paper presents the first principled study of when and how visual generation benefits reasoning. Our key position is the visual superiority hypothesis: for certain tasks–particularly those grounded in the physical world–visual generation more naturally serves as world models, whereas purely verbal world models encounter bottlenecks arising from representational limitations or insufficient prior knowledge. Theoretically, we formalize internal world modeling as a core component of deliberate CoT reasoning and analyze distinctions among different forms of world models from both informativeness and knowledge aspects. Empirically, we identify and design tasks that necessitate interleaved visual-verbal CoT reasoning, constructing a new evaluation suite, VisWorld-Eval. Through controlled experiments on a state-of-the-art UMM, we show that interleaved CoT significantly outperforms purely verbal CoT on tasks that favor visual world modeling. Conversely, it offers no clear advantage for tasks that do not require explicit visual modeling. Together, these insights and findings clarify the applicability and potential of multimodal world modeling and reasoning for more powerful, human-like multimodal AI. We publicly release our evaluation suite to facilitate further research.
[Project Lead]Jialong Wu at Mingsheng Long at , Xiaoying Zhang at [Project Page] https://thuml.github.io/Reasoning-Visual-World
## 1 Introduction
<details>
<summary>x1.png Details</summary>
### Visual Description
\n
## Diagram: World Models in Human Minds and Multimodal AI Reasoning
### Overview
This image is a technical diagram or infographic illustrating the concept of "World Models" in human cognition and how similar principles are applied to reasoning in Multimodal AI. It is divided into three primary horizontal sections, each with a blue-bordered header. The diagram uses a combination of illustrations, text, equations, and example outputs to draw parallels between human mental processes and AI reasoning capabilities.
### Components/Axes
The diagram is structured into three main sections:
1. **Top Section: "World Models in Human Minds"**
* **Left Sub-section: "World Model: Mental Model of the World"**
* Illustration: A person thinking, with a thought bubble containing a flowchart and a globe.
* Text: "Approximate" and "Feedback" with arrows pointing to a realistic image of Earth.
* **Right Sub-section: "Dual Representations of World Knowledge"**
* Two columns:
* **Left Column: "Verbal/Symbolic Knowledge"**
* Illustration: A person shooting a basketball.
* Mathematical equations: `y = ax² + bx + c` and `F = ma`.
* Text: "Dislike in Daily Life" (in red).
* **Right Column: "Visual/Imagery Knowledge"**
* Illustration: A basketball trajectory diagram over a court.
* A red YouTube play button icon.
* Text: "Prefer in Daily Life" (in green).
2. **Middle Section: "Reasoning with Verbal World Modeling in Multimodal AI"**
* This section is divided into three vertical columns, each with a title and an example.
* **Column 1: "Mathematical Reasoning" & "Puzzle Solving"**
* Contains a math problem and its step-by-step solution.
* Contains a puzzle state description.
* **Column 2: "Travel Planning"**
* Contains a task description and a structured plan with `<think>`, `STATE`, and `ACTION` tags.
* **Column 3: "Everyday Activity Planning"**
* Contains a goal and a sequence of images showing cooking steps.
* Contains a `<think>` block describing the cooking process.
3. **Bottom Section: "Reasoning with Visual World Modeling in Multimodal AI"**
* **Title: "Real-World Spatial Reasoning"**
* **Left:** A question box: "When you took the photo in Figure 1, where was the iron refrigerator located relative to you?" with two small interior photos below.
* **Center & Right:** A sequence of three larger photos showing different views of a room (a doorway, a fireplace, a window). Each photo is accompanied by a `<think>` block of text describing the AI's reasoning process to locate the refrigerator.
### Detailed Analysis / Content Details
**Top Section Content:**
* **Text Transcription:**
* Main Header: "World Models in Human Minds"
* Left Sub-header: "World Model: Mental Model of the World"
* Right Sub-header: "Dual Representations of World Knowledge"
* Labels: "Approximate", "Feedback", "Verbal/Symbolic Knowledge", "Visual/Imagery Knowledge", "Dislike in Daily Life", "Prefer in Daily Life".
* Equations: `y = ax² + bx + c`, `F = ma`.
**Middle Section Content (Verbal World Modeling):**
* **Mathematical Reasoning:**
* **Question:** "If a > 1, then the sum of the real solutions of √(a - √(a + x)) = x is equal to"
* **Response:** "<think> To solve the equation √(a - √(a + x)) = x, let's start by squaring both... (a - √(a + x)) = x² => √(a + x) = a - x². Rearrange to isolate the inner square root term: (a - x²)² = a + x => a² - 2ax² + (x²)² = a + x => x⁴ - 2ax² - x + a² - a = 0 ..."
* **Puzzle Solving:**
* **Text:** "<think>From S at [452, 59], the only available move is West to [359, 59] ......."
* **Travel Planning:**
* **Task:** "Plan a trip with a budget of $1,700."
* **Plan:** "<think>STATE: Initial Budget: $1700, Spent: $0. Day 1: transportation: PENDING. Available: Flight F3573659: $474. ACTION: Plan day 1 transportation. Select Flight F3573659. NEXT STATE: After this action, you've spent $474, leaving you $1226 from your $1700 budget..."
* **Legend:** Green box labeled "State/Observation", Pink box labeled "Action".
* **Everyday Activity Planning:**
* **Goal:** "Cooking tomato and eggs"
* **Text:** "<think>... ACTION: Cook the eggs in the pan. STATE: This action changes the state of the eggs from liquid to a partially cooked state. The eggs are now partially cooked and are being transformed into curds. The heat from the pan cooks the eggs, and the stirring action ensures even cooking..."
**Bottom Section Content (Visual World Modeling):**
* **Question:** "When you took the photo in Figure 1, where was the iron refrigerator located relative to you?"
* **Reasoning Sequence (Transcribed from `<think>` blocks):**
1. "<think>First, let's analyze the images. [...] It's not visible in that initial view, so I need to change my perspective."
2. "The refrigerator is not visible in this 90-degree left turn view, [...] To be thorough, I will also check the view to the right."
3. "[...] My initial turn was 90 degrees left, but the refrigerator isn't at that exact angle. Let's try a smaller turn to the left. [...]"
### Key Observations
1. **Structural Parallelism:** The diagram explicitly parallels human cognitive processes (top section) with AI reasoning frameworks (middle and bottom sections). The "Dual Representations" in humans map to "Verbal World Modeling" and "Visual World Modeling" in AI.
2. **Use of `<think>` Tags:** The AI reasoning examples in both verbal and visual sections are annotated with `<think>` blocks, simulating an internal monologue or chain-of-thought process, mirroring the human "thought bubble" in the top section.
3. **Preference Dichotomy:** The human section highlights a preference for visual/imagery knowledge in daily life ("Prefer in Daily Life") over verbal/symbolic knowledge ("Dislike in Daily Life").
4. **Task Diversity:** The verbal modeling section demonstrates application across diverse domains: abstract math, logistics (travel), and procedural tasks (cooking). The visual section focuses on spatial reasoning.
5. **Iterative Process:** The visual reasoning example shows an iterative, hypothesis-testing approach ("not visible... need to change perspective... try a smaller turn").
### Interpretation
This diagram serves as a conceptual framework arguing that advanced AI, particularly multimodal AI, should emulate the structure of human world models to achieve robust reasoning.
* **Core Thesis:** Human intelligence relies on an internal, approximate world model that integrates both verbal/symbolic and visual/imagery knowledge. The diagram posits that for AI to reason effectively about the real world, it must develop analogous internal models.
* **Relationship Between Elements:** The top section establishes the human cognitive foundation. The middle section shows how AI can use a *verbal* world model (structured states, actions, and symbolic reasoning) to plan and solve problems. The bottom section shows how AI can use a *visual* world model (understanding spatial relationships and perspective from images) to answer questions about the physical world.
* **Underlying Message:** The inclusion of the "Dislike/Prefer" labels suggests that while symbolic reasoning is powerful, grounding AI in visual and experiential knowledge (like human preference) may lead to more intuitive and applicable intelligence. The `<think>` tags are crucial—they indicate that the reasoning process itself, not just the final output, is a key component of the model.
* **Investigative Reading:** The diagram implies that current AI often excels at one type of reasoning (e.g., verbal/symbolic for LLMs) but true "world modeling" requires the integration of both streams, much like the human mind. The travel planning example shows a stateful, grounded process, while the spatial reasoning example shows an embodied, perspective-taking process. Together, they illustrate a move from static pattern recognition towards dynamic, model-based reasoning.
</details>
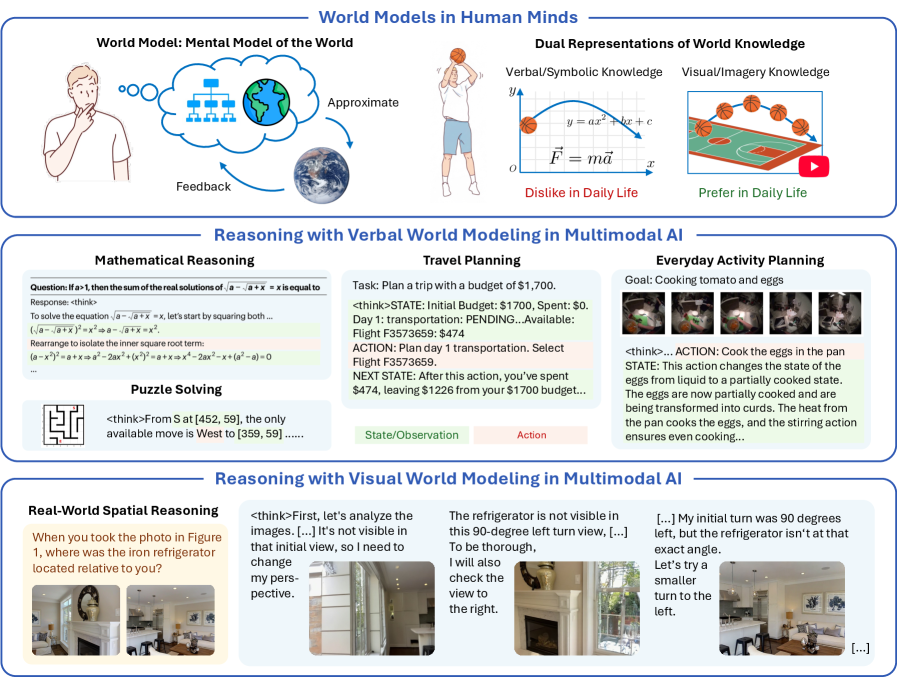
Figure 1: Overview of a world-model perspective on multimodal reasoning. (a) Humans construct mental models of the world, representing information and knowledge through two complementary channels–verbal and visual–to support reasoning, planning, and decision-making. (b) Recent advances in large language models (LLMs) and vision language models (VLMs) largely rely on verbal chain-of-thought reasoning, leveraging primarily verbal and symbolic world knowledge. (c) Unified multimodal models (UMMs) open a new paradigm by using visual generation for visual world modeling, advancing more human-like reasoning on tasks grounded in the physical world. Examples of reasoning with verbal world modeling are adapted from Guo et al. [18], Du et al. [14], Chen et al. [9], Zhang et al. [72].
Humans construct internal mental models of the external world that represent objects and concepts, along with their relationships, structures, and operational mechanisms [11, 16]. These models support reasoning and decision-making by enabling mental simulation, allowing individuals to anticipate the outcome of actions without actually taking them [40]. For example, if a glass of water is spilled on the table, people can rapidly mentally simulate the ensuing events: the water falling downward, spreading across the surface, and potentially dripping onto the floor. Such predictions lead them to quickly move valuable items away or reach for a towel. Beyond physical systems, mental models also extend to any domain where relational structures can be simulated, such as mathematics and logic [31, 32], making them fundamental to how humans understand and interact with all aspects of the world.
Cross-disciplinary researchers in philosophy, psychology, cognitive science, and related fields have a long history of developing computational models of human mental models [44]. Among them, artificial intelligence (AI) shares a core ambition of building machines that reason like people. Although debates remain, recent breakthroughs, especially in large language models (LLMs) and chain-of-thought (CoT) reasoning, have made a substantial step towards approximating human reasoning grounded in mental models of the world, often referred to as world models [24, 34] in the AI literature. During chain-of-thought reasoning, LLMs explore, reflect, and backtrack within the structured solution space, guided by world knowledge acquired through large-scale pre-training. These capabilities have already driven progress in diverse domains, including programming [18], mathematics [57, 18], scientific discovery [53], clinical medicine [58], and robotics [42].
Such reasoning capabilities have also been extended to multimodal AI systems, particularly vision language models (VLMs) [28, 6, 19, 70]. These systems typically incorporate visual inputs by aligning visual representations with the embedding space of LLMs, resulting in reasoning that remains primarily constrained to a linguistic space. In contrast, human mental models operate over multiple forms of mental representations. Dual-coding theory [45] suggests that the mind processes information through two complementary codes: verbal and imagery (particularly visual) representations. These pathways can function independently but often collaborate to support reasoning. Indeed, visual imagery has been shown to have advantages over words in memory encoding and retrieval [33]; and individuals with aphantasia, who lack the ability to visualize mental imagery, exhibit worse performance on tasks such as visual search [43]. These evidence from psychology and cognitive science therefore suggest that the absence of a dedicated visual information pathway may explain why current multimodal AI systems excel in formal and abstract domains dominated by verbal world knowledge, yet continue to fall far short of human performance on tasks involving physical and spatial reasoning [49, 8], which fundamentally depend on visual world modeling.
Next-generation multimodal AI systems are evolving to be built upon unified multimodal models (UMMs) [54, 63, 62, 13], which seamlessly integrate both verbal and visual generation capabilities. The newly introduced visual generation component offers the potential to explicitly realize visual world modeling, a critical element of multimodal world models in human-like reasoning that current systems largely lack. This naturally makes us ponder: Can current UMMs truly leverage their visual generation capability to enhance reasoning and thereby narrow the performance gap between multimodal AI and humans? A growing body of preliminary research [36, 77, 38, 76, 17] has begun exploring this question from different perspectives. However, the findings so far remain inconclusive. Reported empirical results are mixed, showing no consistent trends that visual generation reliably improves reasoning performance. Moreover, the evaluation tasks used in current studies are designed heuristically, lacking a principled basis for understanding when and how visual generation can meaningfully contribute to multimodal reasoning.
In this paper, we present the first principled study of when and how visual generation benefits reasoning from a world-model perspective (see Figure 1), making both theoretical and empirical contributions.
Theoretically, we rigorously bridge the concepts of world models and reasoning. (1) World model formulations: We formulate multimodal world models to approximate the underlying multi-observable Markov decision processes (MOMDP) of tasks, and define two fundamental capabilities of world models, namely world reconstruction and world simulation. (2) World model-based reasoning: To realize world models for reasoning, we introduce three reasoning formulations. Two rely solely on verbal CoTs through implicit or verbal world modeling, while the third interleaves verbal and visual CoTs that explicitly incorporate visual generation as a form of visual world modeling. (3) The visual superiority hypothesis: Under this framework, we analyze the distinctions among different world models, highlighting the richer informativeness and complementary prior knowledge afforded by visual world modeling. These insights motivate our central hypothesis that visual world modeling is superior for certain tasks, particularly those grounded in the physical world.
Empirically, we validate these insights through a series of controlled experiments. (4) The VisWorld-Eval suite: We identify and design tasks that specifically isolate and demand each atomic world model capability, forming a new evaluation suite to facilitate future research. This suite, VisWorld-Eval, collects seven tasks spanning both synthetic and real-world domains. (5) Empirical evaluation: Experiments with a state-of-the-art UMM [13] on VisWorld-Eval reveal findings consistent with our insights and theoretical analysis. In tasks where verbal world modeling suffers from representational bottlenecks or insufficient prior knowledge, interleaved CoT delivers substantial performance improvements. By contrast, it offers no clear advantages in tasks such as mazes and Sokoban, whose simple states do not require explicit visual world modeling. We further conduct dedicated analyses, including evidence revealing emergent implicit world modeling in the maze task.
We hope this work provides early evidence for the central role of multimodal world models in general-purpose AI, in which complementary verbal and visual knowledge emerge from generative modeling across modalities, with the latter being especially valuable for bringing human-like intelligence into the physical world.
## 2 Related Work
World models. The field of world models is rapidly evolving, yet remains far from reaching consensus on definitions or methodologies. Although psychology and cognitive science suggest that human mental models rely on compact representations that discard irrelevant details, how to scale approaches capable of learning such abstract representations [48, 26, 34] to arbitrary domains and modalities is still unclear. Consequently, most current techniques preserve complete information of observations, either through reconstructable latent representations [24, 25] or directly at the level of raw data. Prominent examples include modern video generation world models [12, 1, 2, 64] which capture concrete pixel-level dynamics. In contrast, language inherently provides a higher level of abstraction, making it more similar to human mental representations [60, 65, 59, 71, 9]. This motivates the promise of unified multimodal models that generate both languages and visuals as a new direction for building more human-like world models.
Unified multimodal models. Multmodal understanding [28, 6, 19] and visual generation [47, 50] have long developed in isolation. Recently, there has been growing interest in integrating these two capabilities into a single unified model. This can be straightforwardly achieved by forwarding the representations of vision language models to an external visual generation module [56, 46]. A more unified approach is to model both language and visual modalities within a single backbone. While language is predominantly modeled through autoregressive next-token prediction, the design space of visual modalities spans a wide spectrum, from discrete tokenization with autoregressive [62, 54, 63] or masked modeling [66, 22], to continuous tokenization with diffusion or flow-based modeling [75, 41, 13]. Among these efforts, BAGEL [13] is one of the most widely adopted open-source models achieving state-of-the-art performance. Despite substantial progress in building unified multimodal models (UMMs), existing evaluations still primarily assess their understanding and generation capabilities separately. One widely recognized advantage of UMMs lies in leveraging reasoning abilities of handling complex instructions to enhance visual generation or editing [74, 21]. Yet when and how visual generation, in turn, enhances reasoning remains insufficiently explored, lacking solid empirical evidence and community consensus.
Benchmarking visual generation for reasoning. This paper contributes to a growing line of research on visual generation for reasoning. RealUnify [52] and Uni-MMMU [77] design tasks in which generation is expected to enhance reasoning, but report mixed results without revealing clear trends regarding the benefits of visual generation. ROVER [38] reveals fundamental limitations of current models in generating meaningful visual reasoning steps, often resulting in minimal or even negative gains in final accuracy. In contrast, MIRA [76] conducts a sanity test by providing manually annotated visual cues, thereby bypassing the evaluation of visual world modeling capability. While the aforementioned works evaluate zero-shot performance, ThinkMorph [17] fine-tunes UMMs to reveal emergent reasoning behaviors but restricts each CoT to a single intermediate image, thereby not fully exploiting the potential of interleaved CoT. Our work distinguishes itself through a world-model perspective that enables a principled investigation, allowing us to both demonstrate and systematically explain when visual generation yields positive gains and when it does not.
## 3 A World Model Perspective on Multimodal Reasoning
Inspired by the aforementioned connections between human cognition and artificial intelligence, we formalize our world-model perspective on multimodal reasoning (see Figure 2) in this section.
### 3.1 Formulation: Multiple Observations of the World
Without loss of generality, the world of a specific task can be formulated as a multi-observable Markov decision process (MOMDP) $\mathcal{M}=(\mathcal{S},\mathcal{A},p,\Phi,\mathcal{O}_{\phi},e_{\phi})$ , where $\mathcal{S}$ denotes the state space, $\mathcal{A}$ the action space, $p$ the transition function, $\Phi$ the parameter space of observation functions, $\mathcal{O}_{\phi}$ the observation space, and $e_{\phi}$ the observation function. Each $s\in\mathcal{S}$ represents the underlying state of the world, which is typically hidden and not directly observable. Instead, it can be perceived through different instantiations of observations (hereafter also referred to as views) [27], given by $o=e_{\phi}(s)\in\mathcal{O}_{\phi}$ , parameterized by $\phi\in\Phi$ . As illustrated in Figure 2 a, such views can span multiple modalities—for example, visual observations corresponding to different camera poses, or verbal descriptions expressed with different emphases or styles. When an action $a\in\mathcal{A}$ is applied to the current state, the world transits according to the dynamics $s^{\prime}\sim p(s^{\prime}|s,a)$ and yields new observations.
### 3.2 Atomic Capabilities of World Models
<details>
<summary>x2.png Details</summary>
### Visual Description
## Diagram: World Model Capabilities and Formulations
### Overview
This image is a technical diagram illustrating the concept of "World Models" in artificial intelligence, specifically focusing on their atomic capabilities (reconstruction and simulation) and their application in chain-of-thought reasoning. The diagram is divided into three horizontal panels, each exploring a different facet of the concept using a consistent example of 3D cube structures.
### Components/Axes
The diagram is structured into three main panels, each with a blue header:
1. **Top Panel: "Multiple Observations of the World"**
* **Left Section:** Shows a 3D cube structure (an L-shape with an inverted L on top) and two types of observations:
* **Verbal Observations:** Text descriptions: "A stack of cubes with an L-shaped front view and an inverted L-shaped right view." and "A stack of unit cubes positioned at (0,0,0), (1,0,0), (0,1,0), and (0,0,1)."
* **Visual Observations:** Four 2D line-drawing projections of the cube stack from different angles.
* **Right Section:** A diagram titled **"Multi-Observable Markov Decision Process"**.
* **Components:** A state circle (`s`), an action circle (`a`), and a next state circle (`s'`). Arrows indicate transitions.
* **Observations:** Above the state circles are observation nodes (`o_φ1`, `o_φ2`, `o_φ3` for state `s`; `o'_φ1`, `o'_φ2`, `o'_φ3` for state `s'`), indicating multiple observation types for each state.
* **Legend/Labels:** "Observations" (top), "State" (below `s`), "Action" (below `a`).
2. **Middle Panel: "Atomic Capabilities of World Models"**
* **Left Sub-panel: "World Reconstruction"**
* **Inputs:** Three 2D views labeled "Top view", "Front view", "Right view".
* **Process:** Arrows point from the views into a central pink box labeled "World Model".
* **Outputs:** Arrows point from the "World Model" to:
1. A 3D reconstruction of the cube stack.
2. A "Back view" (2D projection).
3. A coordinate list: "(0,0,0), (1,0,0), (0,1,0), (0,0,1)".
* **Right Sub-panel: "World Simulation"**
* **Inputs:** Three different starting states (a 3D cube stack, a 2D view, and a coordinate list).
* **Process:** Each input has an arrow pointing to a pink "World Model" box.
* **Outputs:** Each "World Model" box has an arrow pointing to a predicted next state:
1. A new 3D cube configuration.
2. A new 2D view.
3. A new coordinate list: "(0,0,0), (1,0,0), (0,1,0), (0,0,1), (2,0,0)".
3. **Bottom Panel: "World Model-Based Chain-of-Thought Formulations"**
* **Problem Statement:** A user icon asks: "Given the three views of a cube stack [icon] [icon] [icon], how can we modify the stack to match the desired back view [icon]?"
* **Process Flow:** A robot icon initiates a flowchart with two main phases, connected by red dashed lines indicating feedback loops.
* **Phase 1: "World Reconstruction"** (Left side, blue background)
* Steps: "Top view", "Front view", "Right view" → "Reconstruct the full structure" (3D icon) → "Imagine the back view" (2D icon).
* **Phase 2: "World Simulation"** (Right side, pink background)
* Steps: "Try put a new cube" (3D icon) → "Imagine the back view" (2D icon) → Decision point: "Wait, retry another choice" (loops back) or proceed.
* **Final Output:** An arrow leads to "Get the answer: Put at (2,0,0)".
### Detailed Analysis
* **Cube Structure:** The primary example is a 4-cube structure. Its verbal description and coordinate list define it as occupying positions (0,0,0), (1,0,0), (0,1,0), and (0,0,1) in a 3D grid.
* **World Model Functions:**
* **Reconstruction:** The model takes multiple 2D perspectives (top, front, right) as input and infers the complete 3D structure, its other 2D projections (back view), and its explicit coordinate representation.
* **Simulation:** The model takes a current state (in any representation: 3D, 2D, or coordinates) and an implied action (e.g., "add a cube") to predict the resulting future state. The example shows adding a cube at (2,0,0).
* **Chain-of-Thought Logic:** The bottom panel demonstrates a problem-solving loop. The agent first reconstructs the current object from given views. It then simulates potential actions (adding a cube), imagines the resulting back view, and compares it to the target. If mismatched, it loops back to try a different action. The solution is to place a cube at coordinate (2,0,0).
### Key Observations
1. **Multi-Modal Representation:** The diagram emphasizes that a "world" can be represented interchangeably as 3D models, 2D views, or numerical coordinates. The World Model operates across these modalities.
2. **MDP Integration:** The top-right explicitly frames the problem within a Multi-Observable Markov Decision Process, where a single underlying state (`s`) can produce multiple observation types (`o_φ`).
3. **Feedback-Driven Reasoning:** The chain-of-thought process is not linear but iterative, using simulation and imagination ("Imagine the back view") to test hypotheses before committing to an action.
4. **Consistent Example:** The same 4-cube L-shaped structure is used throughout all panels, providing a concrete thread to understand the abstract concepts.
### Interpretation
This diagram argues that robust AI reasoning about the physical world requires two core, interconnected capabilities: **reconstruction** (building an internal model from partial sensory data) and **simulation** (predicting the consequences of actions within that model). The "World Model" is presented as the central engine enabling both.
The **Peircean investigative reading** suggests the diagram is making a case for a specific architecture of intelligence:
* **The Sign (Representation):** The cube in its various forms (3D, 2D, coordinates) is the representational sign.
* **The Object (The Actual World):** The true, complete 3D structure is the object the signs point to.
* **The Interpretant (The Reasoning Process):** The chain-of-thought flowchart is the interpretant—the process of using signs (reconstructions) and predictive models (simulations) to derive meaning and solve problems. The feedback loops are critical, showing that understanding is an active, abductive process of hypothesizing and testing.
The practical implication is that for an AI to answer a question like "how do I change this object to look like that?", it cannot rely on pattern matching alone. It must first *understand* the current state (reconstruction), then *imagine* the effects of its actions (simulation), and use that internal simulation to guide its physical or logical intervention. The coordinate "(2,0,0)" is not just an answer; it's the output of a simulated experiment conducted within the model's internal world.
</details>
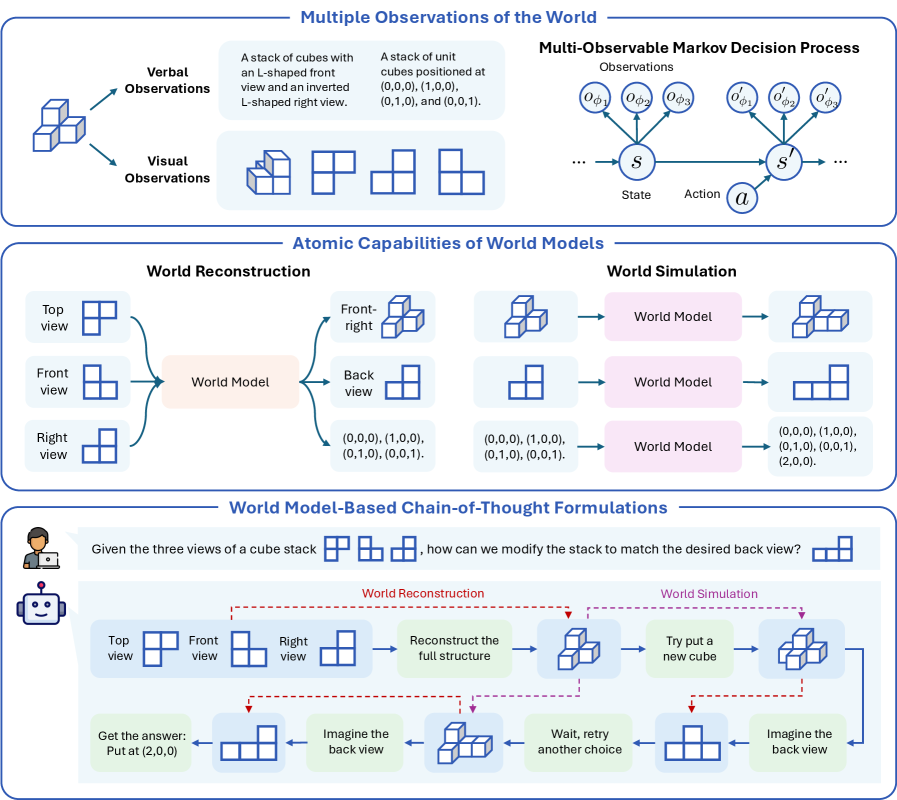
Figure 2: Theoretical formulation of the world model perspective on multimodal reasoning. (a) Observations of the same underlying world state can span multiple modalities, including verbal and visual observations, each reflecting different views or emphases. (b) Two atomic capabilities of world models are defined: world reconstruction, which infers complete structure from partial observations and enables novel view synthesis, and world simulation, which models dynamics to predict future observations. (c) Chain-of-thought reasoning includes internal world modeling, by explicitly maintaining an evolving sequence of observations, generated through either of the atomic world model capabilities.
A world model, analogous to human mental models, is then expected to support two fundamental capabilities [34], illustrated in Figure 2 b. The first is called world reconstruction. Humans are remarkably skilled at mentally reconstructing the structure of an environment from only a few partial observations [71], grounded in their prior knowledge of the world. Such mental reconstruction allows them to imagine novel views of the same underlying state, supporting skills such as mental rotation. Formally, the perception component of a world model encodes $n$ observations from limited views into an internal representation: $\hat{s}=\operatorname{enc}(o_{\phi_{1}},\dots,o_{\phi_{n}})\approx s$ . This representation approximates the true state We set aside the debate between compact and comprehensive representations. By treating abstract (e.g., sketches) and high-fidelity observations as different view specifications, this formulation allows the internal representation to flexibly adjust to the level of detail required by the desired views., and can then be decoded to generate an unseen observation: $\hat{o}_{\phi_{n+1}}=\mathrm{dec}(\hat{s},\phi_{n+1})\approx e_{\phi_{n+1}}(s)$ , providing an internal "experience" of navigating the world. In modern generative models, including UMMs, since their latent representations are not explicitly defined, the world reconstruction capability can be realized through end-to-end novel view generation:
$$
\displaystyle p_{\theta}(o_{\phi_{n+1}}\mid o_{\phi_{1}},\dots,o_{\phi_{n}}), \tag{1}
$$
which implicitly learns the internal representations required to synthesize the new view.
The second capability is world simulation. Humans can mentally simulate how the world evolves into the future, supporting reasoning and decision-making, either purely in their minds or with external aids such as a scratchpad. Formally, this corresponds to the prediction component of a world model, which predicts the transition of the current state and action: $\hat{s}^{\prime}\sim\operatorname{pred}(\hat{s},a)$ , providing an internal "experience" of interacting with the world. Similarly, for modern generative models, this capability is more typically realized through predictions of future observations:
$$
\displaystyle p_{\theta}(o_{t+1}\mid o_{\leq t},a_{\leq t}). \tag{2}
$$
In our new evaluation suite, we deliberately curate tasks that specifically demand each capability, allowing us to independently validate its contribution to multimodal reasoning (see Section 4.1).
### 3.3 Deliberate Reasoning with World Modeling Across Modalities
We then formalize how world-modeling capabilities within multimodal models contribute to reasoning. Given a question $Q$ and input images $I$ , the chain-of-thought reasoning process of a multimodal AI system can be expressed as a sequence of intermediate steps (or thoughts) $R=\tau_{1},\tau_{2},\dots,\tau_{H}$ , followed by the answer $A$ . Although this general formulation treats each reasoning step $\tau_{i}$ as an unconstrained, free-form operation, our world model perspective suggests that humans reason by prediction and planning, and each step inherently manipulates the underlying world observations of the problem [59, 10, 72]. We therefore refine the reasoning formulation as $\tau_{i}=(r_{i},o_{i})$ to explicitly incorporate an evolving sequence of observations:
$$
\displaystyle R=\left(r_{1},o_{1}\right),\left(r_{2},o_{2}\right),\dots,\left(r_{H},o_{H}\right), \tag{3}
$$
where $r_{i}$ We use $i$ to index reasoning steps in order to distinguish them from the true time step $t$ of the underlying MOMDP. The twos are not generally aligned, as we may include branching and backtracking in the reasoning. denotes a logical reasoning step based on the accumulated context, typically expressed in text, and $o_{i}$ denotes the observation generated at that step. Specifically, the input images serve as the initial observation $o_{0}=I$ , and subsequent observations are generated from previous reasoning and observations, by invoking atomic world modeling capabilities: world reconstruction (Eq. (1)) and world simulation (Eq. (2)), where reasoning steps imply actions $a$ and view transformations $\phi$ , as illustrated in Figure 2 c.
This formulation is modality-agnostic, allowing observations—and thus world modeling—to arise across various modalities. We focus specifically on verbal and visual observations, motivated by dual-coding theory in human cognition and by the fact that UMMs are equipped to generate both. This yields several concrete CoT instantiations. Specifically, verbal world modeling produces purely verbal CoTs, with $o_{i}$ as verbal descriptions, whereas visual world modeling produces verbal-visual interleaved CoTs, with $o_{i}$ as generated images. In addition, prior work has discovered that language models can implicitly learn world models with emergent internal representations of board-game states without explicit supervision [37]. Motivated by this, we also consider implicit world modeling, in which no explicit observation is generated ( $o_{i}=\emptyset$ ) In practice, strictly distinguishing implicit from verbal world modeling can be difficult, because there are often partial descriptions of the current state in the reasoning part $r_{i}$ . In this work, we treat verbal world modeling as explicitly expressing world states or observations in text, such as coordinates or symbolic matrices..
### 3.4 The Visual Superiority Hypothesis
Contemporary LLMs and VLMs have achieved impressive performance in structured and abstract domains, such as mathematics and programming, largely driven by large-scale language-centric pre-training and verbal chain-of-thought post-training. Although these models have accumulated extensive verbal and symbolic knowledge, their understanding of the visual world remains limited when trained under purely verbal supervision. As a result, they continue to struggle with tasks grounded in basic physical and spatial intuition that even young children naturally master [49, 8].
Visual world modeling is therefore essential for endowing multimodal AI with complementary forms of information and knowledge. (1) In terms of informativeness, while verbal and symbolic representations capture high-level semantic abstractions, they often suffer from ambiguity and representational bottlenecks. In contrast, visual observations are more concrete and information-rich, directly encoding physical properties such as motion and spatial relationships. This provides precise, fine-grained grounding for reasoning about the complex real world, particularly in spatial and physical tasks. (2) In terms of prior knowledge, visual world knowledge is inherently complementary to symbolic knowledge. Humans and animals acquire much of this knowledge (e.g., physical interactions and spatial transformations) through perception, largely independent of language. Consequently, humans naturally represent and communicate such knowledge visually—for example, by sketching an approximate parabolic trajectory without performing explicit calculations. This suggests that different aspects of world knowledge are concentrated in different data modalities, and learning from large-scale generative modeling of visual data can thereby expand the effective knowledge landscape available for multimodal reasoning.
We next formalize and justify these insights through theoretical analysis, with formal statements and proofs provided in Appendix 7.
Informativeness. For notational convenience, we denote the question $Q$ as $r_{0}$ , the input images as $o_{0}$ , and the final answer as $r_{H+1}$ . Prefixes of a CoT are defined as $R_{i}=(r_{0},o_{0},r_{1},o_{1},\dots,r_{i-1},o_{i-1}),\tilde{R}_{i}=(r_{0},o_{0},r_{1},o_{1},\dots,r_{i-1},o_{i-1},r_{i})$ . We use $\mathbb{H}(\cdot)$ and $\mathbb{I}(\cdot;\cdot)$ to denote Shannon entropy and mutual information, respectively. We first establish that the end-to-end answer error admits an upper bound that naturally decomposes into reasoning and world-modeling errors.
**Theorem 1**
*Let $p$ denote the distribution over optimal chain-of-thoughts and answers, and let $p_{\theta}$ be a learned reasoning model. Then the following inequality holds:
$$
\displaystyle\operatorname{KL}(p(A\mid Q,I)\mid\mid p_{\theta}(A\mid Q,I)) \displaystyle\leq\operatorname{KL}(p(R,A\mid Q,I)\mid\mid p_{\theta}(R,A\mid Q,I)) \displaystyle= \displaystyle\sum_{i=1}^{H+1}\underbrace{\mathbb{E}_{p}\left[\operatorname{KL}(p(r_{i}|R_{i})\mid\mid p_{\theta}(r_{i}|R_{i}))\right]}_{\textnormal{reasoning errors}}+\sum_{i=1}^{H}\underbrace{\mathbb{E}_{p}\left[\operatorname{KL}(p(o_{i}|\tilde{R}_{i})\mid\mid p_{\theta}(o_{i}|\tilde{R}_{i}))\right]}_{\textnormal{world-modeling errors}}. \tag{4}
$$*
This decomposition reveals a fundamental trade-off between the informativeness of world models for reasoning and the fidelity of the world model itself. In the case of implicit world modeling, where $o_{i}=\emptyset$ , we get rid of the world-modeling error. However, this typically comes at the cost of increased uncertainty and learning difficulty in reasoning, as all state transitions must be implicitly encoded. Empirically, world models that explicitly track the task states, serving as verbal or visual sketchpads, are generally beneficial for reasoning. We dive into the reasoning component of Eq. (4) to elucidate the factors underlying these benefits.
**Theorem 2**
*Let $s_{i}$ denote the latent states associated with the observations $o_{i}$ . Under appropriate assumptions, the reduction in reasoning uncertainty achieved by explicit world modeling satisfies the following properties:
1. Reasoning uncertainty does not increase: $\mathbb{H}(r_{i}|o_{0},r_{0:i-1})-\mathbb{H}(r_{i}|R_{i})=\mathbb{I}(o_{1:i-1};r_{i}|o_{0},r_{0:i-1})\geq 0.$
1. The reasoning uncertainty improvement is bounded by both (i) the information that observations provide about the underlying states and (ii) the information that the reasoning step requires about those states:
$$
\mathbb{I}(o_{1:i-1};r_{i}|o_{0},r_{0:i-1})\leq\min\left(\mathbb{I}(o_{1:i-1};s_{1:i-1}),\mathbb{I}(r_{i};s_{0:i-1},r_{0:i-1})\right). \tag{5}
$$*
The uncertainty of the target distribution is closely related to sample efficiency and learning difficulty. Consequently, the upper bound on the improvement of reasoning uncertainty (Eq. (5)) highlights another trade-off in the choice of observation modality for world modeling. The first term indicates that observations should be sufficiently informative about the underlying latent states. In contrast, the second suggests that they need only preserve the task-relevant aspects of the states required to select appropriate reasoning steps. Excessively detailed observations may be unnecessary and even detrimental, increasing world modeling errors.
Prior knowledge. Although visual world models are more informative, they are intrinsically more difficult to learn from scratch due to the high dimensionality and complexity of visual observations. Fortunately, modern AI systems are typically large-scale pre-trained, which endows them with strong prior knowledge and enables faster convergence and improved generalization during downstream post-training. As discussed earlier, humans tend to represent different aspects of world knowledge through different modalities. Consequently, for a given downstream task, the distribution shift between its transition distribution and that learned during large-scale Internet pre-training can vary substantially across modalities. The generalization bound in Theorem 6 of Appendix 7.2 suggests that this modality-dependent distribution shift is closely related to the post-training sample efficiency of the corresponding world model. This highlights the importance of acquiring broad prior knowledge across modalities during pre-training, and of leveraging the proper modality whose priors are best aligned with the downstream task.
Drawing on the above analysis, we formulate our central hypothesis regarding when and how visual generation benefits reasoning, thereby helping narrow the gap between multimodal AI and human capabilities.
The Visual Superiority Hypothesis: In multimodal reasoning tasks grounded in the physical world, visual generation as a world model yields representations that are more informative and knowledge-rich than those produced by verbal world models.
## 4 Experiment Settings
Finally, we empirically validate the insights and theoretical analyses presented above through a series of controlled experiments. In this section, we describe the evaluation tasks and model training procedures.
### 4.1 VisWorld-Eval: Task Suite for Reasoning with Visual World Modeling
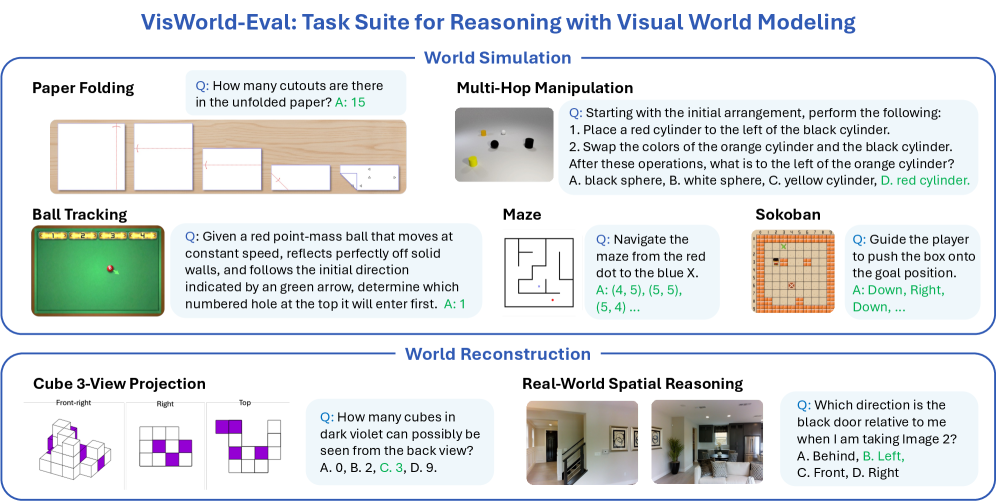
While prior work has primarily designed evaluation tasks heuristically, we principledly evaluate multimodal reasoning across tasks designed to specific world model capabilities. Building on related benchmarks, we identify and curate a total of seven tasks, forming an evaluation suite tailored to assess reasoning with visual world modeling. All tasks are framed as question answering with concise, verifiable answers, and performance is measured by answer accuracy. We refer to this suite as VisWorld-Eval, and summarize it in Figure 3.
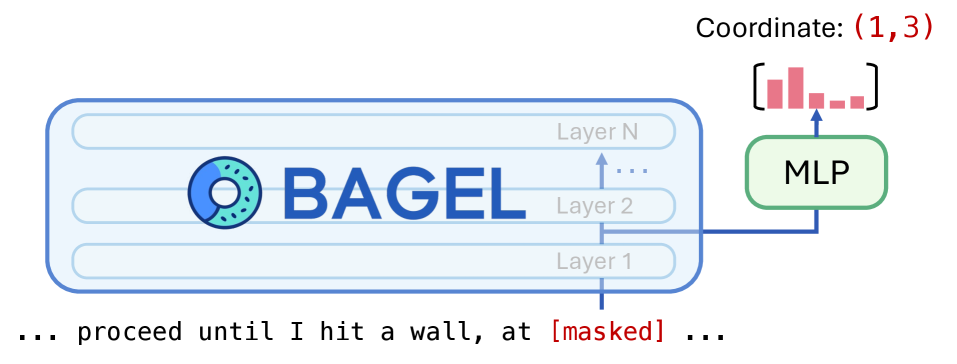
World simulation. We consider the following tasks that primarily require simulating world dynamics over time: (1) Paper folding: Adapted from SpatialViz-Bench [61], this task presents a sequence of paper folds followed by hole punching, and asks for the distribution of holes after the paper is unfolded. Successfully solving this task requires simulating the unfolding process, relying on prior knowledge of symmetry and spatial transformations that is commonly grounded in visual experience. (2) Multi-hop manipulation: Build upon CLEVR [30], this task features a scene containing objects with various shapes and colors that undergo a sequence of operations, such as addition, removal, or color changes. The final question queries properties of the resulting layouts. Since target objects of operations are often specified via relative spatial relationships, this task places strong demands on state tracking and spatial understanding. (3) Ball tracking: Adapted from RBench-V [20], this task evaluates physical dynamics simulation by requiring the model to infer the trajectory of a ball undergoing ideal specular reflections within a given scene and predicting which numbered hole it will ultimately enter. In addition, we include (4) Maze [29] and (5) Sokoban [55], as these two grid-world tasks are commonly used in prior work of studying visual generation for reasoning [67, 36].
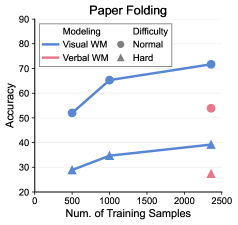
World reconstruction. We also evaluate tasks that emphasize reconstructing underlying world structure from partial observations: (6) Cube 3-view projection: Adapted from SpatialViz-Bench [61], this task provides an isometric view and two orthographic views of a connected cube stack, and asks about an unseen viewpoint. Solving the task requires reconstructing the full 3D structure and mentally rotating or projecting it into the queried view, a process closely aligned with human visual mental representations. (7) Real-world spatial reasoning: We focus on the positional relationship subset of MMSI-Bench [69]. Given multiple views of a realistic scene, these tasks ask about positional relationships among the cameras, objects, and regions. Successfully answering these questions requires constructing a coherent spatial mental model of the scene from limited viewpoints to support accurate spatial reasoning.
For each task, we construct SFT data by designing different CoT patterns with implicit, verbal, or visual world modeling, enabling controlled comparative evaluations. Data construction pipeline and examples across tasks are presented in Appendix 8.1.
<details>
<summary>x3.png Details</summary>
### Visual Description
## Diagram: VisWorld-Eval Task Suite for Reasoning with Visual World Modeling
### Overview
The image is an informational diagram or infographic presenting "VisWorld-Eval," a task suite designed for evaluating reasoning capabilities involving visual world modeling. The diagram is organized into two primary sections: "World Simulation" and "World Reconstruction." Each section contains multiple example tasks, each presented with a title, a visual representation, a question (Q), and an answer (A). The overall design uses a clean, academic style with blue section headers and task titles.
### Components/Sections
The diagram is structured as follows:
1. **Main Title:** "VisWorld-Eval: Task Suite for Reasoning with Visual World Modeling" (centered at the top).
2. **Section 1: World Simulation** (top half, enclosed in a blue-bordered box).
* Contains five distinct tasks: Paper Folding, Multi-Hop Manipulation, Ball Tracking, Maze, and Sokoban.
3. **Section 2: World Reconstruction** (bottom half, enclosed in a blue-bordered box).
* Contains two distinct tasks: Cube 3-View Projection and Real-World Spatial Reasoning.
### Detailed Analysis / Content Details
#### **Section 1: World Simulation**
* **Task 1: Paper Folding** (Top-left)
* **Visual:** A sequence of four images showing a piece of paper being folded and cut.
* **Question (Q):** "How many cutouts are there in the unfolded paper?"
* **Answer (A):** "15" (displayed in green text).
* **Task 2: Multi-Hop Manipulation** (Top-right)
* **Visual:** A top-down view of a scene with several colored 3D objects (cylinders, spheres) on a gray surface.
* **Question (Q):** "Starting with the initial arrangement, perform the following: 1. Place a red cylinder to the left of the black cylinder. 2. Swap the colors of the orange cylinder and the black cylinder. After these operations, what is to the left of the orange cylinder?"
* **Answer (A):** "D. red cylinder." (The correct option is highlighted in green).
* **Task 3: Ball Tracking** (Middle-left)
* **Visual:** A green rectangular field with a red ball and a green arrow indicating its initial direction. The top edge has numbered holes (1 through 5).
* **Question (Q):** "Given a red point-mass ball that moves at constant speed, reflects perfectly off solid walls, and follows the initial direction indicated by a green arrow, determine which numbered hole at the top it will enter first."
* **Answer (A):** "1" (displayed in green text).
* **Task 4: Maze** (Center)
* **Visual:** A simple line-drawn maze with a red dot at the entrance and a blue 'X' at the goal.
* **Question (Q):** "Navigate the maze from the red dot to the blue X."
* **Answer (A):** "(4, 5), (5, 5), (5, 4) ..." (displayed in green text, indicating a sequence of coordinates).
* **Task 5: Sokoban** (Middle-right)
* **Visual:** A grid-based puzzle game screenshot showing a player character, boxes, and goal positions.
* **Question (Q):** "Guide the player to push the box onto the goal position."
* **Answer (A):** "Down, Right, Down, ..." (displayed in green text, indicating a sequence of moves).
#### **Section 2: World Reconstruction**
* **Task 6: Cube 3-View Projection** (Bottom-left)
* **Visual:** Three orthographic projection views of a 3D cube structure, labeled "Front-right," "Right," and "Top." The cubes are white with some faces colored dark violet.
* **Question (Q):** "How many cubes in dark violet can possibly be seen from the back view?"
* **Answer (A):** "C. 3." (The correct option is highlighted in green).
* **Task 7: Real-World Spatial Reasoning** (Bottom-right)
* **Visual:** Two photographs of an indoor living room scene, labeled "Image 1" and "Image 2," taken from different perspectives.
* **Question (Q):** "Which direction is the black door relative to me when I am taking Image 2?"
* **Answer (A):** "B. Left." (The correct option is highlighted in green).
### Key Observations
1. **Task Diversity:** The suite covers a wide range of reasoning types: spatial manipulation (Paper Folding, Multi-Hop Manipulation), physics prediction (Ball Tracking), path planning (Maze, Sokoban), geometric projection (Cube 3-View), and egocentric spatial understanding (Real-World Spatial Reasoning).
2. **Answer Format:** Answers are presented in different formats depending on the task: numerical (15, 1), multiple-choice (D, C, B), coordinate sequences, and action sequences.
3. **Visual Grounding:** Every task is paired with a specific visual input (diagram, simulation screenshot, or photograph) that is essential for solving the problem.
4. **Language:** All primary text (titles, questions, instructions) is in English. No other languages are present in the image.
### Interpretation
This diagram serves as a high-level overview of a benchmark designed to test artificial intelligence systems on complex visual reasoning. The tasks are not simple pattern recognition; they require an internal model of how objects behave in space and time (World Simulation) or how 3D scenes relate to 2D representations (World Reconstruction).
The "World Simulation" tasks test an agent's ability to mentally simulate the consequences of actions (folding, moving objects, ball physics, navigation) within a defined visual environment. The "World Reconstruction" tasks test the ability to infer 3D structure from 2D views or to understand spatial relationships from a changing first-person perspective.
The inclusion of both synthetic (e.g., Maze, Sokoban) and real-world (photographs) visual inputs suggests the benchmark aims to evaluate generalization across domains. The variety in answer formats indicates it assesses not just the correct outcome but also the ability to generate precise procedural knowledge (paths, move sequences). Overall, VisWorld-Eval appears to be a comprehensive test for embodied AI or advanced visual reasoning systems that need to interact with or understand dynamic visual worlds.
</details>
Figure 3: The VisWorld-Eval suite for assessing multimodal reasoning with visual world modeling. VisWorld-Eval comprises seven tasks spanning both synthetic and real-world domains, each designed to isolate and demand specific atomic world-model capabilities.
Table 1: Zero-shot evaluation of advanced VLMs on VisWorld-Eval. We report the average accuracy over five tasks (excluding Maze and Sokoban) and over all seven tasks.
| Models | Paper Folding | Multi-Hop Manip. | Ball Tracking | Cube 3-View | MMSI (Pos. Rel.) | Maze | Sokoban | Overall (5 tasks) | Overall (7 tasks) |
| --- | --- | --- | --- | --- | --- | --- | --- | --- | --- |
| Proprietary Models | | | | | | | | | |
| Gemini 3 Flash | 25.6 | 75.4 | 55.3 | 52.7 | 41.3 | 73.9 | 99.3 | 50.0 | 60.5 |
| Gemini 3 Pro | 27.0 | 74.5 | 44.7 | 53.3 | 49.6 | 33.5 | 90.2 | 49.8 | 53.2 |
| Seed 1.8 | 10.6 | 75.2 | 24.4 | 42.5 | 38.8 | 83.9 | 68.3 | 38.3 | 49.1 |
| GPT 5.1 | 6.4 | 73.9 | 34.8 | 44.5 | 44.8 | 0.6 | 62.8 | 40.8 | 38.2 |
| o3 | 13.5 | 68.1 | 24.7 | 37.7 | 44.4 | 0.0 | 36.0 | 37.6 | 32.0 |
| Open-Source Models | | | | | | | | | |
| Qwen3-VL-8B-Thinking [5] | 11.0 | 49.3 | 17.8 | 21.2 | 27.7 | 0.0 | 5.8 | 25.4 | 18.9 |
| BAGEL-7B-MoT [13] | 11.2 | 31.6 | 19.4 | 26.8 | 27.2 | 0.0 | 0.2 | 23.2 | 16.6 |
Evaluation of advanced VLMs. Table 1 reports the zero-shot performance of advanced VLMs on VisWorld-Eval. Overall, these models perform suboptimally, highlighting limitations of current multimodal AI systems. Among them, Gemini 3 Flash and Gemini 3 Pro remarkably outperform the other models; however, their performance remains far from satisfactory on challenging tasks like paper folding, ball tracking, cube 3-view projection, and real-world spatial reasoning.
### 4.2 Unified Multimodal Model Training and Evaluation
Evaluation protocol. To investigate the benefits of visual generation in multimodal reasoning, we evaluate post-trained UMMs, rather than the zero-shot performance of base models. To the best of our knowledge, no open-source model has been natively optimized for interleaved verbal-visual generation for reasoning. Even commercial closed-source models currently exhibit fundamental limitations in generating visual intermediate reasoning steps [38, 76]. Focusing on post-trained models, therefore, provides a more meaningful estimate of the upper bound for multimodal reasoning performance, while reducing confounding effects arising from insufficient pre-training due to limited interleaved data availability or quality.
Model training. We adopt BAGEL [13], a state-of-the-art open-source unified multimodal model, as our base model. Most experiments are conducted by supervised fine-tuning (SFT) on task-specific datasets, where verbal and visual generation in both chain-of-thought reasoning and final answers are optimized using cross-entropy and flow-matching loss. Specifically, the loss for reasoning with visual world modeling is as follows:
$$
\mathcal{L}_{\theta}(Q,I,R,A)=-\sum_{i=1}^{H+1}\sum_{j=1}^{|r_{i}|}\log p_{\theta}\left(r_{i,j}\mid r_{i,<j},R_{i}\right)+\sum_{i=1}^{H}\mathbb{E}_{t,\epsilon}\left\|v_{\theta}(o_{i}^{t},t\mid\tilde{R}_{i})-(\epsilon-o_{i})\right\|_{2}^{2}, \tag{6}
$$
where $o_{i}^{t}=to_{i}+(1-t)\epsilon$ are noisy observations. We emphasize that in our formulation, $r_{i}$ refers to a verbal reasoning step, instead of a reward. We also perform reinforcement learning from verifiable rewards (RLVR) following SFT. During RL, only the verbal generation component is optimized by GRPO [18], while visual generation is regularized via the KL-divergence with respect to the SFT-trained reference model:
$$
\displaystyle\mathcal{J}_{\theta}(Q,I)=\mathbb{E}_{o,r\sim p_{\theta_{\text{old}}}}\Bigg[ \displaystyle\sum_{i=1}^{H+1}\sum_{j=1}^{|r_{i}|}\Bigg(\min\Big(\frac{p_{\theta}\left(r_{i,j}\mid r_{i,<j},R_{i}\right)}{p_{\theta_{\text{old}}}\left(r_{i,j}\mid r_{i,<j},R_{i}\right)}{A},\ \text{clip}\Big(\frac{p_{\theta}\left(r_{i,j}\mid r_{i,<j},R_{i}\right)}{p_{\theta_{\text{old}}}\left(r_{i,j}\mid r_{i,<j},R_{i}\right)},1-\varepsilon,1+\varepsilon\Big){A}\Big)\Bigg) \displaystyle-\sum_{i=1}^{H}\mathbb{E}_{t,\epsilon}\left\|v_{\theta}(o_{i}^{t},t\mid\tilde{R}_{i})-v_{\theta_{\text{ref}}}(o_{i}^{t},t\mid\tilde{R}_{i})\right\|_{2}^{2}\Bigg]. \tag{7}
$$
Full implementation details and hyperparameters are provided in Appendix 8.2.
## 5 Experimental Results
In this section, we demonstrate that visual world modeling boosts multimodal reasoning through two atomic capabilities: world simulation (Section 5.1) and world reconstruction (Section 5.2). We also identify tasks in which it is unhelpful (Section 5.3), where implicit or verbal world modeling is sufficient. We conduct analysis in detail. Interestingly, we reveal emergent internal representations in UMMs that support implicit world modeling on simple maze tasks.
### 5.1 Visual World Simulation Boosts Multimodal Reasoning
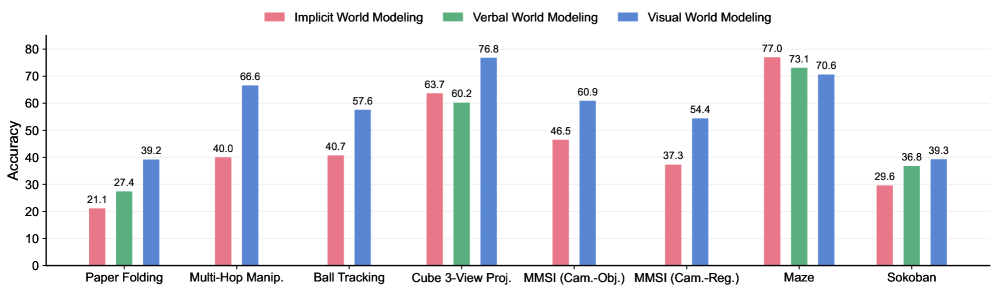
Main results. Figure 4 summarizes the performance of SFT-trained UMMs under different chain-of-thought formulations across all tasks. We observe that interleaved CoT with visual world modeling significantly outperforms its purely verbal counterparts on three world simulation tasks: paper folding, multi-hop manipulation, and ball tracking. These gains are attributed to both the richer expressiveness and stronger prior knowledge afforded by the visual modality. In particular, it is difficult for models to precisely ground object coordinates and perform arithmetic operations without external tools in tasks such as multi-hop manipulation and ball tracking, with the latter being especially challenging. Thus, verbal world modeling is inappropriate and omitted in these tasks. This exacerbates ambiguity and hallucinations in purely verbal reasoning. Similarly, in paper folding, although models can track the states of holes, it remains difficult to completely depict the paper contour during unfolding. Moreover, as showcased in Figure 9 and 16, the spatial transformation involved in paper unfolding critically relies on an understanding of geometric symmetry, which can be more naturally learned from visual data like images and videos.
Sample efficiency. To further demonstrate the stronger prior knowledge embedded in the visual modality, we experiment comparing the sample efficiency of verbal and visual world modeling on the paper folding task. As shown in Figure 6, reasoning with visual world modeling exhibits substantially higher sample efficiency, achieving performance comparable to verbal world modeling while using more than $4\times$ less SFT data.
### 5.2 Visual World Reconstruction Boosts Multimodal Reasoning
Main results. As shown in Figure 4, multimodal reasoning tasks that rely on world reconstruction capabilities also benefit substantially from visual world modeling. In the cube 3-view task, predicting a novel view of stacked cubes, denoted symbolic character matrices, suffers from limited prior knowledge, whereas visually rotating objects has been a rich experience during pre-training with large-scale Internet videos. For MMSI tasks, fully describing a novel view of a realistic scene using text alone is similarly ill-suited as in the previous subsection, and we also discover hallucinations in pure verbal reasoning, which lacks grounding to visual generation. We do not observe consistent improvements on other positional-relationship subtasks in MMSI-Bench, except camera-object and camera-region, which we attribute to current UMM’s limitations in both spatial understanding during verbal reasoning and generation quality in visual world modeling. Full quantitative results and qualitative examples are provided in Appendix 9. We expect these limitations to be mitigated in future work with stronger base models.
<details>
<summary>x4.png Details</summary>
### Visual Description
## Grouped Bar Chart: World Modeling Accuracy Across Tasks
### Overview
The image displays a grouped bar chart comparing the accuracy of three different world modeling approaches—Implicit, Verbal, and Visual—across eight distinct tasks. The chart is designed to show performance differences, with each task cluster containing up to three colored bars representing the modeling types.
### Components/Axes
* **Chart Type:** Grouped Bar Chart.
* **Y-Axis:** Labeled "Accuracy". The scale runs from 0 to 80, with major tick marks at intervals of 10 (0, 10, 20, 30, 40, 50, 60, 70, 80).
* **X-Axis:** Lists eight task categories. From left to right:
1. Paper Folding
2. Multi-Hop Manip. (presumably "Manipulation")
3. Ball Tracking
4. Cube 3-View Proj. (presumably "Projection")
5. MMSI (Cam.-Obj.) (presumably "Camera-Object")
6. MMSI (Cam.-Reg.) (presumably "Camera-Region")
7. Maze
8. Sokoban
* **Legend:** Positioned at the top center of the chart. It defines the three data series:
* **Pink Bar:** Implicit World Modeling
* **Green Bar:** Verbal World Modeling
* **Blue Bar:** Visual World Modeling
* **Data Labels:** Each bar has its exact accuracy value printed directly above it.
### Detailed Analysis
Below is the extracted data for each task, following the order of bars (Pink, Green, Blue) as defined by the legend.
1. **Paper Folding:**
* Implicit (Pink): 21.1
* Verbal (Green): 27.4
* Visual (Blue): 39.2
* *Trend:* Accuracy increases sequentially from Implicit to Verbal to Visual.
2. **Multi-Hop Manip.:**
* Implicit (Pink): 40.0
* Verbal (Green): 40.7
* Visual (Blue): 66.6
* *Trend:* Implicit and Verbal are nearly equal, while Visual shows a significant jump in accuracy.
3. **Ball Tracking:**
* Implicit (Pink): 40.7
* Verbal (Green): **No bar present.**
* Visual (Blue): 57.6
* *Trend:* Visual outperforms Implicit. Data for Verbal World Modeling is absent for this task.
4. **Cube 3-View Proj.:**
* Implicit (Pink): 63.7
* Verbal (Green): 60.2
* Visual (Blue): 76.8
* *Trend:* Visual is highest, followed by Implicit, then Verbal.
5. **MMSI (Cam.-Obj.):**
* Implicit (Pink): 46.5
* Verbal (Green): **No bar present.**
* Visual (Blue): 60.9
* *Trend:* Visual significantly outperforms Implicit. Data for Verbal is absent.
6. **MMSI (Cam.-Reg.):**
* Implicit (Pink): 37.3
* Verbal (Green): **No bar present.**
* Visual (Blue): 54.4
* *Trend:* Visual significantly outperforms Implicit. Data for Verbal is absent.
7. **Maze:**
* Implicit (Pink): 77.0
* Verbal (Green): 73.1
* Visual (Blue): 70.6
* *Trend:* This is the only task where accuracy *decreases* across the sequence, with Implicit performing best.
8. **Sokoban:**
* Implicit (Pink): 29.6
* Verbal (Green): 36.8
* Visual (Blue): 39.3
* *Trend:* Accuracy increases sequentially from Implicit to Verbal to Visual.
### Key Observations
* **Performance Leader:** Visual World Modeling (blue bars) achieves the highest accuracy in 6 out of the 8 tasks (Paper Folding, Multi-Hop Manip., Ball Tracking, Cube 3-View Proj., MMSI (Cam.-Obj.), MMSI (Cam.-Reg.), and Sokoban).
* **Notable Exception:** The **Maze** task is a clear outlier. Here, Implicit World Modeling (77.0) outperforms both Verbal (73.1) and Visual (70.6). This is the only task where the pink bar is the tallest.
* **Missing Data:** Verbal World Modeling (green bars) has no recorded accuracy for three tasks: Ball Tracking, MMSI (Cam.-Obj.), and MMSI (Cam.-Reg.).
* **Highest & Lowest Scores:** The highest accuracy on the chart is 77.0 (Implicit, Maze). The lowest accuracy is 21.1 (Implicit, Paper Folding).
* **Task Difficulty:** Tasks like Paper Folding and Sokoban show relatively low accuracy across all models (<40), suggesting they are more challenging. In contrast, Maze and Cube 3-View Proj. show high accuracy (>60) for all models that attempted them.
### Interpretation
The data suggests a strong, general advantage for **Visual World Modeling** across a variety of tasks involving spatial reasoning, object manipulation, and projection. Its consistent high performance indicates that a visual representation is highly effective for modeling these types of physical or geometric environments.
The **Maze** task's inverted trend is the most significant finding. It implies that for complex navigation and pathfinding within a constrained environment, an **Implicit** modeling approach (perhaps learning a latent policy or value function) is superior to explicit visual or verbal reasoning. This could be because mazes require integrating long-term consequences of actions, which implicit models might capture more efficiently.
The absence of data for **Verbal World Modeling** in several tasks (Ball Tracking, MMSI variants) may indicate that a verbal or language-based representation was deemed unsuitable or was not tested for those specific, potentially highly dynamic or visual-spatial, tasks. Where it was tested, it generally performed as an intermediate between Implicit and Visual, except in the Maze task.
In summary, the chart demonstrates that the optimal world modeling strategy is **task-dependent**. While visual models are broadly robust, specialized tasks like maze navigation may favor implicit learning. The results could guide the selection or hybridization of modeling approaches for artificial intelligence systems based on the problem domain.
</details>
Figure 4: Performance of SFT-trained UMMs with different world model-based chain-of-thought formulations across seven tasks from VisWorld-Eval. Refer to Table 1 for zero-shot performance of advanced VLMs.
Effects of task difficulties. Figure 6 analyzes performance on the cube 3-view projection task across varying sizes of input cube stacks. We observe a consistent advantage of reasoning with visual world modeling over verbal world modeling across all difficulty levels. Notably, for cube stacks of size six—out of the training distribution—visual world modeling still yields approximately a $10\$ performance improvement.
World model fidelity. Modern AI models are known to exhibit hallucinations along their reasoning trajectories, even when producing correct final answers [38]. We therefore evaluate the fidelity of world modeling in the cube 3-view projection task by comparing ground-truth views with the intermediate views generated verbally or visually during reasoning. To focus on structural correctness, we compare only the shapes of the views and completely ignore color information. Even under this relaxed evaluation setting, Figure 6 shows that verbal world modeling exhibits dramatically low fidelity, with scores degrading to near zero. Notably, approximately half of the samples require predicting the opposite view of a given input view, a transformation that only involves horizontal mirroring. Visual world modeling, benefiting from stronger prior knowledge of such geometric transformations, captures these patterns effectively and achieves fidelity scores consistently exceeding $50\$ .
### 5.3 Visual World Modeling is Unhelpful for Certain Tasks
Main results. (Un)surprisingly, we do not observe notable improvements on grid-world tasks, including maze and Sokoban. In the maze tasks, reasoning with implicit world modeling—without explicitly tracking coordinates—achieves the best performance with a slight advantage. These results are consistent with recent empirical findings [14]. We argue that this is also well explained by our world model perspective. In these tasks, state tracking is relatively simple, typically requiring the maintenance of only one or two two-dimensional coordinates, which can be adequately handled through verbal reasoning alone. Furthermore, in the maze task, we hypothesize that such world modeling can be implicitly encoded in the model’s hidden representations [37], which helps explain the competitive performance of verbal reasoning without explicit coordinate tracking.
<details>
<summary>x5.png Details</summary>
### Visual Description
## Diagram: BAGEL Model Architecture with MLP Head
### Overview
The image is a technical diagram illustrating a neural network architecture named "BAGEL." It depicts a multi-layered core model connected to a Multi-Layer Perceptron (MLP) head, which produces a specific coordinate output and a visualization. A text sequence with a masked token is shown below, suggesting the model's application in a language or sequence modeling task.
### Components/Axes
The diagram consists of three primary visual components arranged horizontally and vertically:
1. **BAGEL Core Model (Left/Center):**
* A large, light-blue rounded rectangle containing the model name and its internal structure.
* **Logo/Text:** A blue circular logo with a pattern of dots, followed by the text "**BAGEL**" in large, bold, blue sans-serif font.
* **Layer Stack:** Inside the rectangle, three horizontal bars represent model layers, labeled from bottom to top:
* `Layer 1`
* `Layer 2`
* `Layer N` (with ellipsis `...` between Layer 2 and Layer N, indicating a variable number of intermediate layers).
* A vertical arrow points upward from `Layer 1` through `Layer 2` to `Layer N`, indicating the flow of information through the stack.
2. **MLP Head & Output (Right):**
* A green rounded rectangle labeled "**MLP**" in black text.
* A blue arrow originates from the `Layer 2` bar within the BAGEL block and points to the MLP block, indicating a connection or data flow from that specific layer.
* **Output Visualization:** Above the MLP block, a small bar chart is depicted inside square brackets `[ ]`. It contains five vertical red bars of varying heights. The first two bars are the tallest, followed by three shorter bars of roughly equal height.
* **Coordinate Label:** Above the bar chart, the text "**Coordinate: (1,3)**" is displayed. The coordinate `(1,3)` is in red font.
3. **Contextual Text (Bottom):**
* A line of black monospaced text is positioned below the main diagram: `... proceed until I hit a wall, at [masked] ...`
* The token `[masked]` is highlighted in red font, matching the color of the coordinate output.
### Detailed Analysis
* **Spatial Grounding:** The BAGEL model block occupies the left and central portion of the image. The MLP head and its outputs are positioned to the right of the BAGEL block. The contextual text runs along the bottom edge.
* **Data Flow:** The diagram shows a clear flow: Information from `Layer 2` of the BAGEL model is fed into an MLP head. The MLP then produces two outputs: a specific coordinate value `(1,3)` and a feature vector visualized as a bar chart.
* **Text Transcription:**
* `BAGEL`
* `Layer 1`
* `Layer 2`
* `Layer N`
* `MLP`
* `Coordinate: (1,3)`
* `... proceed until I hit a wall, at [masked] ...`
* **Color Coding:**
* **Blue:** Used for the BAGEL model name, logo, and the connecting arrow, associating these elements with the core model.
* **Green:** Used for the MLP block, distinguishing it as a separate component.
* **Red:** Used for the output coordinate `(1,3)`, the bars in the output visualization, and the `[masked]` token. This color highlights the model's specific outputs and the target of the prediction task.
### Key Observations
1. **Layer-Specific Extraction:** The connection is explicitly drawn from `Layer 2`, not the final `Layer N`. This suggests the architecture may use intermediate layer representations for specific tasks, rather than only the final output.
2. **Output Duality:** The MLP produces both a discrete coordinate and a continuous vector (the bar chart). This could represent a multi-task prediction head.
3. **Masked Token Context:** The text snippet with a `[masked]` token strongly implies the model is being used for a masked language modeling (MLM) or similar sequence infilling task. The coordinate `(1,3)` likely corresponds to the position of this masked token within a sequence or a feature map.
### Interpretation
This diagram illustrates a **BAGEL model** being used for a **sequence prediction task**, likely involving masked token recovery. The key investigative insight is the **intermediate layer connection**.
* **What it suggests:** The architecture does not simply use the final output of the BAGEL stack. Instead, it taps into the representations at `Layer 2` to feed a specialized MLP head. This could be for efficiency (using a smaller, earlier representation) or because `Layer 2` contains features particularly suited for the task of predicting coordinates or the masked token.
* **Relationship of Elements:** The BAGEL core acts as a general-purpose feature extractor. The MLP is a task-specific "head" that interprets those features to produce a concrete output—the coordinate `(1,3)` and the associated vector. The red color linking the output coordinate and the `[masked]` token creates a direct visual and logical link: the model's output is the solution to the masked position in the input text.
* **Anomaly/Notable Pattern:** The output is a **coordinate `(1,3)`**, not a word. This is atypical for a standard language model. It suggests the task might be more complex than simple word prediction. Possibilities include:
* The model is predicting the **position** (e.g., row 1, column 3) of the masked token in a structured input (like a table or image patch sequence).
* The coordinate is a **latent variable** or **address** that points to the correct token in an external memory or embedding space.
* The bar chart represents a probability distribution over possible tokens, and `(1,3)` is a key or index derived from that distribution.
In essence, the diagram depicts a **hybrid system** where a large foundational model (BAGEL) provides rich representations, which are then efficiently decoded by a lightweight MLP for a precise, localized prediction task involving both a coordinate and a feature vector.
</details>
Figure 5: Probing implicit world models, by training a set of probes, i.e., MLPs which infer the masked point coordinates during reasoning from internal representations.
Demystifying implicit world modeling. To validate this hypothesis, we probe the internal representations of models, as illustrated in Figure 5. We consider the same architecture, BAGEL, with three different sets of weights: a randomly initialized model, the pre-trained model, and the model supervised fine-tuned on CoT data in the implicit world modeling format, in which special tokens mask all explicit point coordinates during the reasoning process. For each model, we extract the hidden representations of these special tokens at each layer. We then train multilayer perceptrons (MLPs) on these representations to predict the underlying true point coordinates.
Figure 6 reports the prediction accuracy on a validation set. As expected, the randomly initialized model completely fails to internally track point states, achieving only random-guess accuracy on $5\times 5$ mazes. In contrast, the pre-trained model [13] already exhibits emergent representations that are predictive of maze states. Notably, we observe a non-monotonic trend across layers: prediction accuracy increases from lower layers (which capture low-level features) to middle layers, and then decreases toward the final layers, which are likely specialized for next-token prediction. Finally, supervised fine-tuning on domain-specific data, despite providing no explicit coordinate supervision, substantially enhances this internal predictability, achieving near-perfect accuracy. These in-depth results help explain our main experimental findings: as the model already possesses the capability for implicit world modeling, it does not necessarily benefit from explicit verbal world modeling, let alone more complex forms of visual world modeling.
<details>
<summary>x6.png Details</summary>
### Visual Description
## Line Chart with Scatter Points: Paper Folding
### Overview
The image displays a line chart titled "Paper Folding," plotting model accuracy against the number of training samples. It compares two modeling approaches ("Visual WM" and "Verbal WM") across two difficulty levels ("Normal" and "Hard"). The "Normal" difficulty is represented by lines connecting data points, while the "Hard" difficulty is represented by isolated scatter points at the highest training sample count.
### Components/Axes
* **Title:** "Paper Folding" (centered at the top).
* **X-Axis:** Labeled "Num. of Training Samples." The scale runs from 0 to 2500, with major tick marks at 0, 500, 1000, 1500, 2000, and 2500.
* **Y-Axis:** Labeled "Accuracy." The scale runs from 20 to 90, with major tick marks at 20, 30, 40, 50, 60, 70, 80, and 90.
* **Legend (Top-Left Corner):**
* **Modeling:**
* Blue line with circle markers: "Visual WM"
* Red line with triangle markers: "Verbal WM"
* **Difficulty:**
* Circle marker: "Normal"
* Triangle marker: "Hard"
### Detailed Analysis
**Data Series & Trends:**
1. **Visual WM - Normal Difficulty (Blue Line with Circles):**
* **Trend:** Shows a strong, consistent upward trend. Accuracy increases significantly as the number of training samples grows.
* **Data Points (Approximate):**
* At 500 samples: ~52% accuracy
* At 1000 samples: ~65% accuracy
* At 2500 samples: ~72% accuracy
2. **Verbal WM - Normal Difficulty (Red Line with Triangles):**
* **Trend:** Shows a moderate, steady upward trend. Accuracy improves with more training samples, but at a slower rate and from a lower baseline than Visual WM.
* **Data Points (Approximate):**
* At 500 samples: ~29% accuracy
* At 1000 samples: ~34% accuracy
* At 2500 samples: ~39% accuracy
3. **Hard Difficulty Data Points (Scatter Points at 2500 Samples):**
* **Visual WM - Hard (Blue Circle):** Positioned at approximately 54% accuracy.
* **Verbal WM - Hard (Red Triangle):** Positioned at approximately 27% accuracy.
### Key Observations
1. **Performance Gap:** There is a substantial and consistent performance gap between the "Visual WM" and "Verbal WM" models across all training sample sizes for the "Normal" difficulty. Visual WM is significantly more accurate.
2. **Impact of Difficulty:** For both modeling approaches, performance on the "Hard" difficulty (at 2500 samples) is markedly lower than on the "Normal" difficulty at the same sample size.
* Visual WM drops from ~72% (Normal) to ~54% (Hard).
* Verbal WM drops from ~39% (Normal) to ~27% (Hard).
3. **Scaling Behavior:** Both models show improved accuracy with more training data, suggesting they benefit from increased sample size. The slope of improvement appears steeper for Visual WM.
4. **Relative Difficulty Impact:** The absolute drop in accuracy when moving from Normal to Hard difficulty is larger for the Visual WM model (~18 percentage points) than for the Verbal WM model (~12 percentage points), though Verbal WM starts from a much lower baseline.
### Interpretation
The data suggests that for the "Paper Folding" task, a modeling approach based on **Visual Working Memory (WM) is substantially more effective** than one based on Verbal Working Memory, achieving nearly double the accuracy with sufficient training data.
The consistent upward trends indicate that **both models are learning and generalizing** from the provided training samples, with no clear sign of performance plateauing within the tested range (up to 2500 samples). This implies that providing even more data could yield further improvements.
The significant performance degradation on the "Hard" difficulty level for both models demonstrates that the task's complexity scales with difficulty. The fact that the **Verbal WM model performs very poorly on the Hard task** (27% accuracy) suggests its representational strategy may be particularly ill-suited for handling the increased complexity, possibly involving spatial reasoning or mental manipulation that is more naturally encoded visually.
In summary, the chart provides strong evidence that **visual representations are superior to verbal ones for this specific paper folding task**, and that task difficulty critically modulates performance for both representational types. The results could inform the design of AI systems for spatial reasoning tasks, favoring visual encoding mechanisms.
</details>
(a) Sample efficiency.
<details>
<summary>x7.png Details</summary>
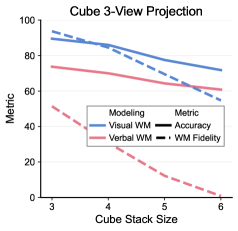
### Visual Description
\n
## Line Chart: Cube 3-View Projection
### Overview
The image displays a line chart titled "Cube 3-View Projection." It plots the performance of two modeling approaches (Visual WM and Verbal WM) across two metrics (Accuracy and WM Fidelity) as a function of increasing "Cube Stack Size." The chart shows a general downward trend for all plotted series as the stack size increases.
### Components/Axes
* **Chart Title:** "Cube 3-View Projection" (centered at the top).
* **X-Axis:**
* **Label:** "Cube Stack Size"
* **Markers/Ticks:** 3, 4, 5, 6
* **Y-Axis:**
* **Label:** "Metric"
* **Scale:** 0 to 100, with major gridlines at intervals of 20 (0, 20, 40, 60, 80, 100).
* **Legend:** Positioned in the top-right quadrant of the chart area. It is organized into two columns:
* **Column Header (Modeling):** Lists the two model types.
* `Visual WM` (associated with a solid blue line)
* `Verbal WM` (associated with a solid red/pink line)
* **Column Header (Metric):** Lists the two metrics.
* `Accuracy` (associated with a solid line style)
* `WM Fidelity` (associated with a dashed line style)
* **Line Identification:** The legend creates four distinct series by combining color and line style:
1. **Visual WM - Accuracy:** Solid blue line.
2. **Verbal WM - Accuracy:** Solid red/pink line.
3. **Visual WM - WM Fidelity:** Dashed blue line.
4. **Verbal WM - WM Fidelity:** Dashed red/pink line.
### Detailed Analysis
**Trend Verification & Data Points (Approximate):**
All four lines exhibit a negative slope, indicating a decline in metric values as Cube Stack Size increases from 3 to 6.
1. **Visual WM - Accuracy (Solid Blue Line):**
* **Trend:** Slopes downward steadily.
* **Points:**
* Stack Size 3: ~95
* Stack Size 4: ~88
* Stack Size 5: ~80
* Stack Size 6: ~72
2. **Verbal WM - Accuracy (Solid Red/Pink Line):**
* **Trend:** Slopes downward, with a slightly shallower initial slope than the Visual WM Accuracy line.
* **Points:**
* Stack Size 3: ~75
* Stack Size 4: ~70
* Stack Size 5: ~65
* Stack Size 6: ~60
3. **Visual WM - WM Fidelity (Dashed Blue Line):**
* **Trend:** Slopes downward, closely mirroring the path of the Visual WM Accuracy line but consistently positioned below it.
* **Points:**
* Stack Size 3: ~90
* Stack Size 4: ~82
* Stack Size 5: ~72
* Stack Size 6: ~62
4. **Verbal WM - WM Fidelity (Dashed Red/Pink Line):**
* **Trend:** Slopes downward most steeply of all series, especially between stack sizes 4 and 6.
* **Points:**
* Stack Size 3: ~52
* Stack Size 4: ~38
* Stack Size 5: ~20
* Stack Size 6: ~5
### Key Observations
1. **Universal Decline:** Performance on all metrics degrades as the cognitive load (Cube Stack Size) increases.
2. **Model Performance Gap:** The Visual WM model consistently outperforms the Verbal WM model on both Accuracy and WM Fidelity metrics at every stack size.
3. **Metric Gap:** For both models, the "WM Fidelity" score is lower than the "Accuracy" score at the same stack size. This gap is relatively consistent for the Visual WM model but widens dramatically for the Verbal WM model.
4. **Diverging Fidelity:** The most striking trend is the precipitous drop in Verbal WM - WM Fidelity, which falls from ~52 to near zero, suggesting a near-total collapse of fidelity for the verbal model at higher stack sizes.
5. **Crossover Point:** The Verbal WM - Accuracy line (solid red) remains above the Visual WM - WM Fidelity line (dashed blue) until approximately stack size 5, after which the dashed blue line is higher.
### Interpretation
The chart demonstrates a clear negative relationship between task complexity (represented by Cube Stack Size) and system performance. The data suggests that the "Visual WM" modeling approach is more robust to increasing complexity than the "Verbal WM" approach, maintaining higher scores across the board.
The critical insight lies in the relationship between "Accuracy" and "WM Fidelity." While both decline, the catastrophic drop in Verbal WM Fidelity indicates that even when the verbal model's output might be superficially "accurate" (scoring ~60 at size 6), its internal representation or fidelity to the working memory task has severely degraded (scoring ~5). This implies a potential decoupling between output correctness and internal process integrity under high load for the verbal system. In contrast, the visual model's fidelity degrades in closer concert with its accuracy, suggesting a more stable internal process. This has significant implications for system design, indicating that visual-based working memory models may scale better for complex, multi-element tasks.
</details>
(b) World model fidelity.
<details>
<summary>x8.png Details</summary>
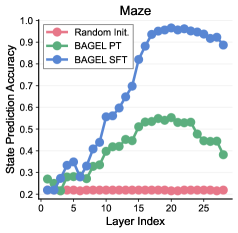
### Visual Description
## Line Chart: Maze - State Prediction Accuracy by Layer Index
### Overview
The image is a line chart titled "Maze" that plots "State Prediction Accuracy" against "Layer Index" for three different model initialization or training methods. The chart compares the performance of a randomly initialized model against two variants of a model named "BAGEL" (FT and SFT) across 26 layers (indexed 0-25).
### Components/Axes
* **Chart Title:** "Maze" (centered at the top).
* **Y-Axis:**
* **Label:** "State Prediction Accuracy" (vertical, left side).
* **Scale:** Linear, ranging from 0.2 to 1.0, with major tick marks at 0.2, 0.3, 0.4, 0.5, 0.6, 0.7, 0.8, 0.9, and 1.0.
* **X-Axis:**
* **Label:** "Layer Index" (horizontal, bottom).
* **Scale:** Linear, ranging from 0 to 25, with major tick marks at intervals of 5 (0, 5, 10, 15, 20, 25).
* **Legend:** Located in the top-left corner of the plot area. It contains three entries:
1. **Random Init.** - Represented by a red line with circular markers.
2. **BAGEL FT** - Represented by a green line with circular markers.
3. **BAGEL SFT** - Represented by a blue line with circular markers.
### Detailed Analysis
The chart displays three distinct data series, each showing a different trend in accuracy across the layers.
1. **Random Init. (Red Line):**
* **Trend:** The line is essentially flat, showing no meaningful improvement across layers.
* **Data Points:** The accuracy starts at approximately 0.2 at Layer Index 0 and remains constant at ~0.2 for all layers up to 25. This serves as a baseline.
2. **BAGEL FT (Green Line):**
* **Trend:** The line shows a gradual, modest upward trend that peaks in the middle layers before declining.
* **Data Points:**
* Starts at ~0.25 at Layer 0.
* Increases slowly, reaching ~0.4 at Layer 10.
* Peaks at approximately 0.55 between Layers 18-20.
* Declines after Layer 20, ending at approximately 0.4 at Layer 25.
3. **BAGEL SFT (Blue Line):**
* **Trend:** The line shows a strong, sigmoidal (S-shaped) growth pattern. It starts low, experiences a period of rapid increase, and then plateaus at a high accuracy level.
* **Data Points:**
* Starts at ~0.2 at Layer 0, similar to the random baseline.
* Begins a steep ascent around Layer 5.
* Crosses 0.5 accuracy near Layer 10.
* Reaches a plateau near its peak accuracy of approximately 0.95 around Layer 18.
* Maintains this high accuracy (~0.95) through Layer 25, with a very slight downward trend in the final layers.
### Key Observations
* **Performance Hierarchy:** There is a clear and significant performance gap. BAGEL SFT dramatically outperforms both BAGEL FT and the Random Init. baseline, especially in deeper layers (index >10).
* **Layer Sensitivity:** The effectiveness of the BAGEL models is highly dependent on the layer index. The most substantial gains for BAGEL SFT occur between layers 5 and 15.
* **Peak Performance Layer:** Both BAGEL variants achieve their peak accuracy in the later layers (18-20), but BAGEL SFT's peak is much higher and more sustained.
* **Baseline Comparison:** The flat red line confirms that random initialization provides no predictive capability for this task, highlighting that the observed accuracies for the BAGEL models are due to their training/finetuning methods.
### Interpretation
This chart likely visualizes the internal representational quality of different neural network models (or different training stages of the same model) on a "Maze" state prediction task. The "Layer Index" suggests we are looking at the output or intermediate representations from successive layers of a deep network.
* **What the data suggests:** The "BAGEL SFT" (likely Supervised Fine-Tuning) method is highly effective at teaching the model to predict maze states, with representations becoming progressively more informative through the network's depth until they saturate at a high accuracy. "BAGEL FT" (likely Fine-Tuning) provides only a modest improvement over random, suggesting this training method is less effective for this specific task or may be optimizing for a different objective.
* **How elements relate:** The layer-wise progression shows how information is transformed and refined within the network. The early layers (0-5) for all models have low accuracy, indicating they extract only basic features. The mid-to-late layers are where task-specific, high-level representations are formed, with BAGEL SFT doing this most successfully.
* **Notable anomalies/trends:** The slight decline in accuracy for BAGEL FT and BAGEL SFT in the very last layers (22-25) is interesting. It could indicate over-smoothing, a slight degradation of specialized features, or that the final layers are optimized for a different part of the overall model pipeline not directly measured by this state prediction probe. The stark difference between FT and SFT outcomes underscores the critical importance of the training methodology.
</details>
(c) Implicit world modeling.
Figure 6: Model analysis: (a) Performance of UMMs on the paper-folding task with varying numbers of SFT samples. Reasoning with visual world modeling achieves a $4\times$ improvement in sample efficiency. WM = world modeling. (b) Performance of UMMs on the cube 3-view projection task with increasing sizes of input cube stacks, evaluated using both answer accuracy and world-model fidelity. Visual world modeling demonstrates dramatically better fidelity of view synthesis. (c) Prediction accuracy of masked point coordinates in CoTs using representations extracted from different layers of different UMMs, revealing emergent internal world representations. PT = Pre-trained.
<details>
<summary>x9.png Details</summary>
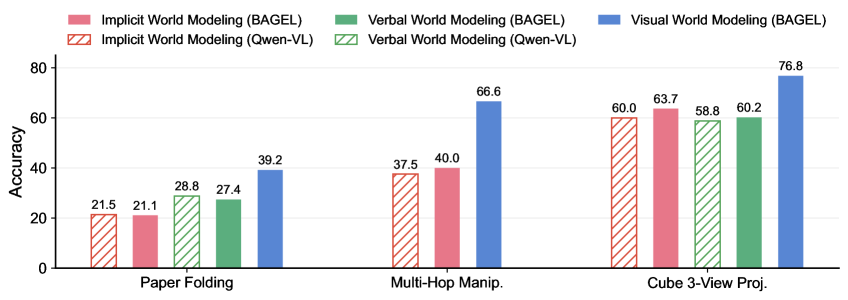
### Visual Description
## Grouped Bar Chart: Accuracy Comparison of World Modeling Approaches
### Overview
The image displays a grouped bar chart comparing the accuracy of three world modeling approaches (Implicit, Verbal, and Visual) across two different models (BAGEL and Qwen-VL) on three distinct spatial reasoning tasks. The chart is designed to evaluate and contrast model performance.
### Components/Axes
* **Chart Type:** Grouped Bar Chart.
* **X-Axis (Categorical):** Lists three tasks. From left to right:
1. `Paper Folding`
2. `Multi-Hop Manip.` (Abbreviation for "Multi-Hop Manipulation")
3. `Cube 3-View Proj.` (Abbreviation for "Cube 3-View Projection")
* **Y-Axis (Numerical):** Labeled `Accuracy`. The scale runs from 0 to 80, with major tick marks at intervals of 20 (0, 20, 40, 60, 80).
* **Legend (Top Center):** Positioned above the chart area. It defines six data series using a combination of color and fill pattern:
* **Pink Solid Bar:** `Implicit World Modeling (BAGEL)`
* **Pink Hatched Bar (Diagonal Lines):** `Implicit World Modeling (Qwen-VL)`
* **Green Solid Bar:** `Verbal World Modeling (BAGEL)`
* **Green Hatched Bar (Diagonal Lines):** `Verbal World Modeling (Qwen-VL)`
* **Blue Solid Bar:** `Visual World Modeling (BAGEL)`
* **Note:** There is no corresponding `Visual World Modeling (Qwen-VL)` series represented in the chart.
### Detailed Analysis
The chart presents accuracy scores for each model-method combination across the three tasks. Values are read from the top of each bar.
**1. Paper Folding Task (Leftmost Group):**
* **Implicit (Qwen-VL, Pink Hatched):** ~21.5
* **Implicit (BAGEL, Pink Solid):** ~21.1
* **Verbal (Qwen-VL, Green Hatched):** ~28.8
* **Verbal (BAGEL, Green Solid):** ~27.4
* **Visual (BAGEL, Blue Solid):** ~39.2
* **Trend:** Visual modeling (BAGEL) significantly outperforms both Implicit and Verbal approaches. Verbal modeling scores slightly higher than Implicit for both models.
**2. Multi-Hop Manipulation Task (Center Group):**
* **Implicit (Qwen-VL, Pink Hatched):** ~37.5
* **Implicit (BAGEL, Pink Solid):** ~40.0
* **Verbal (Qwen-VL, Green Hatched):** ~40.0
* **Verbal (BAGEL, Green Solid):** ~66.6
* **Visual (BAGEL, Blue Solid):** ~66.6
* **Trend:** A substantial performance jump is observed for BAGEL's Verbal and Visual models, which tie for the highest score. Qwen-VL's Implicit and Verbal models show moderate improvement from the previous task.
**3. Cube 3-View Projection Task (Rightmost Group):**
* **Implicit (Qwen-VL, Pink Hatched):** ~60.0
* **Implicit (BAGEL, Pink Solid):** ~63.7
* **Verbal (Qwen-VL, Green Hatched):** ~58.8
* **Verbal (BAGEL, Green Solid):** ~60.2
* **Visual (BAGEL, Blue Solid):** ~76.8
* **Trend:** All models achieve their highest scores on this task. BAGEL's Visual model again demonstrates a clear lead. The performance gap between Implicit and Verbal approaches narrows considerably for both models.
### Key Observations
1. **Consistent Superiority of Visual Modeling:** The `Visual World Modeling (BAGEL)` approach (blue solid bar) is the top performer in every task, with its lead being most pronounced in the "Paper Folding" and "Cube 3-View Projection" tasks.
2. **Task Difficulty Gradient:** Accuracy for all methods generally increases from left to right across the tasks, suggesting "Paper Folding" is the most challenging and "Cube 3-View Projection" is the least challenging for these models.
3. **Model Comparison (BAGEL vs. Qwen-VL):** For Implicit and Verbal modeling, the BAGEL and Qwen-VL variants often perform within a few points of each other. However, BAGEL shows a dramatic advantage in Verbal modeling on the "Multi-Hop Manipulation" task (66.6 vs. 40.0).
4. **Missing Data Series:** The chart includes no data for `Visual World Modeling (Qwen-VL)`, indicating this combination was either not tested or not applicable.
### Interpretation
This chart provides a comparative analysis of how different AI modeling paradigms handle spatial reasoning. The data suggests that **explicitly visual representations (Visual World Modeling) confer a significant advantage** for tasks involving mental manipulation of objects and spatial relationships, as seen in the consistent lead of the blue bars.
The progression of scores implies the tasks are ordered by increasing complexity or by better alignment with the models' training. The "Cube 3-View Projection" task, which likely involves interpreting 2D representations of a 3D object, appears to be the most solvable, possibly reflecting strong priors in the models' training data about geometric projections.
The near parity between BAGEL and Qwen-VL in most Implicit/Verbal comparisons, contrasted with BAGEL's outsized success in Visual modeling and one specific Verbal task, hints at architectural or training differences that make BAGEL particularly adept at leveraging visual and complex verbal reasoning for spatial problems. The absence of a Qwen-VL visual model is a critical gap in the comparison, leaving open whether its visual capabilities would close the performance gap.
</details>
Figure 7: Performance of SFT-trained VLMs compared with UMMs across three tasks.
<details>
<summary>x10.png Details</summary>
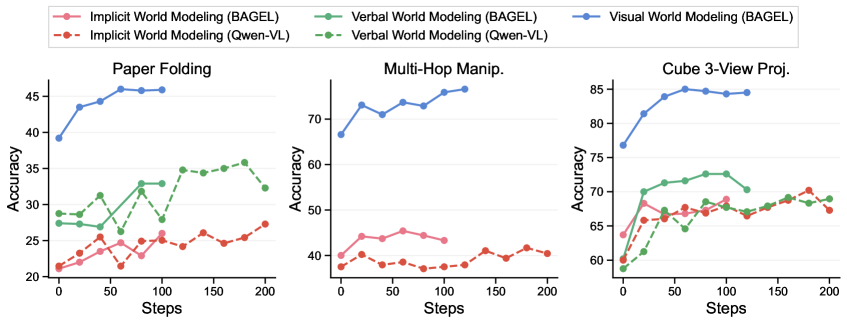
### Visual Description
## Line Charts: Comparative Performance of World Modeling Approaches
### Overview
The image displays three horizontally arranged line charts comparing the accuracy of six different world modeling approaches across three distinct tasks over 200 training steps. The approaches are variants of two models, "BAGEL" and "Qwen-VL," each employing "Implicit," "Verbal," or "Visual" world modeling techniques. The charts collectively demonstrate the learning curves and relative performance of these methods.
### Components/Axes
* **Legend:** Positioned at the top center of the entire figure. It contains six entries, each with a unique color and line/marker style:
* **Pink solid line with circle markers:** Implicit World Modeling (BAGEL)
* **Green solid line with circle markers:** Verbal World Modeling (BAGEL)
* **Blue solid line with circle markers:** Visual World Modeling (BAGEL)
* **Red dashed line with circle markers:** Implicit World Modeling (Qwen-VL)
* **Green dashed line with circle markers:** Verbal World Modeling (Qwen-VL)
* **Blue dashed line with circle markers:** Visual World Modeling (Qwen-VL)
* **Common Axes:**
* **X-axis (All Charts):** Label: "Steps". Scale: 0 to 200, with major ticks at 0, 50, 100, 150, 200.
* **Y-axis (All Charts):** Label: "Accuracy". Scale varies per chart.
* **Chart Titles (Left to Right):**
1. "Paper Folding"
2. "Multi-Hop Manip."
3. "Cube 3-View Proj."
### Detailed Analysis
#### Chart 1: Paper Folding
* **Y-axis Range:** 20 to 45.
* **Data Series & Approximate Trends/Points:**
* **Visual World Modeling (BAGEL) [Blue Solid]:** Shows a strong, consistent upward trend. Starts at ~39 (Step 0), rises sharply to ~44 (Step 25), then gradually increases to plateau at ~46 (Steps 100-200). This is the top-performing series.
* **Verbal World Modeling (BAGEL) [Green Solid]:** Volatile upward trend. Starts at ~28 (Step 0), fluctuates between ~27-33, and ends at ~33 (Step 200).
* **Implicit World Modeling (BAGEL) [Pink Solid]:** Slow, steady upward trend. Starts at ~21 (Step 0), rises gradually to ~27 (Step 200).
* **Verbal World Modeling (Qwen-VL) [Green Dashed]:** Highly volatile. Starts at ~28 (Step 0), spikes to ~31 (Step 25), drops to ~27 (Step 75), peaks at ~36 (Step 175), and ends at ~32 (Step 200).
* **Implicit World Modeling (Qwen-VL) [Red Dashed]:** Volatile with a slight upward trend. Starts at ~21 (Step 0), fluctuates between ~21-26, and ends at ~27 (Step 200).
* **Visual World Modeling (Qwen-VL) [Blue Dashed]:** *Not visibly present in this chart.* The legend entry exists, but no corresponding blue dashed line is plotted.
#### Chart 2: Multi-Hop Manip.
* **Y-axis Range:** 40 to 70.
* **Data Series & Approximate Trends/Points:**
* **Visual World Modeling (BAGEL) [Blue Solid]:** Dominant performance with a clear upward trend. Starts at ~67 (Step 0), jumps to ~73 (Step 25), and continues to rise to ~75 (Step 125). The line ends at Step 125.
* **Implicit World Modeling (BAGEL) [Pink Solid]:** Relatively flat, low performance. Hovers between ~43-45 from Step 0 to Step 100, then ends at ~44 (Step 100).
* **Implicit World Modeling (Qwen-VL) [Red Dashed]:** Low and volatile. Starts at ~38 (Step 0), fluctuates between ~37-42, and ends at ~40 (Step 200).
* **Verbal World Modeling (BAGEL) [Green Solid] & Verbal World Modeling (Qwen-VL) [Green Dashed]:** *Not visibly present in this chart.* The legend entries exist, but no corresponding green lines are plotted.
* **Visual World Modeling (Qwen-VL) [Blue Dashed]:** *Not visibly present in this chart.*
#### Chart 3: Cube 3-View Proj.
* **Y-axis Range:** 60 to 85.
* **Data Series & Approximate Trends/Points:**
* **Visual World Modeling (BAGEL) [Blue Solid]:** Starts highest and plateaus. Begins at ~77 (Step 0), rises to ~85 (Step 50), and remains stable at ~85 through Step 125.
* **Verbal World Modeling (BAGEL) [Green Solid]:** Steady upward trend. Starts at ~59 (Step 0), rises to ~73 (Step 75), and ends at ~70 (Step 125).
* **Implicit World Modeling (BAGEL) [Pink Solid]:** Upward trend with convergence. Starts at ~63 (Step 0), rises to ~69 (Step 75), and ends at ~68 (Step 125).
* **Verbal World Modeling (Qwen-VL) [Green Dashed]:** Volatile upward trend. Starts at ~59 (Step 0), fluctuates, peaks at ~70 (Step 175), and ends at ~69 (Step 200).
* **Implicit World Modeling (Qwen-VL) [Red Dashed]:** Volatile upward trend. Starts at ~61 (Step 0), fluctuates, peaks at ~70 (Step 175), and ends at ~67 (Step 200).
* **Visual World Modeling (Qwen-VL) [Blue Dashed]:** *Not visibly present in this chart.*
### Key Observations
1. **Consistent Dominance:** The "Visual World Modeling (BAGEL)" approach (blue solid line) is the top performer in all three tasks where it is plotted, showing strong and rapid learning.
2. **Task-Specific Presence:** The "Visual World Modeling (Qwen-VL)" (blue dashed line) and "Verbal World Modeling" approaches for both models are not plotted in all charts, suggesting they may not have been evaluated or performed too poorly to display on these scales for certain tasks.
3. **Performance Hierarchy:** A clear hierarchy is visible: Visual (BAGEL) > Verbal/Implicit (BAGEL) ≈ Verbal/Implicit (Qwen-VL). The BAGEL model variants generally outperform their Qwen-VL counterparts of the same modeling type.
4. **Convergence in Complex Task:** In the "Cube 3-View Proj." chart, the performance gap between the different non-visual methods narrows significantly by Step 200, all clustering around 67-70% accuracy, while the visual method maintains a lead at ~85%.
5. **Volatility:** The Qwen-VL variants (dashed lines) exhibit more volatility in their learning curves compared to the smoother BAGEL variants (solid lines).
### Interpretation
The data suggests a significant advantage for **visual world modeling** when implemented within the BAGEL architecture, particularly for spatial and manipulation tasks like paper folding and multi-hop manipulation. This method learns faster and achieves higher final accuracy. The **verbal and implicit modeling** approaches show comparable but lower performance, with higher volatility in the Qwen-VL model, indicating less stable learning. The absence of certain lines (e.g., Visual Qwen-VL) implies either a limitation in the experimental setup or a failure of that specific method-task combination to yield reportable results. The convergence of non-visual methods in the cube projection task suggests that for some problems, the choice between verbal and implicit modeling may be less critical than the decision to use a visual approach. Overall, the charts argue for the efficacy of visual representation learning in complex, physically-grounded reasoning tasks.
</details>
Figure 8: Performance of RLVR-trained VLMs and UMMs with different world-model-based CoT formulations across three tasks.
### 5.4 Comparison with VLMs: Do UMMs Compromise Verbal Reasoning Capabilities?
One may argue that UMMs are typically trained with a stronger emphasis on visual generation [13], which could compromise verbal reasoning capabilities, and bias comparisons in favor of visual world modeling. To address this concern, we compare with a pure VLM baseline, Qwen2.5-VL-7B-Instruct [6], which shares the same Qwen 2.5 LLM base model, with BAGEL. We fine-tune Qwen2.5-VL on the same verbal CoT datasets used in the previous subsections and evaluate it on three representative tasks: paper folding, cube 3-view projection, and multi-hop manipulation.
Results. As shown in Figure 7, the SFT performance of Qwen2.5-VL with implicit and verbal world modeling is comparable to that of BAGEL, without exhibiting significant advantages. It still lags behind BAGEL in settings that leverage visual world modeling. These results indicate that our findings arise from the inherent advantages of visual world modeling rather than from compromised verbal reasoning capabilities in UMMs.
### 5.5 RL Enhances Various CoTs, Yet Does Not Close the Gap
Reinforcement learning from verifiable rewards (RLVR) has been a major driver of recent progress in reasoning models equipped with verbal chain-of-thoughts, achieving strong performance across domains such as mathematics [18]. While Figure 4 shows a clear advantage of reasoning with visual world modeling after SFT, RLVR may further incentivize emergent reasoning behaviors that improve verbal CoTs. We thus conduct comparative RLVR experiments across different world model–based CoT formulations on three representative tasks.
Results. Figure 8 presents the learning curves under RLVR for different models. We observe consistent improvements during RLVR for different CoT formulations. However, the performance gap persists. We also find that VLMs and UMMs generally perform similarly with verbal CoTs. These results suggest that the superiority arises from inherent advantages of the world modeling approach, rather than insufficient post-training. Notably, RL enhances reasoning with visual world modeling, even though only the verbal generation components of interleaved CoTs are directly optimized. We envision that the full potential of interleaved CoTs will be further released with the development of RL algorithms tailored for verbal-visual interleaved generation.
## 6 Discussions
By bridging concepts from human cognition and artificial intelligence, we revisit the mechanisms underlying human reasoning and the central role that world models play. This provides a new perspective on the use of visual generation for reasoning in multimodal AI, highlighting its potential to serve as visual world models that complements the verbal world models embedded in LLMs, thereby enabling more human-like reasoning on scenarios grounded in the physical world. For the first time, this perspective is studied in a principled manner, through theoretical formulations that bridge world models and reasoning, as well as through empirical evaluations whose results are well explained by and strongly support the proposed insights. We hope this work helps address longstanding questions about the synergistic effects between generation and reasoning, and more broadly contributes to the development of more human-like AI that thinks and acts with multimodal world models.
<details>
<summary>x11.png Details</summary>
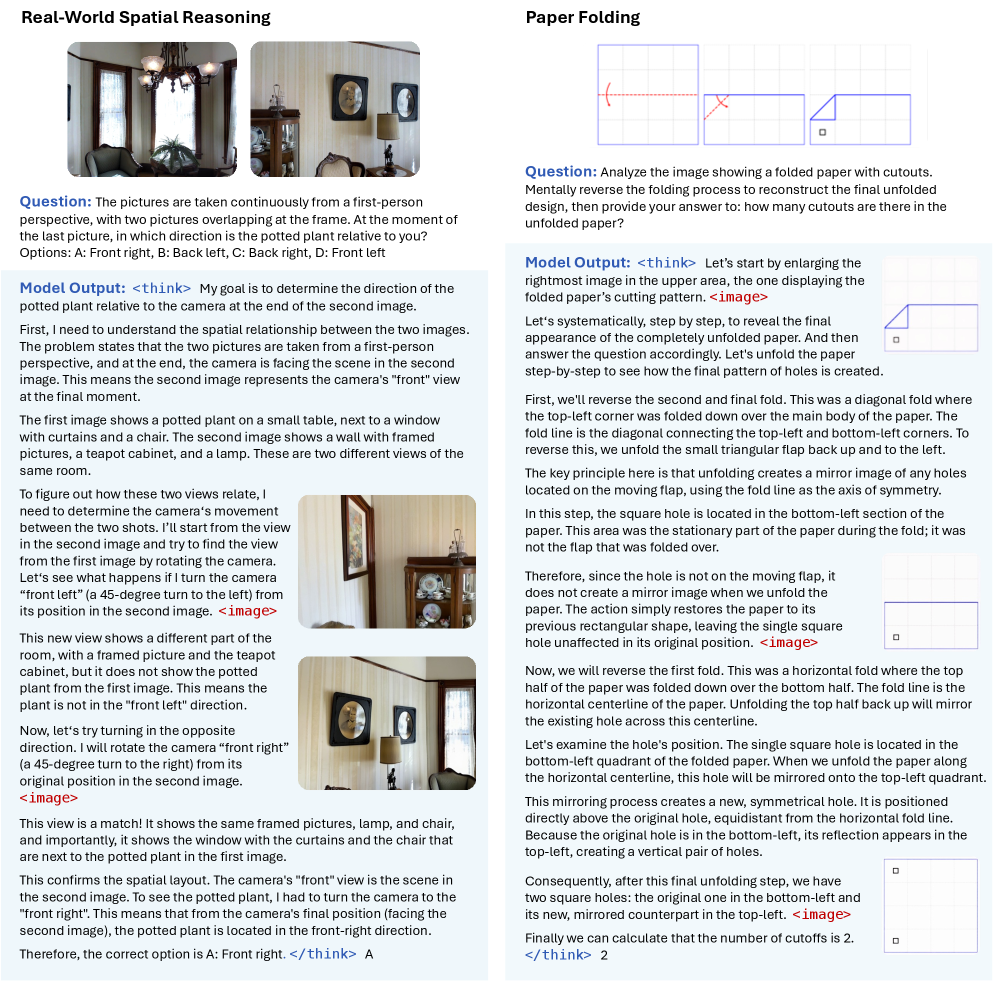
### Visual Description
\n
## Technical Document Extraction: Spatial Reasoning and Paper Folding Problems
### Overview
The image is a composite technical document presenting two distinct spatial reasoning problems, each accompanied by a model's step-by-step solution. The left section, titled "Real-World Spatial Reasoning," uses photographic sequences to solve a directional question. The right section, titled "Paper Folding," uses geometric diagrams to solve a mental unfolding problem. Both sections follow a consistent format: a question, a series of visual aids, and a detailed "Model Output" that explains the reasoning process.
### Components/Axes
The document is divided into two primary vertical columns.
**Left Column: Real-World Spatial Reasoning**
* **Title:** "Real-World Spatial Reasoning"
* **Visual Components:** Three photographs of a room interior, taken from different perspectives.
* **Top Image:** Shows a potted plant on a small table next to a window with curtains and a chair.
* **Middle Image:** Shows a wall with framed pictures, a teapot cabinet, and a lamp.
* **Bottom Image:** A composite view showing the framed pictures, lamp, and chair, with the window and curtains visible to the left.
* **Text Components:**
* **Question:** "The pictures are taken continuously from a first-person perspective, with two pictures overlapping at the frame. At the moment of the last picture, in which direction is the potted plant relative to you?"
* **Options:** "A: Front right, B: Back left, C: Back right, D: Front left"
* **Model Output:** A detailed `<think>` block explaining the spatial analysis.
* **Final Answer:** "A"
**Right Column: Paper Folding**
* **Title:** "Paper Folding"
* **Visual Components:** A sequence of four diagrams illustrating a paper folding and cutting process.
* **Diagram 1 (Top Left):** A square with a horizontal dashed line (fold line) and a red arrow indicating a fold from top to bottom.
* **Diagram 2 (Top Right):** The resulting rectangle after the first fold, with a diagonal dashed line (fold line) and a red arrow indicating a fold from the top-left corner down to the bottom-left corner.
* **Diagram 3 (Bottom Left):** The resulting shape after the second fold (a right triangle), with a small square cutout shown in the bottom-left corner.
* **Diagram 4 (Bottom Right):** The final folded shape with the cutout.
* **Text Components:**
* **Question:** "Analyze the image showing a folded paper with cutouts. Mentally reverse the folding process to reconstruct the final unfolded design, then provide your answer to: how many cutouts are there in the unfolded paper?"
* **Model Output:** A detailed `<think>` block explaining the unfolding process.
* **Final Answer:** "2"
### Detailed Analysis
**Real-World Spatial Reasoning Analysis:**
The model output performs a systematic spatial analysis.
1. **Goal Identification:** Determine the direction of the potted plant relative to the camera at the moment of the second (last) picture.
2. **Scene Reconstruction:** It identifies the content of the first image (plant, table, window) and the second image (wall, pictures, cabinet, lamp) as two views of the same room.
3. **Camera Movement Hypothesis:** To relate the views, it hypothesizes rotating the camera from its position in the second image.
4. **Testing Hypotheses:**
* **Test 1 (Front Left):** Rotating the camera 45 degrees left from the second image's view reveals a different part of the room (framed picture, teapot cabinet) but does not show the potted plant. This rules out "Front left."
* **Test 2 (Front Right):** Rotating the camera 45 degrees right from the second image's view reveals a scene that matches the first image: it shows the framed pictures, lamp, chair, and critically, the window with curtains and the chair next to the potted plant.
5. **Conclusion:** The match confirms that to see the potted plant from the camera's final position (facing the second image), one must turn to the "front right." Therefore, the plant is located in the front-right direction.
**Paper Folding Analysis:**
The model output performs a step-by-step reversal of the folding process.
1. **Goal Identification:** Determine the number of cutouts in the fully unfolded paper.
2. **Process Reversal:**
* **Step 1 (Reverse Final Fold):** The last fold was a diagonal fold (top-left corner down). The key principle is that unfolding creates a mirror image of holes across the fold line. The single square hole is in the bottom-left section, which was the stationary part during this fold. Therefore, it is not mirrored and remains a single hole.
* **Step 2 (Reverse First Fold):** The first fold was a horizontal fold (top half down). The single hole is now in the bottom-left quadrant of the currently folded paper. Unfolding the top half back up will mirror this hole across the horizontal centerline, creating a new hole in the top-left quadrant.
3. **Final Count:** The process results in two square holes: the original in the bottom-left and its mirrored counterpart in the top-left.
### Key Observations
1. **Problem-Solving Methodology:** Both solutions employ a structured, step-by-step mental manipulation of spatial data—rotating a camera view in 3D space and reversing geometric transformations in 2D space.
2. **Visual Evidence Integration:** The model explicitly references specific visual elements from the provided images (e.g., "window with curtains," "diagonal fold line") to justify each step of its reasoning.
3. **Logic Checks:** The paper folding solution uses the principle of symmetry (mirroring across a fold line) as a core logic check to predict the outcome of each unfolding step.
4. **Spatial Grounding:** The spatial reasoning solution carefully grounds its conclusion by describing what would be visible after a hypothetical camera rotation, matching it back to the provided photographic evidence.
### Interpretation
This document serves as a demonstration of advanced visual-spatial reasoning capabilities in an AI model. It showcases two competencies:
1. **3D Scene Understanding and Mental Rotation:** The ability to infer camera movement and perspective changes from static 2D images to deduce spatial relationships between objects not simultaneously in view.
2. **2D Geometric Transformation and Symmetry Application:** The ability to mentally reverse a sequence of physical operations (folding) by applying geometric principles (axial symmetry) to predict the final state of a pattern.
The "Model Output" sections are not just answers but **explanations of process**. They reveal a reasoning chain that mimics human problem-solving: decomposing a complex task, forming hypotheses, testing them against evidence, and applying known principles to reach a conclusion. The inclusion of the intermediate `<image>` tags within the think blocks suggests the model is generating or referencing visual aids to support its internal reasoning, highlighting a multimodal approach where text and visual processing are integrated. The document implicitly argues that such transparent, step-by-step reasoning is crucial for verifying the reliability of AI outputs in tasks requiring spatial intelligence.
</details>
Figure 9: Showcases of interleaved verbal-visual chain-of-thought reasoning, generated by post-trained UMMs, where visual generation serves as world models. <image> denotes a placeholder indicating the position of a generated image.
Limitations and future work. This work primarily focuses on spatial and physical reasoning tasks, where multimodal AI systems exhibit a pronounced performance gap relative to humans. Many other tasks proposed in the related literature can also be interpreted through our world model perspective. For example, a prominent class of benchmarks involves visual jigsaw tasks [52, 17, 38, 77], in which input image patches are cropped, masked, or shuffled. Such tasks essentially probe a form of world reconstruction capability, as corrupted images and videos are commonly treated as specific views within the world model literature [3, 7, 4]. Another active area of interest lies in STEM reasoning. Recent work [51] leverages visual generation for mathematical diagram editing, such as constructing auxiliary geometric lines. This closely resembles how humans use visual sketchpads to support math understanding and reasoning, constructing visual world models of a symbolic system. However, as symbolic representations in mathematics are largely complete, and mathematical reasoning has been extensively optimized in modern LLMs, it remains unclear whether multimodal interleaved CoT can fundamentally break through the performance limit, warranting further investigation.
We do not apply reinforcement learning to the visual generation components of verbal–visual interleaved CoTs [39]. Prior work has shown that world models themselves can be improved through RLVR [65]. As discussed in Section 5.5, developing RL algorithms specifically tailored to interleaved verbal–visual generation may further improve world-model fidelity during reasoning and incentivize the emergence of stronger and intriguing world-modeling capabilities.
The analysis of emergent representations for implicit world modeling in Figure 6 is intriguing but preliminary. We hope this result will rekindle interest in probing approaches [37] for interpreting the latent representations learned by different models. In particular, we are interested in comparing the internal representations of VLMs and UMMs, as the latter may capture complementary aspects of world knowledge through training for multimodal generation.
Artificial intelligence is increasingly being embodied in the physical world [23]. Our work, particularly the visual superiority hypothesis, suggests that learning visual world models is therefore essential for embodied intelligence. Visual world modeling enables embodied agents to better understand their environments, from imagining occluded regions to interpreting user intentions from an egocentric perspective, thereby supporting more reliable and natural everyday services. It also facilitates planning and decision-making by allowing agents to mentally simulate the precise outcomes of potential actions, leading to more effective interaction with the world. Rather than relying on loosely coupled modules [15] or performing only single-step reasoning [73], we envision a future direction in which flexible multimodal world modeling and reasoning, empowered by interleave verbal-visual generation within a unified model, form core components of physical and embodied AI.
## Acknowledgements
We would like to thank Yanwei Li, Rui Yang, Ziyu Zhu, and Feng Cheng for their assistance in constructing some preliminary training and test data. We also appreciate Xinchen Zhang, Jianhua Zhu, Yifan Du, Yuezhou Ma, Xingzhuo Guo, Ningya Feng, Shangchen Miao, and many colleagues for their valuable discussion.
## References
- Agarwal et al. [2025] Niket Agarwal, Arslan Ali, Maciej Bala, Yogesh Balaji, Erik Barker, Tiffany Cai, Prithvijit Chattopadhyay, Yongxin Chen, Yin Cui, Yifan Ding, et al. Cosmos world foundation model platform for physical ai. arXiv preprint arXiv:2501.03575, 2025.
- Alonso et al. [2024] Eloi Alonso, Adam Jelley, Vincent Micheli, Anssi Kanervisto, Amos J Storkey, Tim Pearce, and François Fleuret. Diffusion for world modeling: Visual details matter in atari. In NeurIPS, 2024.
- Assran et al. [2023] Mahmoud Assran, Quentin Duval, Ishan Misra, Piotr Bojanowski, Pascal Vincent, Michael Rabbat, Yann LeCun, and Nicolas Ballas. Self-supervised learning from images with a joint-embedding predictive architecture. In CVPR, 2023.
- Assran et al. [2025] Mido Assran, Adrien Bardes, David Fan, Quentin Garrido, Russell Howes, Matthew Muckley, Ammar Rizvi, Claire Roberts, Koustuv Sinha, Artem Zholus, et al. V-jepa 2: Self-supervised video models enable understanding, prediction and planning. arXiv preprint arXiv:2506.09985, 2025.
- Bai et al. [2025a] Shuai Bai, Yuxuan Cai, Ruizhe Chen, Keqin Chen, Xionghui Chen, Zesen Cheng, Lianghao Deng, Wei Ding, Chang Gao, Chunjiang Ge, et al. Qwen3-vl technical report. arXiv preprint arXiv:2511.21631, 2025a.
- Bai et al. [2025b] Shuai Bai, Keqin Chen, Xuejing Liu, Jialin Wang, Wenbin Ge, Sibo Song, Kai Dang, Peng Wang, Shijie Wang, Jun Tang, et al. Qwen2.5-vl technical report. arXiv preprint arXiv:2502.13923, 2025b.
- Bardes et al. [2024] Adrien Bardes, Quentin Garrido, Jean Ponce, Xinlei Chen, Michael Rabbat, Yann LeCun, Mahmoud Assran, and Nicolas Ballas. Revisiting feature prediction for learning visual representations from video. arXiv preprint arXiv:2404.08471, 2024.
- Cai et al. [2025] Zhongang Cai, Yubo Wang, Qingping Sun, Ruisi Wang, Chenyang Gu, Wanqi Yin, Zhiqian Lin, Zhitao Yang, Chen Wei, Xuanke Shi, et al. Has gpt-5 achieved spatial intelligence? an empirical study. arXiv preprint arXiv:2508.13142, 2025.
- Chen et al. [2025] Delong Chen, Theo Moutakanni, Willy Chung, Yejin Bang, Ziwei Ji, Allen Bolourchi, and Pascale Fung. Planning with reasoning using vision language world model. arXiv preprint arXiv:2509.02722, 2025.
- Copet et al. [2025] Jade Copet, Quentin Carbonneaux, Gal Cohen, Jonas Gehring, Jacob Kahn, Jannik Kossen, Felix Kreuk, Emily McMilin, Michel Meyer, Yuxiang Wei, et al. Cwm: An open-weights llm for research on code generation with world models. arXiv preprint arXiv:2510.02387, 2025.
- Craik [1967] Kenneth James Williams Craik. The nature of explanation, volume 445. CUP Archive, 1967.
- DeepMind [2025] Google DeepMind. Genie 3: A new frontier for world models. 2025.
- Deng et al. [2025] Chaorui Deng, Deyao Zhu, Kunchang Li, Chenhui Gou, Feng Li, Zeyu Wang, Shu Zhong, Weihao Yu, Xiaonan Nie, Ziang Song, et al. Emerging properties in unified multimodal pretraining. arXiv preprint arXiv:2505.14683, 2025.
- Du et al. [2025] Yifan Du, Kun Zhou, Yingqian Min, Yue Ling, Wayne Xin Zhao, and Youbin Wu. Revisiting the necessity of lengthy chain-of-thought in vision-centric reasoning generalization. arXiv preprint arXiv:2511.22586, 2025.
- Feng et al. [2025] Yunhai Feng, Jiaming Han, Zhuoran Yang, Xiangyu Yue, Sergey Levine, and Jianlan Luo. Reflective planning: Vision-language models for multi-stage long-horizon robotic manipulation. arXiv preprint arXiv:2502.16707, 2025.
- Forrester [1971] Jay W Forrester. Counterintuitive behavior of social systems. Theory and decision, 2(2):109–140, 1971.
- Gu et al. [2025] Jiawei Gu, Yunzhuo Hao, Huichen Will Wang, Linjie Li, Michael Qizhe Shieh, Yejin Choi, Ranjay Krishna, and Yu Cheng. Thinkmorph: Emergent properties in multimodal interleaved chain-of-thought reasoning. arXiv preprint arXiv:2510.27492, 2025.
- Guo et al. [2025a] Daya Guo, Dejian Yang, Haowei Zhang, Junxiao Song, Peiyi Wang, Qihao Zhu, Runxin Xu, Ruoyu Zhang, Shirong Ma, Xiao Bi, et al. Deepseek-r1 incentivizes reasoning in llms through reinforcement learning. Nature, 2025a.
- Guo et al. [2025b] Dong Guo, Faming Wu, Feida Zhu, Fuxing Leng, Guang Shi, Haobin Chen, Haoqi Fan, Jian Wang, Jianyu Jiang, Jiawei Wang, et al. Seed1.5-vl technical report. arXiv preprint arXiv:2505.07062, 2025b.
- Guo et al. [2025c] Meng-Hao Guo, Xuanyu Chu, Qianrui Yang, Zhe-Han Mo, Yiqing Shen, Pei-lin Li, Xinjie Lin, Jinnian Zhang, Xin-Sheng Chen, Yi Zhang, et al. Rbench-v: A primary assessment for visual reasoning models with multi-modal outputs. arXiv preprint arXiv:2505.16770, 2025c.
- Guo et al. [2025d] Ziyu Guo, Renrui Zhang, Hongyu Li, Manyuan Zhang, Xinyan Chen, Sifan Wang, Yan Feng, Peng Pei, and Pheng-Ann Heng. Thinking-while-generating: Interleaving textual reasoning throughout visual generation. arXiv preprint arXiv:2511.16671, 2025d.
- Guo et al. [2025e] Ziyu Guo, Renrui Zhang, Chengzhuo Tong, Zhizheng Zhao, Rui Huang, Haoquan Zhang, Manyuan Zhang, Jiaming Liu, Shanghang Zhang, Peng Gao, et al. Can we generate images with cot? let’s verify and reinforce image generation step by step. In CVPR, 2025e.
- Gupta et al. [2021] Agrim Gupta, Silvio Savarese, Surya Ganguli, and Li Fei-Fei. Embodied intelligence via learning and evolution. Nature Communications, 2021.
- Ha and Schmidhuber [2018] David Ha and Jürgen Schmidhuber. World models. arXiv preprint arXiv:1803.10122, 2(3), 2018.
- Hafner et al. [2025] Danijar Hafner, Jurgis Pasukonis, Jimmy Ba, and Timothy Lillicrap. Mastering diverse control tasks through world models. Nature, 2025.
- Hansen et al. [2022] Nicklas Hansen, Xiaolong Wang, and Hao Su. Temporal difference learning for model predictive control. In ICML, 2022.
- Huh et al. [2024] Minyoung Huh, Brian Cheung, Tongzhou Wang, and Phillip Isola. The platonic representation hypothesis. In ICML, 2024.
- Hurst et al. [2024] Aaron Hurst, Adam Lerer, Adam P Goucher, Adam Perelman, Aditya Ramesh, Aidan Clark, AJ Ostrow, Akila Welihinda, Alan Hayes, Alec Radford, et al. Gpt-4o system card. arXiv preprint arXiv:2410.21276, 2024.
- Ivanitskiy et al. [2023] Michael Igorevich Ivanitskiy, Rusheb Shah, Alex F. Spies, Tilman Räuker, Dan Valentine, Can Rager, Lucia Quirke, Chris Mathwin, Guillaume Corlouer, Cecilia Diniz Behn, and Samy Wu Fung. A configurable library for generating and manipulating maze datasets. arXiv preprint arXiv:2309.10498, 2023.
- Johnson et al. [2017] Justin Johnson, Bharath Hariharan, Laurens Van Der Maaten, Li Fei-Fei, C Lawrence Zitnick, and Ross Girshick. Clevr: A diagnostic dataset for compositional language and elementary visual reasoning. In CVPR, 2017.
- Johnson-Laird [1983] PN Johnson-Laird. Mental models: Towards a cognitive science of language, inference, and consciousness. Harvard University Press, 1983.
- Lakoff and Núñez [2000] George Lakoff and Rafael Núñez. Where mathematics comes from, volume 6. New York: Basic Books, 2000.
- Landy and Goldstone [2007] David Landy and Robert L Goldstone. How abstract is symbolic thought? Journal of Experimental Psychology: Learning, Memory, and Cognition, 33(4):720, 2007.
- LeCun [2022] Yann LeCun. A path towards autonomous machine intelligence version 0.9. 2, 2022-06-27. Open Review, 62(1):1–62, 2022.
- Li et al. [2025a] Ang Li, Charles Wang, Deqing Fu, Kaiyu Yue, Zikui Cai, Wang Bill Zhu, Ollie Liu, Peng Guo, Willie Neiswanger, Furong Huang, et al. Zebra-cot: A dataset for interleaved vision language reasoning. arXiv preprint arXiv:2507.16746, 2025a.
- Li et al. [2025b] Chengzu Li, Wenshan Wu, Huanyu Zhang, Yan Xia, Shaoguang Mao, Li Dong, Ivan Vulić, and Furu Wei. Imagine while reasoning in space: Multimodal visualization-of-thought. In ICML, 2025b.
- Li et al. [2023] Kenneth Li, Aspen K Hopkins, David Bau, Fernanda Viégas, Hanspeter Pfister, and Martin Wattenberg. Emergent world representations: Exploring a sequence model trained on a synthetic task. In ICLR, 2023.
- Liang et al. [2025] Yongyuan Liang, Wei Chow, Feng Li, Ziqiao Ma, Xiyao Wang, Jiageng Mao, Jiuhai Chen, Jiatao Gu, Yue Wang, and Furong Huang. Rover: Benchmarking reciprocal cross-modal reasoning for omnimodal generation. arXiv preprint arXiv:2511.01163, 2025.
- Liu et al. [2025] Jie Liu, Gongye Liu, Jiajun Liang, Yangguang Li, Jiaheng Liu, Xintao Wang, Pengfei Wan, Di Zhang, and Wanli Ouyang. Flow-grpo: Training flow matching models via online rl. In NeurIPS, 2025.
- Loomis et al. [1991] JM Loomis, RL Klatzky, RG Golledge, and JG CicineIli. Mental models, psychology of. Psychology, 14:56–89, 1991.
- Ma et al. [2025] Yiyang Ma, Xingchao Liu, Xiaokang Chen, Wen Liu, Chengyue Wu, Zhiyu Wu, Zizheng Pan, Zhenda Xie, Haowei Zhang, Xingkai Yu, et al. Janusflow: Harmonizing autoregression and rectified flow for unified multimodal understanding and generation. In CVPR, 2025.
- Mon-Williams et al. [2025] Ruaridh Mon-Williams, Gen Li, Ran Long, Wenqian Du, and Christopher G Lucas. Embodied large language models enable robots to complete complex tasks in unpredictable environments. Nature Machine Intelligence, 2025.
- Monzel and Reuter [2024] Merlin Monzel and Martin Reuter. Where’s wanda? the influence of visual imagery vividness on visual search speed measured by means of hidden object pictures. Attention, Perception, & Psychophysics, 86(1):22–27, 2024.
- Norman [2014] Donald A Norman. Some observations on mental models. In Mental models, pages 7–14. Psychology Press, 2014.
- Paivio [1990] Allan Paivio. Mental representations: A dual coding approach. Oxford university press, 1990.
- Pan et al. [2025] Xichen Pan, Satya Narayan Shukla, Aashu Singh, Zhuokai Zhao, Shlok Kumar Mishra, Jialiang Wang, Zhiyang Xu, Jiuhai Chen, Kunpeng Li, Felix Juefei-Xu, et al. Transfer between modalities with metaqueries. arXiv preprint arXiv:2504.06256, 2025.
- Rombach et al. [2022] Robin Rombach, Andreas Blattmann, Dominik Lorenz, Patrick Esser, and Björn Ommer. High-resolution image synthesis with latent diffusion models. In CVPR, 2022.
- Schrittwieser et al. [2020] Julian Schrittwieser, Ioannis Antonoglou, Thomas Hubert, Karen Simonyan, Laurent Sifre, Simon Schmitt, Arthur Guez, Edward Lockhart, Demis Hassabis, Thore Graepel, et al. Mastering atari, go, chess and shogi by planning with a learned model. Nature, 2020.
- Schulze Buschoff et al. [2025] Luca M Schulze Buschoff, Elif Akata, Matthias Bethge, and Eric Schulz. Visual cognition in multimodal large language models. Nature Machine Intelligence, 2025.
- Seedream et al. [2025] Team Seedream, Yunpeng Chen, Yu Gao, Lixue Gong, Meng Guo, Qiushan Guo, Zhiyao Guo, Xiaoxia Hou, Weilin Huang, Yixuan Huang, et al. Seedream 4.0: Toward next-generation multimodal image generation. arXiv preprint arXiv:2509.20427, 2025.
- Shi et al. [2025a] Weikang Shi, Aldrich Yu, Rongyao Fang, Houxing Ren, Ke Wang, Aojun Zhou, Changyao Tian, Xinyu Fu, Yuxuan Hu, Zimu Lu, et al. Mathcanvas: Intrinsic visual chain-of-thought for multimodal mathematical reasoning. arXiv preprint arXiv:2510.14958, 2025a.
- Shi et al. [2025b] Yang Shi, Yuhao Dong, Yue Ding, Yuran Wang, Xuanyu Zhu, Sheng Zhou, Wenting Liu, Haochen Tian, Rundong Wang, Huanqian Wang, et al. Realunify: Do unified models truly benefit from unification? a comprehensive benchmark. arXiv preprint arXiv:2509.24897, 2025b.
- Swanson et al. [2025] Kyle Swanson, Wesley Wu, Nash L Bulaong, John E Pak, and James Zou. The virtual lab of ai agents designs new sars-cov-2 nanobodies. Nature, 2025.
- Team [2024] Chameleon Team. Chameleon: Mixed-modal early-fusion foundation models. arXiv preprint arXiv:2405.09818, 2024.
- Tong et al. [2025a] Jingqi Tong, Jixin Tang, Hangcheng Li, Yurong Mou, Ming Zhang, Jun Zhao, Yanbo Wen, Fan Song, Jiahao Zhan, Yuyang Lu, et al. Game-rl: Synthesizing multimodal verifiable game data to boost vlms’ general reasoning. arXiv preprint arXiv:2505.13886, 2025a.
- Tong et al. [2025b] Shengbang Tong, David Fan, Jiachen Li, Yunyang Xiong, Xinlei Chen, Koustuv Sinha, Michael Rabbat, Yann LeCun, Saining Xie, and Zhuang Liu. Metamorph: Multimodal understanding and generation via instruction tuning. In ICCV, 2025b.
- Trinh et al. [2024] Trieu H Trinh, Yuhuai Wu, Quoc V Le, He He, and Thang Luong. Solving olympiad geometry without human demonstrations. Nature, 2024.
- Tu et al. [2025] Tao Tu, Mike Schaekermann, Anil Palepu, Khaled Saab, Jan Freyberg, Ryutaro Tanno, Amy Wang, Brenna Li, Mohamed Amin, Yong Cheng, et al. Towards conversational diagnostic artificial intelligence. Nature, 2025.
- Wang et al. [2025a] Kangrui Wang, Pingyue Zhang, Zihan Wang, Yaning Gao, Linjie Li, Qineng Wang, Hanyang Chen, Chi Wan, Yiping Lu, Zhengyuan Yang, et al. Vagen: Reinforcing world model reasoning for multi-turn vlm agents. In NeurIPS, 2025a.
- Wang et al. [2024a] Ruoyao Wang, Graham Todd, Ziang Xiao, Xingdi Yuan, Marc-Alexandre Côté, Peter Clark, and Peter Jansen. Can language models serve as text-based world simulators? In ACL, 2024a.
- Wang et al. [2025b] Siting Wang, Luoyang Sun, Cheng Deng, Kun Shao, Minnan Pei, Zheng Tian, Haifeng Zhang, and Jun Wang. Spatialviz-bench: Automatically generated spatial visualization reasoning tasks for mllms. arXiv preprint arXiv:2507.07610, 2025b.
- Wang et al. [2024b] Xinlong Wang, Xiaosong Zhang, Zhengxiong Luo, Quan Sun, Yufeng Cui, Jinsheng Wang, Fan Zhang, Yueze Wang, Zhen Li, Qiying Yu, et al. Emu3: Next-token prediction is all you need. arXiv preprint arXiv:2409.18869, 2024b.
- Wu et al. [2025a] Chengyue Wu, Xiaokang Chen, Zhiyu Wu, Yiyang Ma, Xingchao Liu, Zizheng Pan, Wen Liu, Zhenda Xie, Xingkai Yu, Chong Ruan, et al. Janus: Decoupling visual encoding for unified multimodal understanding and generation. In CVPR, 2025a.
- Wu et al. [2024] Jialong Wu, Shaofeng Yin, Ningya Feng, Xu He, Dong Li, Jianye Hao, and Mingsheng Long. ivideogpt: Interactive videogpts are scalable world models. In NeurIPS, 2024.
- Wu et al. [2025b] Jialong Wu, Shaofeng Yin, Ningya Feng, and Mingsheng Long. Rlvr-world: Training world models with reinforcement learning. In NeurIPS, 2025b.
- Xie et al. [2025] Jinheng Xie, Weijia Mao, Zechen Bai, David Junhao Zhang, Weihao Wang, Kevin Qinghong Lin, Yuchao Gu, Zhijie Chen, Zhenheng Yang, and Mike Zheng Shou. Show-o: One single transformer to unify multimodal understanding and generation. In ICLR, 2025.
- Xu et al. [2025] Yi Xu, Chengzu Li, Han Zhou, Xingchen Wan, Caiqi Zhang, Anna Korhonen, and Ivan Vulić. Visual planning: Let’s think only with images. arXiv preprint arXiv:2505.11409, 2025.
- Yang et al. [2025a] Rui Yang, Ziyu Zhu, Yanwei Li, Jingjia Huang, Shen Yan, Siyuan Zhou, Zhe Liu, Xiangtai Li, Shuangye Li, Wenqian Wang, et al. Visual spatial tuning. arXiv preprint arXiv:2511.05491, 2025a.
- Yang et al. [2025b] Sihan Yang, Runsen Xu, Yiman Xie, Sizhe Yang, Mo Li, Jingli Lin, Chenming Zhu, Xiaochen Chen, Haodong Duan, Xiangyu Yue, et al. Mmsi-bench: A benchmark for multi-image spatial intelligence. arXiv preprint arXiv:2505.23764, 2025b.
- Yao et al. [2025] Yuan Yao, Tianyu Yu, Ao Zhang, Chongyi Wang, Junbo Cui, Hongji Zhu, Tianchi Cai, Chi Chen, Haoyu Li, Weilin Zhao, et al. Efficient gpt-4v level multimodal large language model for deployment on edge devices. Nature Communications, 2025.
- Yin et al. [2025] Baiqiao Yin, Qineng Wang, Pingyue Zhang, Jianshu Zhang, Kangrui Wang, Zihan Wang, Jieyu Zhang, Keshigeyan Chandrasegaran, Han Liu, Ranjay Krishna, et al. Spatial mental modeling from limited views. In Structural Priors for Vision Workshop at ICCV’25, 2025.
- Zhang et al. [2025] Kai Zhang, Xiangchao Chen, Bo Liu, Tianci Xue, Zeyi Liao, Zhihan Liu, Xiyao Wang, Yuting Ning, Zhaorun Chen, Xiaohan Fu, et al. Agent learning via early experience. arXiv preprint arXiv:2510.08558, 2025.
- Zhao et al. [2025a] Qingqing Zhao, Yao Lu, Moo Jin Kim, Zipeng Fu, Zhuoyang Zhang, Yecheng Wu, Zhaoshuo Li, Qianli Ma, Song Han, Chelsea Finn, et al. Cot-vla: Visual chain-of-thought reasoning for vision-language-action models. In CVPR, 2025a.
- Zhao et al. [2025b] Xiangyu Zhao, Peiyuan Zhang, Kexian Tang, Xiaorong Zhu, Hao Li, Wenhao Chai, Zicheng Zhang, Renqiu Xia, Guangtao Zhai, Junchi Yan, et al. Envisioning beyond the pixels: Benchmarking reasoning-informed visual editing. In NeurIPS, 2025b.
- Zhou et al. [2025a] Chunting Zhou, Lili Yu, Arun Babu, Kushal Tirumala, Michihiro Yasunaga, Leonid Shamis, Jacob Kahn, Xuezhe Ma, Luke Zettlemoyer, and Omer Levy. Transfusion: Predict the next token and diffuse images with one multi-modal model. In ICLR, 2025a.
- Zhou et al. [2025b] Yiyang Zhou, Haoqin Tu, Zijun Wang, Zeyu Wang, Niklas Muennighoff, Fan Nie, Yejin Choi, James Zou, Chaorui Deng, Shen Yan, et al. When visualizing is the first step to reasoning: Mira, a benchmark for visual chain-of-thought. arXiv preprint arXiv:2511.02779, 2025b.
- Zou et al. [2025] Kai Zou, Ziqi Huang, Yuhao Dong, Shulin Tian, Dian Zheng, Hongbo Liu, Jingwen He, Bin Liu, Yu Qiao, and Ziwei Liu. Uni-mmmu: A massive multi-discipline multimodal unified benchmark. arXiv preprint arXiv:2510.13759, 2025.
## 7 Theorectical Analysis
### 7.1 Informativeness
In this section, we provide the rigorous version of our world model-based chain-of-thought formulations, and proofs for Theorem 1 and Theorem 2.
Formal problem setup and assumptions. Given a question $Q$ and input images $I$ , multimodal reasoning generates a chain-of-thought process $R$ , followed by a final answer $A$ . We explicitly formulate the reasoning process as an interleaving of logic reasoning steps and observations of the underlying MOMDP defined in Section 3.1: $R=(r_{1},o_{1}),(r_{2},o_{2}),\dots,(r_{H},o_{H})$ where $H$ denotes the (fixed) CoT length. For notation convenience, we denote the input image(s) as the initial observation $o_{0}$ .
We assume that each MOMDP observation function admits a two-stage decomposition: $e_{\phi}(s)=g_{\phi_{m}}\left(f_{\phi_{s}}(s)\right),\Phi=\Phi_{s}\times\Phi_{m}$ , where the inner modality-agnostic mapping $f_{\phi_{s}}$ (parameterized by $\phi_{s}\in\Phi_{s}$ ) extracts a slice of the underlying state $s$ , retaining only partial state information, and the outer modality-specific mapping $g_{\phi_{m}}$ (parameterized by $\phi_{m}\in\Phi_{m}$ ) renders the extracted slice into a particular observation modality.
Under this decomposition, we assume that reasoning across different modalities of observations shares a common underlying oracle reasoning process:
$$
p(Q,\bar{s}_{0},r_{1},\bar{s}_{1},\dots,r_{H},\bar{s}_{H},A)=p(Q)\left[\prod_{i=1}^{H}p(r_{i}|\bar{s}_{0:{i-1}},r_{1:i-1},Q)p(\bar{s}_{i}|\bar{s}_{0:i-1},r_{1:i},Q)\right]p(A|r_{1:H},\bar{s}_{0:H},Q),
$$
where $\bar{s}_{i}=(s_{i},{\phi_{s}}_{i})\in\mathcal{S}\times\Phi_{s}$ denotes a modality-agnostic sliced state. Each logic step $r_{i}$ is assumed to reason on sufficient sliced state information: $p(r_{i}\mid\bar{s}_{0:i-1},r_{1:i-1},Q)=p\!\left(r_{i}\mid f_{{\phi_{s}}_{0}}(s_{0}),\dots,f_{{\phi_{s}}_{i-1}}(s_{i-1}),r_{1:i-1},Q\right),$ and produces actionable outcomes that either (i) transit a previous world state $s_{j<i}$ via an implicit action $a_{i}$ : $\bar{s}_{i}=(s_{i},{\phi_{s}}_{j}),s_{i}\sim p(s_{j},a_{i})$ or (ii) query the same underlying world state with a new slice ${\phi_{s}}_{i}$ , yielding $\bar{s}_{i}=(s_{j},{\phi_{s}}_{i})$ The oracle reasoning process is then rendered into a specific modality via $o_{i}=g_{\phi_{m}}\!\left(f_{{\phi_{s}}_{i}}(s_{i})\right).$ Unless otherwise specified, we abuse notation and use $s_{i}$ to denote $\bar{s}_{i}=(s_{i},{\phi_{s}}_{i})$ in the remainder of our analysis.
Given the above oracle CoT generation process, we learn a model $p_{\theta}$ whose joint distribution over CoTs and answers factorizes into a reasoning component and a world-modeling component:
$$
\displaystyle p_{\theta}(R,A|Q,I)=p_{\theta}(r_{1},o_{1},r_{2},o_{2},\dots,r_{H},o_{H},r_{H+1}|r_{0},o_{0})=\prod_{i=1}^{H+1}p_{\theta}(r_{i}|R_{i})\prod_{i=1}^{H}p_{\theta}(o_{i}|\tilde{R}_{i}), \tag{8}
$$
where we denote the question as $r_{0}$ , the initial observation (input image(s)) as $o_{0}$ , and the final answer as $r_{H+1}$ . The CoT prefixes are defined as $R_{i}=(r_{0},o_{0},r_{1},o_{1},\dots,r_{i-1},o_{i-1}),\tilde{R}_{i}=(r_{0},o_{0},r_{1},o_{1},\dots,r_{i-1},o_{i-1},r_{i}).$
Proofs. We provide proofs of Theorem 1 and Theorem 2 below.
**Theorem 3 (Restatement of Theorem1)**
*For any observation modality $m$ , the following inequality holds:
$$
\displaystyle\operatorname{KL}(p(A\mid Q,I)\mid\mid p_{\theta}(A\mid Q,I)) \displaystyle\leq\operatorname{KL}(p(R,A\mid Q,I)\mid\mid p_{\theta}(R,A\mid Q,I)) \displaystyle= \displaystyle\sum_{i=1}^{H+1}\underbrace{\mathbb{E}_{p}\left[\operatorname{KL}(p(r_{i}|R_{i})\mid\mid p_{\theta}(r_{i}|R_{i}))\right]}_{\textnormal{reasoning errors}}+\sum_{i=1}^{H}\underbrace{\mathbb{E}_{p}\left[\operatorname{KL}(p(o_{i}|\tilde{R}_{i})\mid\mid p_{\theta}(o_{i}|\tilde{R}_{i}))\right]}_{\textnormal{world modeling errors}}. \tag{9}
$$*
* Proof*
The first inequality follows from the data processing inequality: marginalizing out $R$ cannot increase the KL divergence. For the equality, we apply the chain rule for KL divergence together with the CoT factorization in Eq. (8). In particular, substituting the factorizations of $p(R,A\mid Q,I)$ and $p_{\theta}(R,A\mid Q,I)$ into $\operatorname{KL}(p(R,A\mid Q,I)\,\|\,p_{\theta}(R,A\mid Q,I))$ leads to the stated decomposition. ∎
**Theorem 4 (Restatement of Theorem2)**
*For any observation modality $m$ , the reduction in reasoning uncertainty achieved by explicit world modeling satisfies:
1. Reasoning uncertainty does not increase: $\mathbb{H}(r_{i}\mid o_{0},r_{0:i-1})-\mathbb{H}(r_{i}|R_{i})=\mathbb{I}(o_{1:i-1};r_{i}\mid o_{0},r_{0:i-1})\geq 0.$
1. Uncertainty reduction is upper-bounded by both (i) the information that observations provide about the underlying states and (ii) the information that the reasoning step requires about those states:
$$
\mathbb{I}(o_{1:i-1};r_{i}\mid o_{0},r_{0:i-1})\leq\min\left(\mathbb{I}(o_{1:i-1};s_{1:i-1}),\mathbb{I}(r_{i};s_{0:i-1},r_{0:i-1})\right). \tag{10}
$$*
* Proof*
The first property follows the definition and the non-negativity of mutual information. For the second property, denote the conditioning context as $C=(o_{0},r_{0:i-1})$ . Using the properties of ternary mutual information: $\mathbb{I}(X;Y;Z)=\mathbb{I}(X;Y)-\mathbb{I}(X;Y\mid Z).$ we obtain
$$
\displaystyle\mathbb{I}(o_{1:i-1};r_{i}\mid C) \displaystyle=\mathbb{I}(o_{1:i-1};r_{i}\mid C)-\mathbb{I}(o_{1:i-1};r_{i}\mid s_{1:i-1},C)=\mathbb{I}(s_{1:i-1};o_{1:i-1};r_{i}\mid C) \displaystyle=\mathbb{I}(o_{1:i-1};s_{1:i-1}\mid C)-\mathbb{I}(o_{1:i-1};s_{1:i-1}\mid r_{i},C)\leq\mathbb{I}(o_{1:i-1};s_{1:i-1}\mid C), \tag{11}
$$
where $\mathbb{I}(o_{1:i-1};r_{i}|s_{1:i-1},C)=0$ follows from the conditional independence $r_{i}\perp o_{1:i-1}\mid s_{1:i-1}$ . Further, due to $o$ as the deterministic function of $s$ , we have:
| | $\displaystyle\mathbb{I}(o_{1:i-1};s_{1:i-1}\mid C)$ | $\displaystyle=\mathbb{H}(o_{1:i-1}\mid C)-\mathbb{H}(o_{1:i-1}\mid s_{1:i-1},C)$ | |
| --- | --- | --- | --- |
where $\mathbb{H}(o_{1:i-1}\mid s_{1:i-1})=\mathbb{H}(o_{1:i-1}\mid s_{1:i-1},C)=0.$ Symmetrically, we have:
| | $\displaystyle\mathbb{I}(o_{1:i-1};r_{i}|C)$ | $\displaystyle=\mathbb{I}(s_{1:i-1};o_{1:i-1};r_{i}\mid C)\leq\mathbb{I}(s_{1:i-1};r_{i}|C)=\mathbb{H}(r_{i}|C)-\mathbb{H}(r_{i}|s_{1:i-1},C)$ | |
| --- | --- | --- | --- |
where $\mathbb{H}(r_{i}|s_{0:i-1},r_{0:i-1})\leq\mathbb{H}(r_{i}|s_{1:i-1},o_{0},r_{0:i-1})$ due to data processing inequality. Combining the two upper bounds proves Eq. (10). ∎
**Corollary 1**
*If observations are fully informative about the underlying states, i.e., $\mathbb{H}(s_{i}\mid o_{i})=0$ for all $i$ , and the state transition dynamics are deterministic, then explicit world modeling provides no reduction in reasoning uncertainty: $\mathbb{I}(o_{1:i-1};r_{i}\mid o_{0},r_{0:i-1})=0.$*
* Proof*
By Eq. (11), we have
| | $\displaystyle\mathbb{I}(o_{1:i-1};r_{i}\mid o_{0},r_{0:i-1})\leq\mathbb{I}(o_{1:i-1};s_{1:i-1}\mid o_{0},r_{0:i-1})\leq\mathbb{H}(s_{1:i-1}\mid o_{0},r_{0:i-1}).$ | |
| --- | --- | --- |
Under the assumption $\mathbb{H}(s_{0}\mid o_{0})=0$ , the initial observation $o_{0}$ uniquely determines $s_{0}$ . Moreover, under deterministic state transitions, the trajectory $s_{1:i-1}$ is uniquely determined by $(s_{0},r_{1:i-1})$ . Hence,
$$
\mathbb{H}(s_{1:i-1}\mid o_{0},r_{1:i-1})=\mathbb{H}(s_{1:i-1}\mid s_{0},r_{1:i-1})=0.
$$
Therefore, $\mathbb{I}(o_{1:i-1};r_{i}\mid o_{0},r_{1:i-1})=0,$ which proves the corollary. ∎
Remarks. Corollary 1 shows that in deterministic and fully observable environments, given sufficient data and model capacity, explicit world modeling provides no additional benefit. This theoretical result is consistent with our empirical findings on the simple maze task.
### 7.2 Prior Knowledge
In this section, we first derive a generalization bound for transfer learning under distribution shift, and relate it to our perspective on prior knowledge in multimodal reasoning.
#### 7.2.1 General Transfer Learning Analysis
Problem setup. A standard transfer learning setup involves a pre-training data distribution $P$ and the fine-tuning data distribution $Q$ over samples $(x,y)\in\mathcal{X}\times\mathcal{Y}$ , and a loss function $\ell_{\theta}(x,y)\in[0,1].$ Define the population risks $\mathcal{L}_{D}(\theta):=\mathbb{E}_{(x,y)\sim D}[\ell_{\theta}(x,y)],D\in\{P,Q\}$ , and the population minimizers $\theta_{D}^{\star}\in\arg\min_{\theta\in\Theta}\mathcal{L}_{D}(\theta),D\in\{P,Q\}$ We assume we can obtain $\theta_{P}^{*}$ as the pre-trained model given sufficient data and optimization. For a radius $r>0$ , we then define the fine-tuning constraint set (local neighborhood around the pre-trained model)
$$
\Theta_{r}:=\{\theta\in\Theta:\ \|\theta-\theta_{P}^{*}\|\leq r\}.
$$
Given $n$ i.i.d. samples from $Q$ : $S=\left\{(x_{i},y_{i})_{i=1}^{n}\right\},(x_{i},y_{i})\sim Q$ , the fine-tuned model $\theta_{Q}$ minimize empirical risk over $\Theta_{r}$ , $\widehat{\mathcal{L}}_{Q}(\theta):=\frac{1}{n}\sum_{i=1}^{n}[\ell_{\theta}(x_{i},y_{i})].$ Our analysis focus on the excess risk on $Q$ : $\mathcal{E}_{Q}(\theta_{Q}):=\mathcal{L}_{Q}(\theta_{Q})-\mathcal{L}_{Q}(\theta_{Q}^{\star}).$
From distribution shift to parameter drift. We first derive how the distribution shift relates to the shift of the population minimizer.
**Lemma 1 (Uniform Loss Shift under Total Variation)**
*For any subset $\mathcal{S}\subseteq\Theta$ ,
$$
\sup_{\theta\in\mathcal{S}}\big|\mathcal{L}_{Q}(\theta)-\mathcal{L}_{P}(\theta)\big|\leq\mathrm{TV}(P,Q).
$$*
* Proof*
Fix any $\theta\in\mathcal{S}$ and define $f_{\theta}(h,a,o^{\prime}):=\ell_{\theta}(h,a,o^{\prime})\in[0,1]$ . By the definition of total variation and the standard inequality for bounded functions, $\big|\mathbb{E}_{Q}[f_{\theta}]-\mathbb{E}_{P}[f_{\theta}]\big|\leq\mathrm{TV}(P,Q).$ Taking the supremum over $\theta\in\mathcal{S}$ yields the claim. ∎
**Lemma 2 (Risk Proximity ofθQ⋆\theta_{Q}^{\star}underPP)**
*$$
\mathcal{L}_{P}(\theta_{Q}^{\star})\leq\mathcal{L}_{P}(\theta_{P}^{\star})+2\mathrm{TV}(P,Q). \tag{12}
$$*
* Proof*
By Lemma 1, $\mathcal{L}_{P}(\theta_{Q}^{\star})\leq\mathcal{L}_{Q}(\theta_{Q}^{\star})+\mathrm{TV}(P,Q).$ By optimality of $\theta_{Q}^{\star}$ on $Q$ , $\mathcal{L}_{Q}(\theta_{Q}^{\star})\leq\mathcal{L}_{Q}(\theta_{P}^{\star}).$ Applying Lemma 1 again, $\mathcal{L}_{Q}(\theta_{P}^{\star})\leq\mathcal{L}_{P}(\theta_{P}^{\star})+\mathrm{TV}(P,Q).$ Chaining the three inequalities proves (12). ∎
**Assumption 1 (Local Quadratic Growth / Sharpness ofℒP\mathcal{L}_{P})**
*There exists $\mu>0$ such that for all $\theta$ in a neighborhood containing $\theta_{Q}^{\star}$ ,
$$
\mathcal{L}_{P}(\theta)\geq\mathcal{L}_{P}(\theta_{P}^{\star})+\frac{\mu}{2}\|\theta-\theta_{P}^{\star}\|^{2}.
$$*
**Lemma 3 (Parameter Drift Controlled byTV(P,Q)\mathrm{TV}(P,Q))**
*Under Assumption 1,
$$
\|\theta_{Q}^{\star}-\theta_{P}^{\star}\|\leq\sqrt{\frac{4}{\mu}\,\mathrm{TV}(P,Q)}. \tag{13}
$$*
* Proof*
By Assumption 1 with $\theta=\theta_{Q}^{\star}$ , $\mathcal{L}_{P}(\theta_{Q}^{\star})\geq\mathcal{L}_{P}(\theta_{P}^{\star})+\frac{\mu}{2}\|\theta_{Q}^{\star}-\theta_{P}^{\star}\|^{2}.$ Rearranging, $\frac{\mu}{2}\|\theta_{Q}^{\star}-\theta_{P}^{\star}\|^{2}\leq\mathcal{L}_{P}(\theta_{Q}^{\star})-\mathcal{L}_{P}(\theta_{P}^{\star}).$ Applying Lemma 2 yields $\frac{\mu}{2}\|\theta_{Q}^{\star}-\theta_{P}^{\star}\|^{2}\leq 2\mathrm{TV}(P,Q),$ and hence (13). ∎
Control of the bias term. Recall the fine-tuning bias induced by restricting to $\Theta_{r}$ : $\varepsilon_{\mathrm{bias}}(r):=\inf_{\theta\in\Theta_{r}}\mathcal{L}_{Q}(\theta)-\mathcal{L}_{Q}(\theta_{Q}^{\star}).$
**Assumption 2 (ℒQ\mathcal{L}_{Q}is Locally Lipschitz)**
*There exists $L_{Q}>0$ such that for all $\theta,\theta^{\prime}\in\Theta_{r}$ ,
$$
|\mathcal{L}_{Q}(\theta)-\mathcal{L}_{Q}(\theta^{\prime})|\leq L_{Q}\|\theta-\theta^{\prime}\|.
$$*
**Theorem 5 (Bias Bound via Distribution Shift)**
*Under Assumption 1 and Assumption 2,
$$
\varepsilon_{\mathrm{bias}}(r)\leq L_{Q}\left(\sqrt{\frac{4}{\mu}\,\mathrm{TV}(P,Q)}-r\right)_{+}, \tag{14}
$$
where $(x)_{+}:=\max\{x,0\}$ . In particular, if $r\geq\sqrt{\frac{4}{\mu}\,\mathrm{TV}(P,Q)},$ then $\varepsilon_{\mathrm{bias}}(r)=0$ .*
* Proof*
If $r\geq\|\theta_{Q}^{\star}-\theta_{P}^{\star}\|$ , then $\theta_{Q}^{\star}\in\Theta_{r}$ and thus $\inf_{\theta\in\Theta_{r}}\mathcal{L}_{Q}(\theta)\leq\mathcal{L}_{Q}(\theta_{Q}^{\star})$ , implying $\varepsilon_{\mathrm{bias}}(r)=0$ . Now consider $r<\|\theta_{Q}^{\star}-\theta_{P}^{\star}\|$ . Let $\theta_{r}$ be the projection of $\theta_{Q}^{\star}$ onto the closed ball $\Theta_{r}$ , i.e., $\theta_{r}:=\theta_{P}+r\cdot\frac{\theta_{Q}^{\star}-\theta_{P}^{\star}}{\|\theta_{Q}^{\star}-\theta_{P}^{\star}\|}$ . Then $\theta_{r}\in\Theta_{r}$ and $\|\theta_{r}-\theta_{Q}^{\star}\|=\|\theta_{Q}^{\star}-\theta_{P}^{\star}\|-r.$ Therefore,
$$
\varepsilon_{\mathrm{bias}}(r)=\inf_{\theta\in\Theta_{r}}\mathcal{L}_{Q}(\theta)-\mathcal{L}_{Q}(\theta_{Q}^{\star})\leq\mathcal{L}_{Q}(\theta_{r})-\mathcal{L}_{Q}(\theta_{Q}^{\star})\leq L_{Q}\|\theta_{r}-\theta_{Q}^{\star}\|=L_{Q}(\|\theta_{Q}^{\star}-\theta_{P}^{\star}\|-r).
$$
Using Lemma 3 to bound $\|\theta_{Q}^{\star}-\theta_{P}\|$ completes the proof of (14). ∎
Fine-tuning excess risk bound. We then arrive at the final result:
**Theorem 6 (Fine-tuning Excess Risk Bound with Shift-Controlled Bias)**
*Assume Assumptions 1 and 2 and uniform convergence over $\Theta_{r}$ holds: with probability at least $1-\delta$ over samples $S$ ,
$$
\sup_{\theta\in\Theta_{r}}\big|\mathcal{L}_{Q}(\theta)-\widehat{\mathcal{L}}_{Q}(\theta)\big|\leq\varepsilon_{\mathrm{gen}}=O\!\left(\sqrt{\frac{\operatorname{Rad}_{Q,n}(\Theta_{r})+\log(1/\delta)}{n}}\right),
$$
where $\operatorname{Rad}_{Q,n}(\Theta_{r})$ is the Rademacher complexity of of the function class $\{\ell_{\theta},\theta\in\Theta_{r}\}$ with respect to $Q$ for sample size $n$ . Then with probability at least $1-\delta$ ,
$$
\mathcal{E}_{Q}(\theta_{Q})\leq 2\varepsilon_{\mathrm{gen}}+L_{Q}\left(\sqrt{\frac{4}{\mu}\,\mathrm{TV}(P,Q)}-r\right)_{+}. \tag{15}
$$*
* Proof*
Decompose the excess risk as $\mathcal{E}_{Q}(\theta_{Q})=\Big(\mathcal{L}_{Q}(\theta_{Q})-\inf_{\theta\in\Theta_{r}}\mathcal{L}_{Q}(\theta)\Big)+\varepsilon_{\mathrm{bias}}(r).$ The first term is bounded by a standard ERM argument using uniform convergence: $\mathcal{L}_{Q}(\theta_{Q})-\inf_{\theta\in\Theta_{r}}\mathcal{L}_{Q}(\theta)\leq 2\varepsilon_{\mathrm{gen}}.$ The second term is bounded by Lemma 5. Combining the two bounds yields (15). ∎
#### 7.2.2 Remarks on Multimodal Reasoning
Theorem 6 reveals a trade-off between modality complexity and distribution shift. This general transfer learning analysis can be instantiated in our setting of learning world models and reasoning policies. Specifically, training pairs $(x,y)$ can be instantiated as $((o_{0:i},r_{0:{i+1}}),o_{i+1})$ for world modeling and $((o_{0:i},r_{0:{i}}),r_{i})$ for reasoning, respectively. Crucially, the distribution shift between large-scale pre-training data and downstream tasks may differ substantially across modalities. For example, there are abundant visual demonstrations of paper folding on the Internet, whereas detailed verbal descriptions of folding dynamics are comparatively scarce. This suggests that downstream tasks should be formulated under the most appropriate observation modality for world modeling and reasoning—i.e., the modality that best aligns with pre-training data—in order to achieve stronger generalization at inference time and higher sample efficiency during post-training.
## 8 Experiment Details
### 8.1 VisWorld-Eval and Training Data
In this section, we elaborate on the construction of training and test data for each task in VisWorld-Eval.
Paper folding. This task involves folding a paper grid with varying grid sizes (3–8) and folding steps (1–4). After folding, holes of different shapes—circles, triangles, stars, diamonds, and squares—are punched into the paper. The model is then asked to predict the distribution of holes after the paper is completely unfolded, including queries such as the total number of holes, the number of holes of a specific shape, or the difference in counts between shapes. All test prompts are constructed at the highest difficulty level (grid size 8 with 4 folding steps). For SFT, we generate chain-of-thoughts using rule-based templates that follow a fixed procedure: unfold the paper step-by-step and then count the resulting holes by shape. These CoTs are then rewritten with Gemini 2.5 Pro to improve clarity and logical coherence. Under visual world modeling, we interleave reasoning steps with images of partially unfolded paper states. Under verbal world modeling, we represent intermediate states using two matrices encoding grid coverage status and hole shape at each position. Under implicit world modeling, we directly skip the explicit tracking of states from original CoTs.
Multi-hop manipulation. This task begins with an initial arrangement of several geometric objects (cubes, spheres, and cylinders) in various colors, rendered by Blender https://www.blender.org/. A sequence of text-based instructions is then provided, describing operations such as changing or swapping objects’ color or shape, adding new objects, or removing existing ones. To ensure these commands can be interpreted unambiguously in a 3D space, the instructions consistently use relative spatial references, with each object uniquely identified by its combined color and shape attributes—for example: "Place a purple cylinder between the black sphere and the yellow cube." The model is asked to infer the resulting spatial layout. Queries may include the total number of objects of a specific shape, the directional relationship between two objects, or which object lies in a given direction relative to a reference object. Test prompts are constructed by varying both the number of initial objects (between 3 and 6) and the frequency (between 1 and 5) of different operation types. For SFT, chain-of-thought reasoning is generated using rule-based templates that simulate the stepwise execution of instructions before answering the final query, and these CoTs are subsequently refined with Gemini 2.5 Pro.
Ball tracking. This task features a red point-mass ball that moves at constant speed, reflects elastically off solid walls, and travels in the initial direction indicated by a green arrow. The model is asked to predict which numbered hole at the top of the image the ball will enter first. We generate input images with randomized resolution, initial ball position and direction, and a random number of holes (4–8). For test prompts, we select cases in which the ball trajectory reflects off at least one wall before entering a hole. For SFT, CoTs are generated by Seed 1.6, which is asked to explain the ball dynamics between adjacent frames.
Sokoban. Sokoban is a classic grid-based puzzle game. We generate instances with grid sizes ranging from 6 to 10, containing a single box and a target position. Test prompts are sampled from the same distribution as the training data. To construct CoTs, we use a search algorithm to compute an optimal solution path. To avoid excessively long trajectories, we render only key intermediate steps, including: (i) the player moving toward the box, (ii) pushing the box in a direction, and (iii) changing the pushing direction. To encourage reflective behavior, we additionally augment trajectories with randomized detours that involve walking into walls, reflecting, and backtracking to rejoin the optimal path. CoTs are generated by Seed 1.6, which explains the dynamics between adjacent frames. For visual world modeling, the rendered intermediate steps are interleaved with verbal CoTs. For pure verbal world modeling, these intermediate renderings are removed. For implicit world modeling, we additionally mask all explicit coordinates during CoTs with special tokens [masked].
Maze. Maze is a classic grid-based puzzle task. We generate both training and test samples with a fixed grid size of $5\times 5$ . To construct CoTs, we use rule-based templates followed by rewriting for improved naturalness. Under visual world modeling, rendered intermediate steps through points and lines are interleaved with verbal CoTs. The settings for verbal and implicit world modeling follow the same protocol as in Sokoban, with masking special tokens as <point>[masked]</point>.
Cube 3-view projection. This task considers stacks of colored cubes arranged on grids of varying sizes (3–5), with two cube colors. The input consists of one isometric view (either front-left or front-right) and two orthographic views of the stack. The question asks for the number of cubes of a specified color visible from another orthogonal view. Both the questions and answer choices account for ambiguity caused by occlusions, leading to uncertainty in the cube count. All test prompts are constructed using uniformly random grid sizes between 3 and 5. We generate CoTs using rule-based templates: the model first constructs the queried view, marks potentially occluded cubes using a third (auxiliary) color, and then counts cubes by color. These CoTs are subsequently rewritten by Gemini 2.5 Pro for improved naturalness. Under visual world modeling, we interleave reasoning steps with an image of the queried view. Under verbal world modeling, we represent intermediate views using character matrices, where different colors are encoded by different symbols.
Real-world spatial reasoning. For this real-world task, we directly adopt test samples from MMSI-Bench, focusing on camera–object and camera–region positional relationship questions. We construct training prompts following a pipeline similar to Yang et al. [68]. To obtain training CoTs, we run a visual-CoT model, which uses an SFT-trained BAGEL model for novel view synthesis as a tool. The resulting visual CoTs are subsequently filtered and rewritten by Gemini 2.5 Pro.
We summarize the training and test sample counts for each task in VisWorld-Eval, along with the corresponding original or referenced benchmarks, in Table 2.
Table 2: Overview of VisWorld-Eval and corresponding training data: features, statistics, and references.
| Task | Capability | Domain | Training Samples | Test Samples | Source/Reference |
| --- | --- | --- | --- | --- | --- |
| Paper folding | Simulation | Synthetic | 2,357 | 480 | SpatialViz [61] |
| Multi-hop manipulation | Simulation | Synthetic | 2,000 | 480 | ZebraCoT [35], CLEVR [30] |
| Ball tracking | Simulation | Synthetic | 2,254 | 1,024 | RBench-V [20] |
| Maze | Simulation | Synthetic | 8,448 | 480 | maze-dataset [29] |
| Sokoban | Simulation | Synthetic | 7,715 | 480 | GameRL [55] |
| Cube 3-view projection | Reconstruction | Synthetic | 2,500 | 480 | SpatialViz [61] |
| Real-world spatial reasoning | Reconstruction | Real-world | 10,661 | 522 | MMSI-Bench [69] |
Examples of training CoTs are presented in Figure 10, 11, 12, 13, and 14.
### 8.2 Model Training
We perform supervised fine-tuning (SFT) of BAGEL based on its official repository https://github.com/ByteDance-Seed/Bagel, using 8 GPUs, and conduct reinforcement learning from verifiable rewards (RLVR) using verl https://github.com/volcengine/verl on 64 GPUs. Hyperparameters for SFT and RLVR are reported in Table 4 and Table 4, respectively.
Table 3: Hyperparameters for supervised fine-tuning UMMs.
| Hyperparameter | Value |
| --- | --- |
| Learning rate | $3\times 10^{-5}$ |
| LR Schedule | Constant |
| Optimizer | AdamW |
| Loss weight (CE:MSE) | 1:10 |
| Warm-up steps | 200 |
| Training steps | 4000 |
| Gen. resolution | (256, 1024) for paper folding, cube 3-view |
| (240, 1024) for multi-hop manipulation | |
| (256, 512) otherwise | |
| Und. resolution | (224, 980) |
| Sequence length per rank | 32K |
| Num. ranks | 8 |
Table 4: Hyperparameters for reinforcement learning UMMs.
| Hyperparameter | Value |
| --- | --- |
| Learning rate | $1\times 10^{-5}$ |
| Batch size | 128 |
| GRPO mini batch size | 32 |
| Group size | 16 |
| KL loss coefficient for visual gen. | 0.1 |
| KL loss coefficient for verbal gen. | 0.0 |
<details>
<summary>x12.png Details</summary>
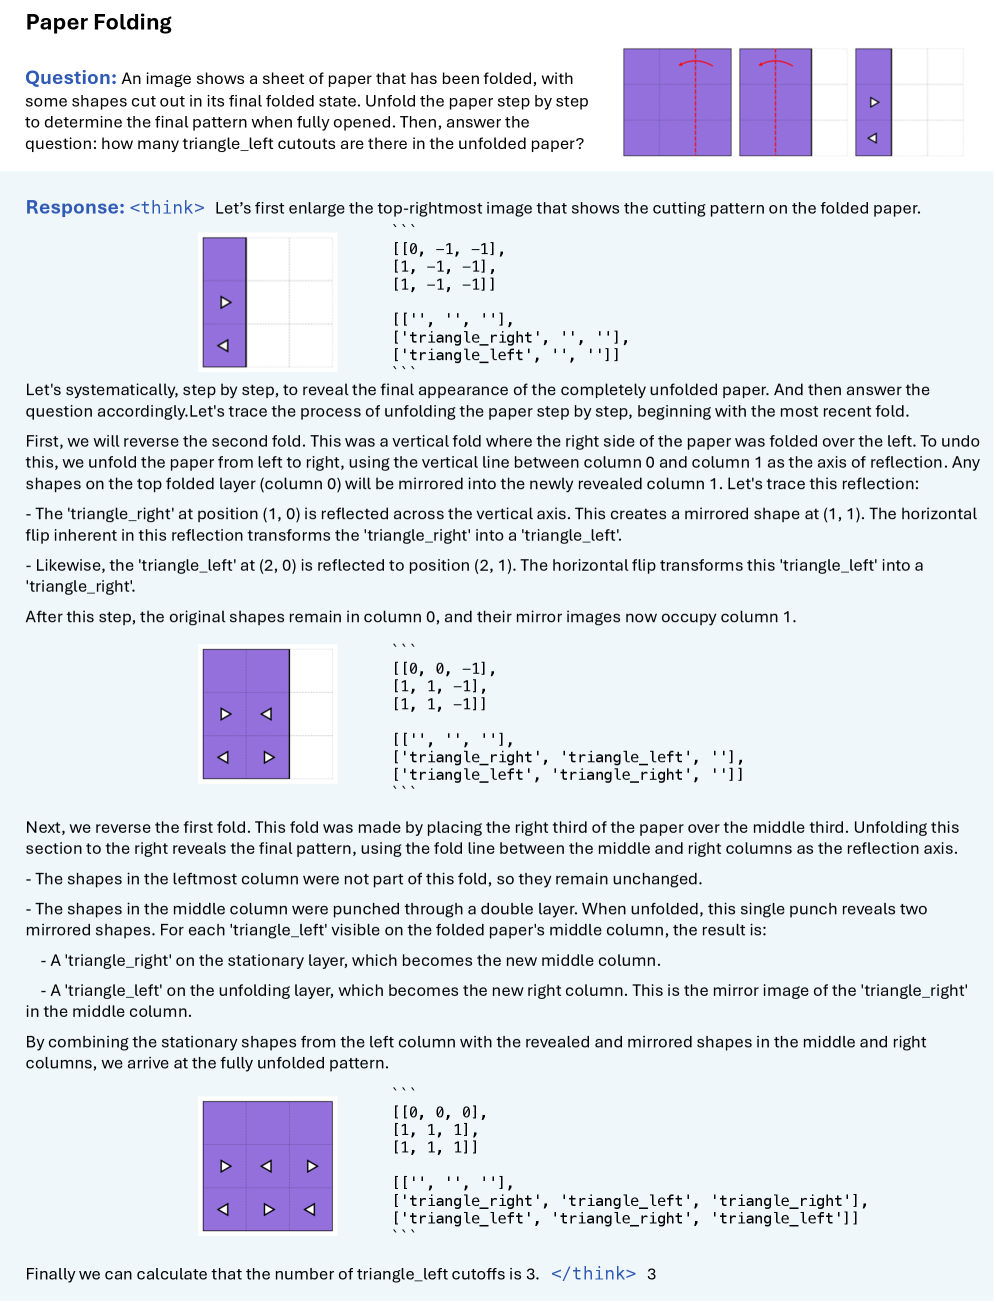
### Visual Description
## Paper Folding Problem: Step-by-Step Unfolding Solution
### Overview
The image displays a technical explanation of a spatial reasoning puzzle involving paper folding and cutouts. It presents a problem where a folded paper with cut shapes must be mentally unfolded to determine the final pattern. The response provides a systematic, step-by-step solution with accompanying diagrams and symbolic representations of the paper's state at each stage.
### Components/Axes
The image is structured as a document with the following sections:
1. **Title:** "Paper Folding"
2. **Question Section:** Contains the problem statement and a visual of the folded paper.
3. **Response Section:** Contains a detailed thinking process with embedded diagrams and textual explanations.
4. **Diagrams:** Three key diagrams showing the paper's state:
* Initial folded state (top-right of question).
* State after reversing the second fold.
* Final fully unfolded state.
5. **Symbolic Representations:** Each diagram is accompanied by two arrays:
* A numerical grid (e.g., `[[0, -1, -1], ...]`) representing the paper's layers or fold state.
* A string grid (e.g., `[['', '', ''], ['triangle_right', ...]]`) labeling the cutout shapes in each cell.
### Detailed Analysis
**1. Problem Statement:**
* **Text:** "Question: An image shows a sheet of paper that has been folded, with some shapes cut out in its final folded state. Unfold the paper step by step to determine the final pattern when fully opened. Then, answer the question: how many triangle_left cutouts are there in the unfolded paper?"
* **Visual:** A purple rectangle representing the folded paper. It shows two visible cutouts: a right-pointing triangle (`triangle_right`) in the top cell and a left-pointing triangle (`triangle_left`) in the bottom cell of the leftmost column.
**2. Step 1: Initial State & Enlargement**
* The response begins by enlarging the folded paper view.
* **Symbolic State (Folded):**
* Numerical Grid: `[[0, -1, -1], [1, -1, -1], [1, -1, -1]]`
* String Grid: `[['', '', ''], ['triangle_right', '', ''], ['triangle_left', '', '']]`
* **Interpretation:** The grid appears to be 3 rows x 3 columns. The `-1` likely indicates folded/hidden layers. The visible cutouts are in column 0, rows 1 and 2.
**3. Step 2: Reversing the Second Fold (Vertical Unfold)**
* **Process:** A vertical fold where the right side was folded over the left is undone. The axis of reflection is the line between column 0 and column 1.
* **Transformation Logic:**
* The `triangle_right` at position (1, 0) is mirrored to (1, 1). The horizontal flip transforms it into a `triangle_left`.
* The `triangle_left` at position (2, 0) is mirrored to (2, 1). The horizontal flip transforms it into a `triangle_right`.
* **Resulting State (After 1st Unfold):**
* **Diagram:** Shows a 2-column wide purple area. Column 0 has the original cutouts. Column 1 has their mirrored counterparts.
* Numerical Grid: `[[0, 0, -1], [1, 1, -1], [1, 1, -1]]`
* String Grid: `[['', '', ''], ['triangle_right', 'triangle_left', ''], ['triangle_left', 'triangle_right', '']]`
* **Spatial Grounding:** The legend (string grid) confirms the shapes in each cell. The diagram visually matches: Row 1 has a right triangle then a left triangle. Row 2 has a left triangle then a right triangle.
**4. Step 3: Reversing the First Fold (Horizontal Unfold)**
* **Process:** A fold where the right third was placed over the middle third is undone. The reflection axis is between the middle and right columns.
* **Transformation Logic:**
* Left column shapes are unchanged.
* Middle column shapes were punched through a double layer. Unfolding reveals two mirrored shapes for each original cutout:
* A `triangle_right` on the stationary layer (becomes the new middle column).
* A `triangle_left` on the unfolding layer (becomes the new right column).
* **Resulting State (Fully Unfolded):**
* **Diagram:** Shows a 3-column wide purple area. All cells in rows 1 and 2 contain cutouts.
* Numerical Grid: `[[0, 0, 0], [1, 1, 1], [1, 1, 1]]`
* String Grid: `[['', '', ''], ['triangle_right', 'triangle_left', 'triangle_right'], ['triangle_left', 'triangle_right', 'triangle_left']]`
* **Spatial Grounding:** The final diagram shows a clear pattern. Row 1: Right, Left, Right. Row 2: Left, Right, Left. The string grid provides the precise labels for each of the 6 cutout positions.
**5. Final Answer:**
* **Text:** "Finally we can calculate that the number of triangle_left cutoffs is 3. </think> 3"
* **Data Extraction:** Counting `triangle_left` in the final string grid:
* Row 1, Column 1: `triangle_left`
* Row 2, Column 0: `triangle_left`
* Row 2, Column 2: `triangle_left`
* **Total: 3**
### Key Observations
1. **Pattern Emergence:** The unfolding process transforms a simple two-cutout folded state into a symmetrical, checkerboard-like pattern of alternating triangle orientations across a 2x3 grid (rows 1 and 2).
2. **Mirroring Logic:** Each unfolding step applies a precise mirroring transformation that also flips the orientation of the triangular cutouts (`right` ↔ `left`).
3. **Data Representation:** The solution uses a dual-array system (numerical for fold state, string for shape identity) to track the paper's state programmatically, which is a common technique in computational geometry or puzzle-solving algorithms.
4. **Efficiency:** The thinking process is highly systematic, reversing the fold sequence exactly, which guarantees an accurate reconstruction.
### Interpretation
This document is a clear example of **spatial reasoning decomposed into a logical, algorithmic process**. It demonstrates how a complex mental visualization task (unfolding paper) can be broken down into discrete, rule-based steps.
* **What the data suggests:** The final pattern is not random; it's a direct, deterministic consequence of the initial fold sequence and cut locations. The alternating triangle pattern reveals an underlying symmetry created by the reflection operations.
* **How elements relate:** The diagrams, numerical grids, and string grids are three parallel representations of the same information. The diagrams provide intuitive visual confirmation, the numerical grids likely model the physical fold structure (with `-1` representing hidden layers), and the string grids provide the essential semantic data (shape type) needed to answer the question.
* **Notable Anomaly/Insight:** The key insight is that a single cut through a multi-layer fold produces multiple, mirrored cuts in the final pattern. The solution correctly accounts for this by generating two shapes (a stationary and a mirrored one) for each cut in the doubly-layered middle column during the final unfold. This is the core principle that leads to the final count of three `triangle_left` shapes.
</details>
Figure 10: Examples of chain-of-thought SFT data for the paper folding task, under visual world modeling (left) and verbal world modeling (right).
<details>
<summary>x13.png Details</summary>
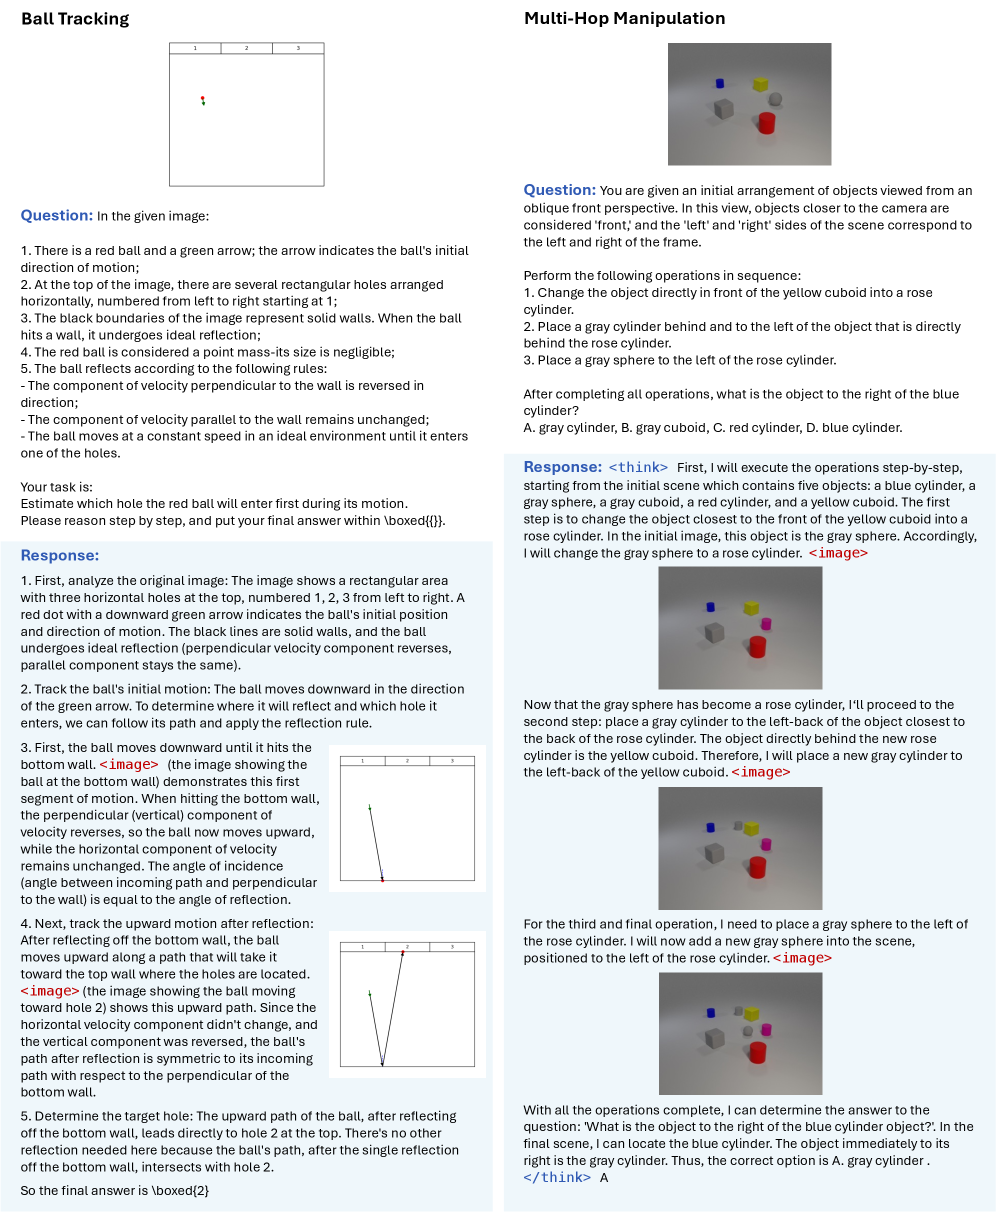
### Visual Description
## Technical Document: Problem-Solving Examples in Physics and Spatial Reasoning
### Overview
The image is a composite technical document presenting two distinct problem-solving examples. The left section, titled "Ball Tracking," involves a 2D physics problem about a ball reflecting off walls to determine which hole it enters. The right section, titled "Multi-Hop Manipulation," involves a 3D spatial reasoning problem about manipulating objects in a scene. Both sections include a problem statement, a step-by-step response with embedded illustrative images, and a final answer.
### Components/Axes
The document is divided into two primary columns:
**Left Column: Ball Tracking**
* **Title:** "Ball Tracking"
* **Diagram:** A simple 2D schematic showing a rectangular area with three numbered holes (1, 2, 3) at the top. A red dot (ball) with a downward-pointing green arrow (initial velocity) is positioned in the lower-left area. Black lines represent solid walls.
* **Question Text:** A numbered list (1-5) defining the scenario, rules, and the task: "Estimate which hole the red ball will enter first during its motion."
* **Response Text:** A numbered list (1-5) providing a step-by-step solution, referencing embedded images.
* **Embedded Images:** Three smaller versions of the main diagram, illustrating the ball's path at different stages: initial motion, after hitting the bottom wall, and moving toward hole 2.
* **Final Answer:** "So the final answer is \boxed{2}"
**Right Column: Multi-Hop Manipulation**
* **Title:** "Multi-Hop Manipulation"
* **Diagram:** A 3D rendered scene viewed from an oblique front perspective. Initial objects include a blue cylinder, gray sphere, gray cuboid, red cylinder, and yellow cuboid on a gray plane.
* **Question Text:** Describes the initial scene and lists three sequential operations to perform. The final question is: "After completing all operations, what is the object to the right of the blue cylinder?" with multiple-choice options (A. gray cylinder, B. gray cuboid, C. red cylinder, D. blue cylinder).
* **Response Text:** A narrative walkthrough of each operation, referencing embedded images that show the scene after each step.
* **Embedded Images:** Three 3D rendered scenes showing the state after each of the three operations.
* **Final Answer:** "Thus, the correct option is A. gray cylinder."
### Detailed Analysis
**Ball Tracking Problem:**
1. **Initial State:** A red ball is at a starting position with an initial velocity vector pointing straight down (indicated by a green arrow).
2. **Environment:** A rectangular enclosure with solid walls (black lines) and three target holes (1, 2, 3) on the top wall.
3. **Physics Rules:** Ideal reflection. The component of velocity perpendicular to a wall reverses direction upon impact, while the parallel component remains unchanged. The ball moves at constant speed.
4. **Solution Path:**
* The ball moves downward until it hits the bottom wall.
* Upon reflection, its vertical velocity component reverses (now moving upward), while its horizontal component is unchanged.
* The path after reflection is symmetric to the incoming path relative to the point of impact on the bottom wall.
* This symmetric upward path leads directly to hole #2 on the top wall.
5. **Conclusion:** The ball enters hole 2 first.
**Multi-Hop Manipulation Problem:**
1. **Initial Scene (from text description):** Contains five objects: a blue cylinder, a gray sphere, a gray cuboid, a red cylinder, and a yellow cuboid.
2. **Operation 1:** "Change the object directly in front of the yellow cuboid into a rose cylinder."
* **Execution:** The gray sphere is identified as being in front of the yellow cuboid. It is transformed into a rose cylinder.
3. **Operation 2:** "Place a gray cylinder behind and to the left of the object that is directly behind the rose cylinder."
* **Execution:** The object directly behind the new rose cylinder is the yellow cuboid. A new gray cylinder is placed behind and to the left of the yellow cuboid.
4. **Operation 3:** "Place a gray sphere to the left of the rose cylinder."
* **Execution:** A new gray sphere is added to the scene, positioned to the left of the rose cylinder.
5. **Final Query:** Identify the object to the right of the blue cylinder in the final scene.
* **Analysis:** In the final configuration, the blue cylinder is present. The object immediately to its right is the gray cylinder placed in Operation 2.
6. **Conclusion:** The correct answer is A. gray cylinder.
### Key Observations
* **Pedagogical Structure:** Both examples follow a clear "problem → step-by-step reasoning → solution" format, making them effective for teaching problem-solving methodologies.
* **Visual Reasoning:** Each problem heavily relies on interpreting and manipulating visual information—2D trajectories in one, 3D object relationships in the other.
* **Implicit Information:** The "Multi-Hop" problem requires inferring spatial prepositions ("in front of," "behind and to the left") from a single 2D image of a 3D scene, which is a non-trivial cognitive task.
* **Precision in Language:** The problems use precise, operational language ("ideal reflection," "directly in front of," "behind and to the left") to define unambiguous tasks.
### Interpretation
This document serves as a demonstration of **structured analytical reasoning** applied to two different domains: classical mechanics and 3D spatial manipulation.
* **Underlying Principles:** The "Ball Tracking" problem tests understanding of vector decomposition and the law of reflection. The solution hinges on recognizing the symmetry of the path after a single reflection. The "Multi-Hop Manipulation" problem tests sequential logic and spatial relationship tracking. It requires maintaining an accurate mental model of a changing scene.
* **Relationship Between Elements:** In both cases, the initial conditions and rules are fully defined in the question. The response then acts as a **proof of work**, showing how the final answer is logically derived from those premises without external knowledge. The embedded images are not decorative; they are critical evidence supporting each step of the reasoning.
* **Notable Patterns:** The solutions avoid complex calculations. Instead, they rely on **geometric insight** (symmetry of reflection) and **careful bookkeeping** (tracking object identities and positions through transformations). This highlights that the core challenge is logical structuring, not computational power.
* **Broader Context:** These types of problems are foundational in fields like physics education, robotics (path planning and object manipulation), and artificial intelligence (testing spatial reasoning and multi-step planning capabilities). The document likely originates from a technical paper, textbook, or AI benchmarking suite designed to evaluate or teach systematic problem-solving skills.
</details>
Figure 11: Examples of chain-of-thought SFT data for the ball tracking and multi-hop manipulation task.
<details>
<summary>x14.png Details</summary>
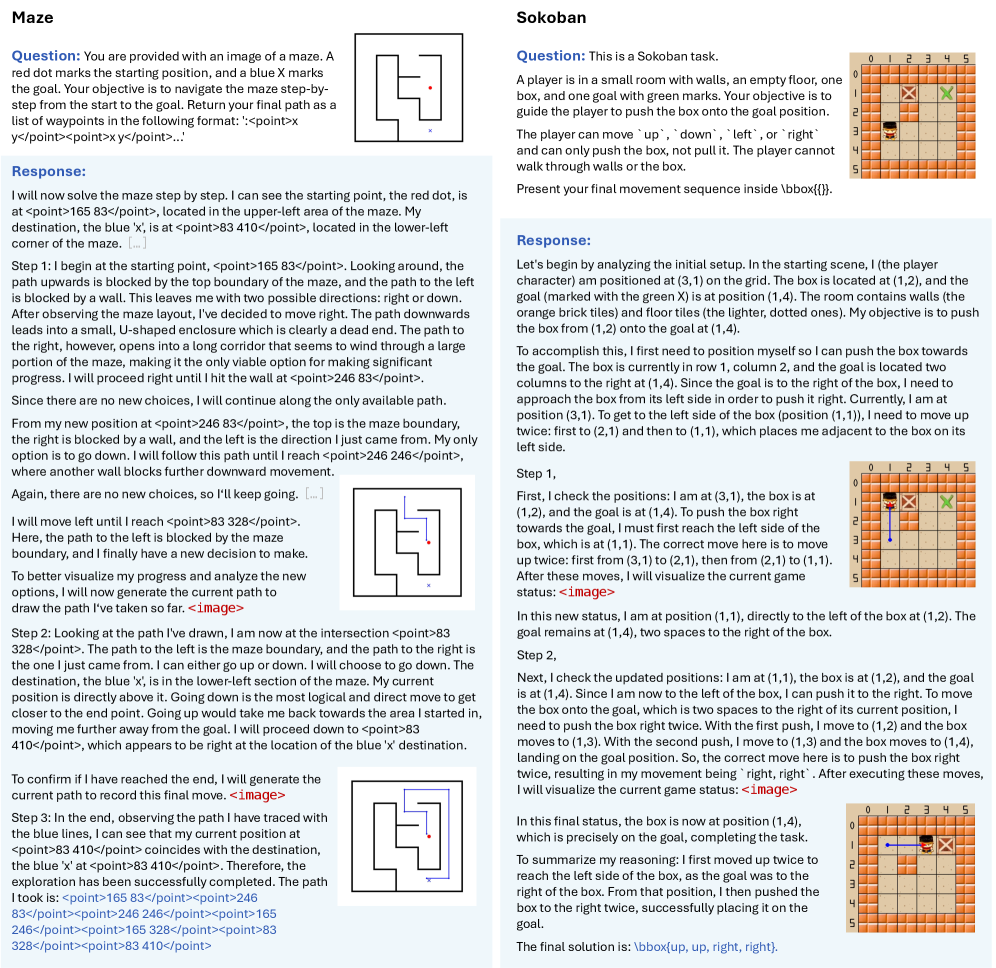
### Visual Description
## Technical Document Extraction: Maze and Sokoban Problem-Solving Examples
### Overview
The image is a composite technical document presenting two distinct spatial reasoning tasks: a **Maze navigation problem** (left column) and a **Sokoban puzzle** (right column). Each section includes a problem statement, a step-by-step solution response with embedded visualizations, and final answers. The document appears to be from a technical paper or report demonstrating an AI agent's ability to solve visual-spatial problems.
---
### **Left Column: Maze Task**
#### Components/Axes
* **Title:** "Maze"
* **Question Text:** "You are provided with an image of a maze. A red dot marks the starting position, and a blue X marks the goal. Your objective is to navigate the maze step-by-step from the start to the goal. Return your final path as a list of waypoints in the following format: `<point>x y</point><point>x y</point>...`"
* **Visual Elements:**
* A square maze grid with black walls on a white background.
* A **red dot** (starting point) located in the upper-left quadrant.
* A **blue 'X'** (goal) located in the lower-left quadrant.
* A **blue line** tracing the agent's path through the maze, shown in three progressive stages.
* **Response Text:** A detailed, step-by-step narrative of the navigation process, including decision-making at intersections and dead ends.
#### Detailed Analysis
**Step 1:**
* **Starting Point:** Identified at `<point>165 83</point>` (upper-left area).
* **Goal Point:** Identified at `<point>83 410</point>` (lower-left corner).
* **Initial Decision:** From start, right is chosen as the only viable path (down leads to a U-shaped dead end).
* **Path:** Moves right until hitting a wall at `<point>246 83</point>`, then proceeds down.
* **Visualization:** First embedded `<image>` shows the initial path segment (blue line) from the start, moving right and then down.
**Step 2:**
* **Current Position:** `<point>83 328</point>` (at an intersection).
* **Decision:** Chooses to go down, as it leads directly toward the goal's vertical level.
* **Path:** Proceeds down to `<point>83 410</point>`, which aligns with the goal's location.
* **Visualization:** Second embedded `<image>` shows the extended path, now reaching the goal's vicinity.
**Step 3 (Final):**
* **Confirmation:** The agent's traced path (blue line) ends at `<point>83 410</point>`, coinciding with the blue 'X'.
* **Final Path Output:** A sequence of 7 waypoints:
`<point>165 83</point><point>246 83</point><point>246 246</point><point>165 246</point><point>165 328</point><point>83 328</point><point>83 410</point>`
* **Visualization:** Third embedded `<image>` shows the complete, successful path from start to goal.
#### Key Observations
* The maze contains deliberate dead ends (e.g., the initial downward path).
* The solution path is not the shortest geometric line but the only viable route through the maze's corridors.
* The agent uses visualization (generating path images) as a tool to analyze its progress and options.
#### Interpretation
This section demonstrates an AI agent's capability in **sequential spatial reasoning and pathfinding**. The agent doesn't just compute a path; it verbalizes its decision-making process, evaluates alternatives, and uses self-generated visualizations to verify its state. The final output is a precise, coordinate-based path, suitable for robotic navigation or simulation. The process mirrors human-like problem-solving: exploration, dead-end recognition, backtracking logic, and goal confirmation.
---
### **Right Column: Sokoban Task**
#### Components/Axes
* **Title:** "Sokoban"
* **Question Text:** "This is a Sokoban task. A player is in a small room with walls, an empty floor, one box, and one goal with green marks. Your objective is to guide the player to push the box onto the goal position. The player can move 'up', 'down', 'left', or 'right' and can only push the box, not pull it. The player cannot walk through walls or the box. Present your final movement sequence inside \boxed{}."
* **Visual Elements:**
* A 6x6 grid (coordinates 0-5 on both axes).
* **Walls:** Orange brick-textured tiles.
* **Floor:** Lighter, dotted tiles.
* **Player:** A character icon.
* **Box:** A brown crate icon.
* **Goal:** A green 'X' mark.
* **Initial State Image:** Shows Player at (3,1), Box at (1,2), Goal at (1,4).
* **Intermediate State Image:** Shows Player at (1,1), Box at (1,2), Goal at (1,4). A blue arrow indicates the planned push direction.
* **Final State Image:** Shows Box at (1,4) on top of the Goal, Player at (1,3).
* **Response Text:** A logical, step-by-step analysis of positions and movement planning.
#### Detailed Analysis
**Initial Analysis:**
* **Player Start:** (3,1)
* **Box Position:** (1,2)
* **Goal Position:** (1,4)
* **Strategy:** To push the box right onto the goal, the player must first get to the box's left side at (1,1).
**Step 1:**
* **Movement:** Player moves from (3,1) to (2,1) to (1,1). This is described as "move up twice".
* **Result:** Player is now at (1,1), directly left of the box at (1,2).
* **Visualization:** First embedded `<image>` shows this new state with a blue arrow pointing from the box toward the goal.
**Step 2:**
* **Action:** Push the box right twice.
* **First Push:** Player moves from (1,1) to (1,2), pushing box to (1,3).
* **Second Push:** Player moves from (1,2) to (1,3), pushing box to (1,4).
* **Result:** Box is now on the goal at (1,4). Player is at (1,3).
* **Visualization:** Second embedded `<image>` shows the final solved state.
**Final Solution:**
* **Movement Sequence:** `up, up, right, right`
* **Formatted Output:** `\boxed{up, up, right, right}`
#### Key Observations
* The solution requires **indirect manipulation**: the player must first navigate to a specific position relative to the box before any pushing can occur.
* The agent correctly identifies the core constraint: it can only push, not pull.
* The solution is optimal in terms of move count for this specific configuration.
#### Interpretation
This section showcases **planning under constraints**. The agent must model the game's physics (push-only, no walking through objects) and perform multi-step reasoning. It breaks the problem into subgoals: 1) Achieve the correct pushing position, 2) Execute the pushes. The use of grid coordinates and state visualization is crucial for accurate planning. This demonstrates capabilities relevant to robotics, game AI, and automated planning systems where an agent must manipulate objects in a structured environment.
---
### **Overall Interpretation & Synthesis**
The document serves as a **comparative showcase of an AI's visual-spatial reasoning abilities** across two classic problem domains.
* **Maze (Navigation):** Tests pathfinding, dead-end recognition, and sequential decision-making in a static, obstacle-filled environment. The output is a continuous path.
* **Sokoban (Manipulation):** Tests planning, understanding of object interactions, and constraint satisfaction in a dynamic environment where the agent's actions change the state of the world. The output is a discrete action sequence.
**Common Themes:**
1. **Visual Grounding:** Both tasks require the agent to interpret a visual scene (maze layout, grid state) and translate it into symbolic coordinates and relationships.
2. **Step-by-Step Reasoning:** The responses are not just answers but detailed explanations of the reasoning process, highlighting intermediate states and decisions.
3. **Self-Verification:** The agent uses generated images (Maze) or references to updated visual states (Sokoban) to confirm its progress and the correctness of its plan.
4. **Structured Output:** Both require a specific, machine-readable final format (waypoint list, command sequence).
**Notable Anomaly:** The Maze solution path includes a segment (`<point>246 246</point>` to `<point>165 246</point>`) that appears to backtrack leftward. This is not an error but a necessary maneuver to navigate around an internal wall to reach the correct vertical corridor leading to the goal, demonstrating sophisticated spatial awareness beyond simple greedy algorithms.
In summary, this technical document illustrates a multimodal AI system capable of perceiving visual scenes, reasoning about spatial relationships and constraints, planning action sequences, and communicating its process in a clear, structured, and verifiable manner.
</details>
Figure 12: Examples of chain-of-thought SFT data for the maze and sokoban task.
<details>
<summary>x15.png Details</summary>
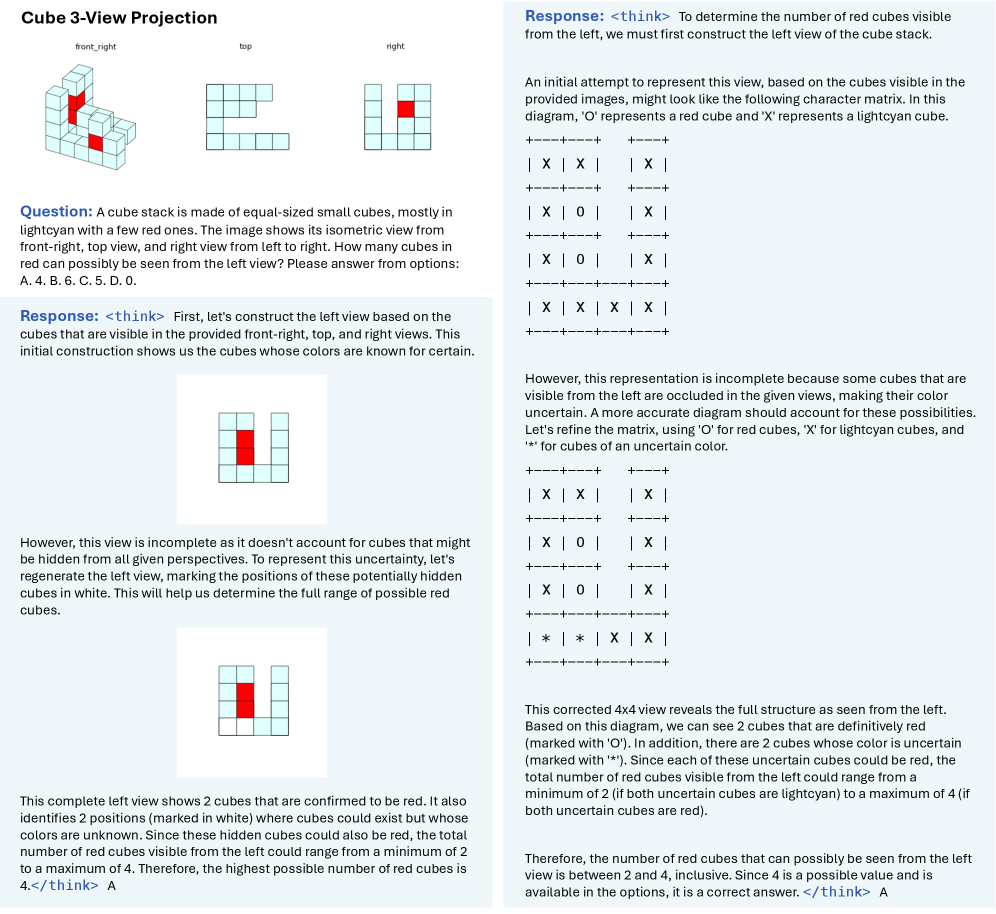
### Visual Description
## Diagram: Cube 3-View Projection and Problem-Solving Response
### Overview
The image is a composite technical document presenting a spatial reasoning problem about a stack of cubes and a detailed, step-by-step solution. The left column shows the original problem with three isometric views of a cube stack and a multiple-choice question. The right column contains a lengthy, reasoned response that constructs a "left view" of the stack to determine the possible number of red cubes visible from that perspective. The document uses text, 3D diagrams, and ASCII art matrices to convey its information.
### Components/Axes
The image is divided into two primary vertical columns.
**Left Column (Problem Statement):**
1. **Title:** "Cube 3-View Projection"
2. **Diagrams:** Three isometric projections of a cube stack, labeled:
* `front_right`
* `top`
* `right`
These diagrams show a structure made of light cyan cubes with a few red cubes embedded within.
3. **Question Text:** A paragraph describing the problem and presenting four multiple-choice options (A. 4, B. 6, C. 5, D. 0).
4. **Initial Response Fragment:** The beginning of a response, marked with `<think>`, which starts to construct a "left view" based on the given diagrams. It includes a small, simplified 2D grid diagram showing a partial left view with one red cube.
**Right Column (Detailed Response):**
1. **Response Header:** "Response: <think>"
2. **Reasoning Text:** A continuous block of explanatory text detailing the logical process.
3. **ASCII Art Diagrams:** Three distinct ASCII art matrices (using `+`, `-`, `|`, `X`, `O`, `*`) representing different stages of constructing the "left view":
* **First Matrix:** A 4x4 grid labeled as an initial attempt, using 'X' for lightcyan and 'O' for red.
* **Second Matrix:** A refined 4x4 grid introducing '*' for cubes of uncertain color.
* **Third Matrix:** A final, corrected 4x4 grid showing the full structure.
4. **Conclusion Text:** The final reasoning leading to the answer, stating the number of red cubes visible from the left is between 2 and 4, inclusive, and that 4 is a correct option.
### Detailed Analysis
**Problem Statement (Left Column):**
* **Object:** A stack of equal-sized small cubes, mostly lightcyan with a few red ones.
* **Given Views:** `front_right`, `top`, and `right` isometric projections.
* **Task:** Determine how many red cubes can possibly be seen from the *left* view.
* **Options Provided:** A. 4, B. 6, C. 5, D. 0.
**Solution Process (Right Column & Lower Left):**
The response constructs the unknown "left view" through iterative reasoning:
1. **Initial Construction:** Based on cubes visible in the three given views, an initial 4x4 grid is proposed. In this grid:
* `X` = Lightcyan cube (certain)
* `O` = Red cube (certain)
* The grid shows two definite red cubes (`O`) at positions (row 2, column 2) and (row 3, column 2) in a 1-indexed grid from the top-left.
2. **Accounting for Uncertainty:** The initial view is deemed incomplete because some cubes visible from the left are occluded in the given views. A refined matrix is created:
* `X` = Lightcyan cube (certain)
* `O` = Red cube (certain)
* `*` = Cube of uncertain color (could be red or lightcyan)
* This matrix adds two uncertain cubes (`*`) at the bottom-left positions (row 4, columns 1 and 2).
3. **Final Corrected View:** The final 4x4 ASCII diagram represents the full structure as seen from the left. It confirms:
* **2 Definite Red Cubes:** Marked with 'O'.
* **2 Uncertain Cubes:** Marked with '*'. Their color is unknown from the given views.
* **Logic:** Since each uncertain cube could be red, the total number of red cubes visible from the left ranges from a minimum of 2 (if both `*` are lightcyan) to a maximum of 4 (if both `*` are red).
### Key Observations
1. **Spatial Reasoning Core:** The problem hinges on mentally constructing a 2D projection (the left view) from three other 2D projections, a classic exercise in spatial visualization.
2. **Use of Uncertainty Notation:** The solution explicitly introduces a symbol (`*`) to represent logical uncertainty, which is a key methodological step.
3. **Answer Derivation:** The final answer is not a single number but a *range* (2 to 4). The multiple-choice question is then answered by selecting the highest possible value within that range that is offered as an option (4).
4. **Visual Layout of Logic:** The ASCII matrices serve as crucial visual aids that ground the textual reasoning, making the abstract spatial relationships concrete and verifiable.
### Interpretation
This document demonstrates a rigorous, transparent problem-solving methodology for a spatial reasoning puzzle. It doesn't just state an answer; it reveals the entire cognitive process.
* **What it demonstrates:** The data (the cube configurations) suggests that the exact composition of the 3D structure is underdetermined by the three given views. The solution elegantly maps this physical uncertainty into a logical framework using symbolic notation (`*`).
* **Relationship between elements:** The three given views (`front_right`, `top`, `right`) are the input data. The constructed "left view" is the analytical output. The ASCII diagrams are the intermediate working models that bridge the two. The final numerical range is the conclusion derived from analyzing the model.
* **Notable pattern:** The solution follows a clear pattern of **Hypothesis (initial grid) -> Identification of Limitation (occlusion) -> Refined Model (adding uncertainty) -> Logical Deduction (range calculation)**. This is a robust investigative approach applicable to many technical fields.
* **Underlying principle:** The problem highlights a fundamental concept in technical drawing and visualization: a set of orthographic projections may not uniquely define a 3D object unless all hidden lines are shown. The solution quantifies the resulting ambiguity.
</details>
Figure 13: Examples of chain-of-thought SFT data for the cube 3-view projection task, under visual world modeling (left) and verbal world modeling (right).
<details>
<summary>x16.png Details</summary>
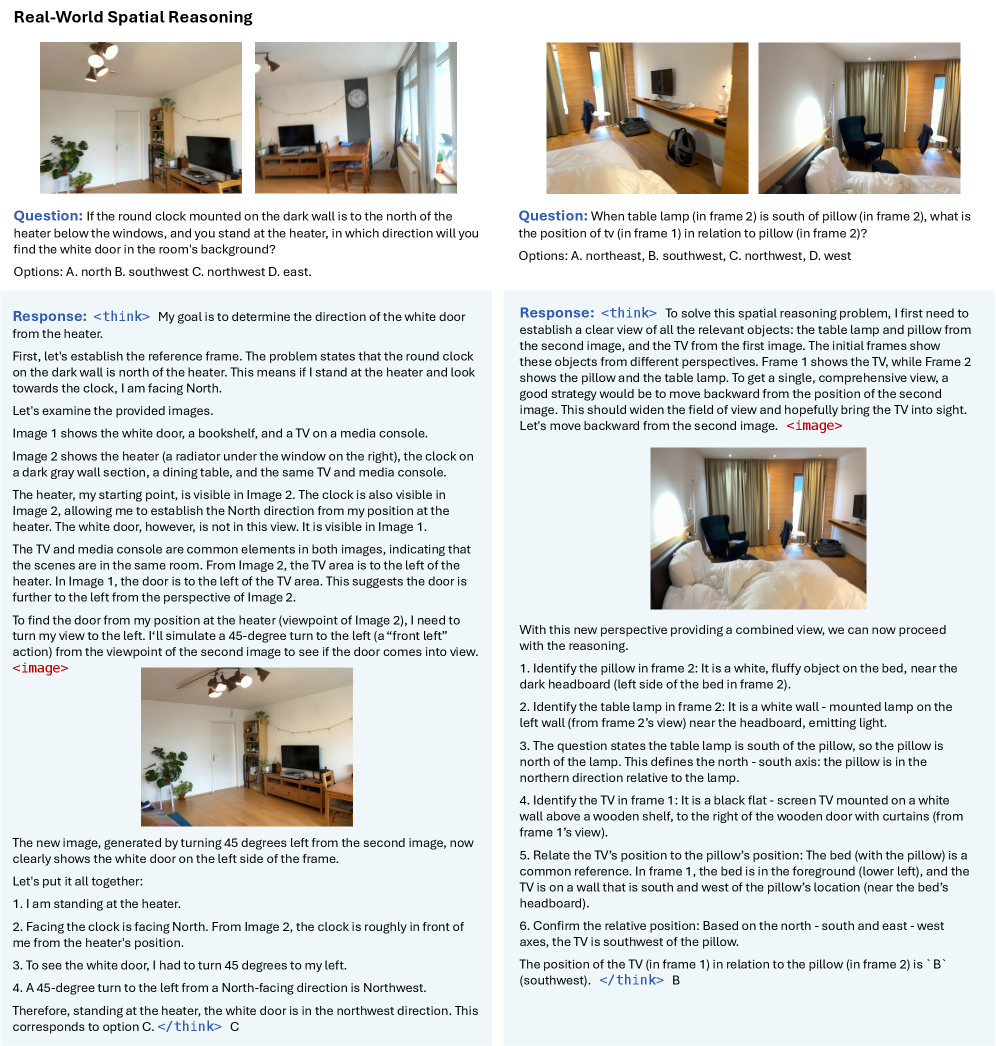
### Visual Description
## Diagram: Real-World Spatial Reasoning Problems
### Overview
The image is a composite document presenting two distinct spatial reasoning problems. Each problem includes a question, multiple-choice options, and a detailed, step-by-step "think-aloud" response that solves the problem by analyzing provided photographs. The document is structured in two columns, with the left column dedicated to the first problem and the right column to the second.
### Components/Axes
The document is divided into two primary sections:
**Left Column (Problem 1):**
* **Title:** "Real-World Spatial Reasoning" (Top-left, main heading).
* **Images:** Two photographs are referenced.
* Image 1: Shows a white door, a bookshelf, and a TV on a media console.
* Image 2: Shows a heater (radiator under a window), a round clock on a dark gray wall, a dining table, and the same TV/media console.
* **Question Text:** "Question: If the round clock mounted on the dark wall is to the north of the heater below the windows, and you stand at the heater, in which direction will you find the white door in the room's background?"
* **Options:** "Options: A. north B. southwest C. northwest D. east."
* **Response Section:** Labeled "Response:" and contains a detailed reasoning process enclosed in `` tags. It includes an embedded image placeholder `<image>`.
**Right Column (Problem 2):**
* **Images:** Three photographs are referenced.
* Frame 1: Shows a TV mounted on a white wall above a wooden shelf, to the right of a wooden door with curtains.
* Frame 2: Shows a bed with a white, fluffy pillow on the left side near a dark headboard, and a white wall-mounted lamp on the left wall near the headboard.
* Combined View Image: A third, wider-angle photograph generated to show both the bed/pillow area and the TV wall in a single perspective.
* **Question Text:** "Question: When table lamp (in frame 2) is south of pillow (in frame 2), what is the position of tv (in frame 1) in relation to pillow (in frame 2)?"
* **Options:** "Options: A. northeast, B. southwest, C. northwest, D. west"
* **Response Section:** Labeled "Response:" and contains a detailed reasoning process enclosed in `` tags. It includes an embedded image placeholder `<image>`.
### Detailed Analysis
**Problem 1 (Left Column) - Reasoning Transcript:**
The response establishes a reference frame: the clock is north of the heater. Standing at the heater and facing the clock means facing North.
* **Image Analysis:** Image 2 shows the heater and clock, establishing the North direction. The TV is to the left of the heater in this view. Image 1 shows the white door is to the left of the TV area.
* **Spatial Deduction:** From the heater's perspective (Image 2), the door is further left than the TV. To see the door, a 45-degree left turn from the North-facing position is simulated.
* **Conclusion:** A 45-degree left turn from North is Northwest. Therefore, the white door is in the northwest direction.
* **Final Answer:** "This corresponds to option C."
**Problem 2 (Right Column) - Reasoning Transcript:**
The response aims to create a unified spatial model from two different camera perspectives.
* **Object Identification:**
1. Pillow (Frame 2): White, fluffy object on the bed near the dark headboard (left side of bed in frame 2's view).
2. Table Lamp (Frame 2): White wall-mounted lamp on the left wall near the headboard.
3. TV (Frame 1): Black flat-screen TV on a white wall above a wooden shelf, to the right of a wooden door with curtains.
* **Establishing Axes:** The problem states the lamp is south of the pillow. This defines a north-south axis: the pillow is north relative to the lamp.
* **Spatial Integration:** A combined view image is generated to see both objects. In this new perspective, the bed (with pillow) is in the foreground (lower left), and the TV is on a wall that is south and west of the pillow's location.
* **Conclusion:** Based on the established north-south and east-west axes, the TV is southwest of the pillow.
* **Final Answer:** "The position of the tv (in frame 1) in relation to the pillow (in frame 2) is `B` (southwest)."
### Key Observations
1. **Methodology:** Both problems employ a consistent, analytical methodology: establish a reference frame/direction from given information, identify common landmarks across images, mentally simulate movement or perspective shifts, and deduce relative positions.
2. **Visual Aids:** The solutions rely heavily on visual cross-referencing between photographs. The second problem explicitly generates a new, synthesized image to resolve the spatial ambiguity between two separate frames.
3. **Language:** The entire document is in English. The reasoning is technical and procedural, using precise spatial language (north, south, left, turn 45 degrees).
4. **Structure:** The layout is clean and pedagogical, presenting the problem, the tools (images), and a model solution that exposes the cognitive process.
### Interpretation
This document serves as an educational or demonstrative piece on solving complex spatial reasoning tasks using real-world visual data. It doesn't present empirical data or trends but rather illustrates a **problem-solving algorithm**.
* **What it Demonstrates:** The core principle is that spatial relationships can be deduced by constructing a mental or descriptive 3D model from multiple 2D viewpoints. Key steps include: 1) Anchoring to a given directional fact (e.g., "clock is north of heater," "lamp is south of pillow"), 2) Identifying shared reference objects between views (the TV in Problem 1, the bed/pillow in Problem 2), and 3) Performing mental transformations (rotation, perspective shift) to integrate the information.
* **Underlying Logic:** The solutions highlight the importance of **frame of reference**. All directions are relative to a chosen point and orientation. The problems test the ability to maintain and manipulate this frame during perspective changes.
* **Notable Technique:** The use of a generated "combined view" image in Problem 2 is a significant strategy. It shows that when direct visual correlation is difficult, creating an intermediate, integrated representation can simplify the reasoning process. This mimics a cognitive strategy of "zooming out" or finding a vantage point that reveals all relevant relationships at once.
* **Purpose:** The document likely aims to teach or benchmark AI systems (or humans) on embodied spatial reasoning—the ability to understand and navigate environments based on visual and descriptive cues, a fundamental aspect of intelligence for navigation and interaction.
</details>
Figure 14: Examples of chain-of-thought SFT data for the real-world spatial reasoning task.
The Qwen-VL baselines are trained using LLaMA-Factory https://github.com/hiyouga/LLaMA-Factory for supervised fine-tuning (SFT) and verl for reinforcement learning from verifiable rewards (RLVR).
### 8.3 Analytic Experiments
Sample efficiency. For Figure 6, we randomly subsample either 500 or 1000 training examples. The resulting models are evaluated under two settings: (i) a hard setting with the maximum difficulty (grid size 8 and 4 folding steps, default in VisWorld-Eval), and (ii) an in-distribution setting (denoted as Normal in the figure) with randomly sampled grid sizes (3–8) and folding steps (1–4).
Task difficulties and world model fidelity. For Figure 6, we generate test samples with varying cube-stack sizes (3–6), where size 6 is out-of-distribution relative to the training data. To assess world-model fidelity, we compare the generated views with the ground-truth views: for verbal world modeling, we use string pattern matching; for visual world modeling, we use Gemini 3 Pro to compare images. Since accurately inferring colors becomes particularly challenging at larger stack sizes, we evaluate only the shapes of the views and ignore color information. We also find that overall accuracy can be bottlenecked by verbal subskills (e.g., counting holes) after SFT, thus we report the accuracy of RL-trained models in Figure 6. In contrast, RL can distract verbal world modeling capabilities, leading to invalid formats of generated symbolic matrices, thus we report world-model fidelity of SFT-trained models.
Implicit world modeling. For Figure 6, we supervised fine-tune (SFT) BAGEL on CoTs with implicit world modeling, in which all explicit point coordinates are replaced by the placeholder token sequence <point>masked<point>. After training, we extract the hidden representations at the position of the token masked from each transformer layer. We then split the extracted representations from different CoTs into training and validation sets with an 8:2 ratio and train a two-layer MLP (hidden size 4096) to predict the ground-truth point coordinates. Since all samples are $5\times 5$ mazes, we formulate coordinate prediction as two 5-way classification tasks (for $x$ and $y$ , respectively). We compute classification accuracy for each coordinate and report the average of the two.
## 9 Extended Experimental Results
### 9.1 Full Results on MMSI-Bench
We report all scores on positional relationship tasks of MMSI-Bench in Table 5.
Table 5: Full results of SFT-trained UMMs on MMSI-Bench positional relationship tasks.
| | MMSI-Bench (Positional Relationship) | | | | | | |
| --- | --- | --- | --- | --- | --- | --- | --- |
| Models | Cam.-Cam. | Obj.–Obj. | Reg.–Reg. | Cam.–Obj. | Obj.–Reg. | Cam.–Reg. | Overall |
| Implicit WM | 33.1 | 31.2 | 31.8 | 46.5 | 29.1 | 37.3 | 34.8 |
| Visual WM | 29.6 | 29.5 | 31.6 | 60.9 | 25.8 | 54.4 | 38.4 |
### 9.2 Additional Qualitative Evaluation
We provide additional qualitative evaluation of trained UMMs’ reasoning, particularly failure cases.
Real-world spatial reasoning. As shown in Figure 15 a, reasoning with implicit world modeling is prone to hallucinations. In contrast, visual generation (Figure 15 b) yields more faithful world models, but still suffers from insufficient quality, including blurring and corrupted details. Moreover, we find that current VLMs and UMMs continue to exhibit limited understanding of positions and directions across different viewpoints. We expect that stronger base models and better-curated post-training data will enable more effective use of visual world models for spatial reasoning in future work.
Paper folding. As illustrated in Figure 16, verbal reasoning about geometric symmetry is prone to hallucinations, leading to inaccurate verbal world modeling. In contrast, visual world models, benefiting from stronger prior knowledge, generate correct intermediate unfolding steps even in the presence of erroneous verbal reasoning.
Cube 3-view projection. As shown in Figure 17, visual world models are able to approximately generate novel views of cube stacks even in the challenging out-of-distribution setting with an unseen stack size of 6, indicating strong prior knowledge of spatial transformations. Nevertheless, overall task performance remains limited by subtle shape-generation errors (Figure 17 b,d) and inaccurate color inference (Figure 17 c). We expect these issues to be alleviated through improved post-training and stronger base models.
<details>
<summary>x17.png Details</summary>
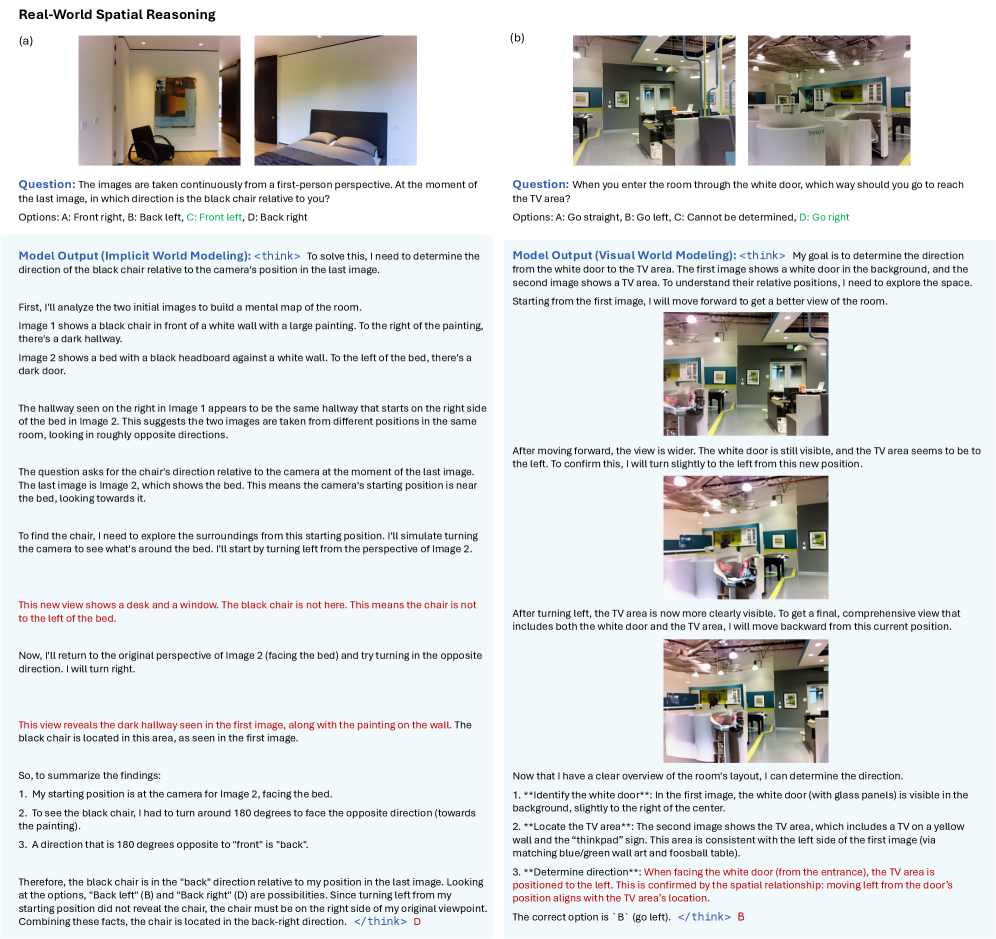
### Visual Description
## Diagram: Real-World Spatial Reasoning Problem Set
### Overview
The image displays two distinct spatial reasoning problems, labeled (a) and (b), presented side-by-side. Each problem consists of a question, multiple-choice options, and a detailed "Model Output" showing a step-by-step reasoning process to arrive at the correct answer. The content appears to be from a technical paper or report evaluating an AI model's ability to perform spatial reasoning from visual inputs.
### Components/Axes
The image is divided into two primary vertical columns:
**Column (a) - Left Side:**
* **Header:** "Real-World Spatial Reasoning" (top-left of entire image).
* **Sub-header:** "(a)".
* **Image Sequence:** Two photographs placed side-by-side.
* **Left Photo:** Shows a room interior with a black chair in the foreground, a large abstract painting on a white wall, and a dark hallway to the right.
* **Right Photo:** Shows a bedroom with a bed (black headboard) against a white wall. A dark doorway is visible to the left of the bed.
* **Question Text:** "Question: The images are taken continuously from a first-person perspective. At the moment of the last image, in which direction is the black chair relative to you?"
* **Options:** "Options: A: Front right, B: Back left, C: Front left, D: Back right".
* **Model Output Section:** Titled "Model Output (Implicit World Modeling):". Contains a `D` (indicating option D: Back right).
**Problem (b) Analysis:**
* **Task:** Determine the direction to go from the entrance (white door) to reach the TV area.
* **Model's Reasoning Process (Transcribed):**
1. The model's goal is to determine the direction from the white door to the TV area using the provided images.
2. It starts by analyzing the first image, noting the white door in the background and a TV area to the left.
3. It simulates moving forward to get a better view (corresponding to the second image). From this new position, the TV area is more clearly to the left.
4. To confirm, it simulates turning slightly left from this new position (corresponding to the third image). The TV area is now clearly visible.
5. **Spatial Relationship Summary:**
* **Identify the white door:** In the first image, the white door (with glass panels) is visible in the background, slightly to the right of the center.
* **Locate the TV area:** The second image shows the TV area, which includes a TV on a yellow wall and the "thinkpad" sign. This area is consistent with the left side of the first image (via matching blue/green wall art and foosball table).
* **Determine direction:** When facing the white door (from the entrance), the TV area is positioned to the left. This is confirmed by the spatial relationship: moving left from the door's position aligns with the TV area's location.
* **Model's Answer:** `<think> B` (indicating option B: Go left).
### Key Observations
1. **Two Modeling Approaches:** The problems explicitly label two different reasoning approaches: "Implicit World Modeling" for (a) and "Visual World Modeling" for (b). Problem (a) requires building a mental map from two static images, while (b) uses a sequence of images that simulate movement through a space.
2. **Reasoning Transparency:** The model's internal reasoning (`<think>` block) is fully exposed, showing a logical, step-by-step process of spatial deduction, hypothesis testing, and confirmation.
3. **Image as Evidence:** In both problems, the provided photographs are not just illustrations but are the primary data sources for the reasoning task. The model references specific visual elements (chair, painting, hallway, door, TV, sign) from the images to build its argument.
4. **Consistent Structure:** Both problems follow an identical layout: Question -> Options -> Model Output with embedded thinking process -> Final Answer tag.
5. **Correct Answers:** The model correctly solves both spatial puzzles, arriving at "D: Back right" for (a) and "B: Go left" for (b).
### Interpretation
This image demonstrates a framework for evaluating and explaining an AI's spatial reasoning capabilities. The core insight is that the model is not just pattern-matching answers but is engaging in a form of **simulated embodied cognition**.
* **What the data suggests:** The model performs "mental simulations" of movement and rotation within a represented 3D space. For (a), it mentally rotates its viewpoint 180 degrees. For (b), it mentally translates and rotates its viewpoint forward and then left. This suggests an internal capability for maintaining object permanence and spatial relationships across different viewpoints.
* **How elements relate:** The questions test different aspects of spatial intelligence. Problem (a) tests **allocentric spatial reasoning** (understanding the layout of a room from disconnected views) and **perspective-taking** (determining "left/right/front/back" from a specific ego-centric position). Problem (b) tests **path integration** and **landmark-based navigation** (using the door as a start point and the TV as a goal).
* **Notable patterns:** The reasoning is methodical and self-correcting. The model explicitly states its assumptions (e.g., "the hallway... appears to be the same"), tests them (e.g., "I'll simulate turning left"), and uses negative evidence (e.g., "The black chair is not here") to refine its conclusion. This mirrors human problem-solving heuristics.
* **Why it matters:** This type of transparent, step-by-step reasoning is crucial for building trustworthy and debuggable AI systems. It moves beyond treating the model as a black box and instead provides a window into its "thought process," allowing researchers to verify that the correct answer is derived from sound logic rather than statistical coincidence. The successful solutions indicate a promising level of grounded spatial understanding.
</details>
Figure 15: Showcases of reasoning generateed by post-trained UMMs in the real-world spatial reasoning task. We highlight hallucinations or incorrect reasoning steps in red.
<details>
<summary>x18.png Details</summary>
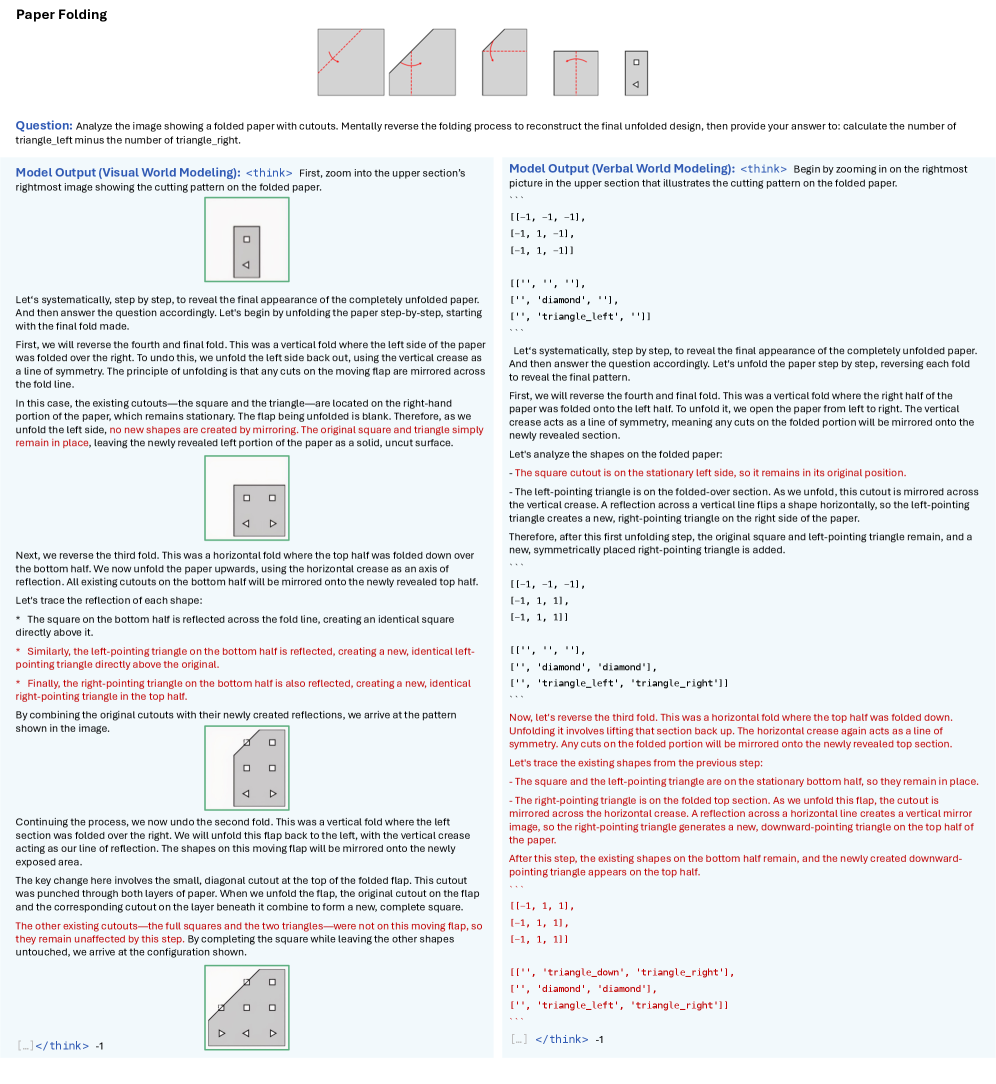
### Visual Description
## Paper Folding Problem with Cutouts: Technical Document Extraction
### Overview
The image presents a spatial reasoning problem titled "Paper Folding." It displays a sequence of diagrams illustrating a piece of paper being folded and cut, followed by a question asking the viewer to mentally reverse the process to determine the final unfolded pattern. The image includes two detailed model outputs ("Visual World Modeling" and "Verbal World Modeling") that provide step-by-step reasoning to solve the problem.
### Components/Axes
The image is structured into three main sections:
1. **Header & Problem Statement:** Contains the title "Paper Folding," a sequence of five diagrams showing the folding and cutting process, and the core question.
2. **Left Column - Model Output (Visual World Modeling):** A detailed, step-by-step visual and textual explanation of the unfolding process, accompanied by four intermediate diagrams showing the paper's state after each unfolding step.
3. **Right Column - Model Output (Verbal World Modeling):** A parallel, text-heavy explanation of the same unfolding process, using descriptive language and grid-based array representations to track the shapes.
**Key Textual Elements:**
* **Title:** "Paper Folding"
* **Question:** "Analyze the image showing a folded paper with cutouts. Mentally reverse the folding process to reconstruct the final unfolded design, then provide your answer to: calculate the number of triangle_left minus the number of triangle_right."
* **Model Output Headers:** "Model Output (Visual World Modeling):" and "Model Output (Verbal World Modeling):"
* **Thinking Tags:** Both models begin with `` tags, indicating an internal reasoning process.
* **Shape Labels:** The text consistently refers to specific cutout shapes: "square," "triangle_left," "triangle_right," "diamond," and "triangle_down."
### Detailed Analysis
#### **Problem Sequence (Top Diagrams):**
The process is shown in five steps from left to right:
1. A square piece of paper.
2. The paper is folded vertically from left to right.
3. The paper is folded horizontally from top to bottom.
4. The paper is folded vertically again from left to right.
5. **Final Folded State & Cutouts:** The final, small rectangular folded paper has three cutouts: a square in the top-left corner and two triangles below it. The left triangle points left (`triangle_left`), and the right triangle points right (`triangle_right`).
#### **Model Output (Visual World Modeling) - Left Column:**
This model describes the unfolding process in reverse order, from the last fold to the first. Each step includes a diagram.
* **Step 1 (Reverse 4th fold):** Unfolds the final vertical fold. The cutouts (square and `triangle_left`) are on the stationary right portion. Unfolding reveals a blank left portion. **Result:** Square and `triangle_left` remain on the right side.
* **Step 2 (Reverse 3rd fold):** Unfolds the horizontal fold upwards. Shapes on the bottom half are mirrored onto the top half. The square and `triangle_left` are reflected, creating duplicates directly above them. A `triangle_right` on the bottom is also reflected, creating a duplicate above it. **Result:** A 2x2 grid: top row has square and `triangle_left`; bottom row has square and `triangle_right`.
* **Step 3 (Reverse 2nd fold):** Unfolds a vertical fold to the left. A key change occurs: a small diagonal cutout at the top of the moving flap combines with its counterpart on the stationary layer to form a complete square. The other shapes (full squares and triangles) are unaffected. **Result:** A pattern with a square in the top-left, a `triangle_left` below it, a square in the top-right, and a `triangle_right` below it.
* **Step 4 (Reverse 1st fold):** The final step is described but the accompanying diagram is cut off in the provided image. The text states the process is completed to arrive at the final configuration.
#### **Model Output (Verbal World Modeling) - Right Column:**
This model uses a more abstract, grid-based notation to track shapes. It represents the paper as a 3x3 grid (though the final paper is 2x2) using arrays. `-1` likely represents an empty cell.
* **Initial State (Folded):** Shows a grid with a `diamond` and `triangle_left`.
* **After Step 1 (Reverse 4th fold):** The grid expands. The `triangle_left` is mirrored, creating a `triangle_right`. The array shows: `[['', 'diamond', ''], ['', 'triangle_left', 'triangle_right']]`.
* **After Step 2 (Reverse 3rd fold):** The `triangle_right` is mirrored vertically across the horizontal fold, creating a `triangle_down`. The array shows: `[['', 'triangle_down', 'triangle_right'], ['', 'diamond', ''], ['', 'triangle_left', 'triangle_right']]`.
* The model's reasoning text mirrors the visual model's logic, describing reflections and symmetry for each unfolding step.
### Key Observations
1. **Dual Representation:** The problem is solved using two complementary methods: one heavily visual with diagrams, and one verbal/abstract using grid arrays.
2. **Consistent Logic:** Both models follow the same core principle: each fold creates a line of symmetry. Unfolding mirrors any cutouts from the moving section onto the newly revealed stationary section.
3. **Shape Transformation:** A critical insight is that a diagonal cut through two layers of paper (during the second fold step) results in a complete square when unfolded, not a triangle.
4. **Final Pattern Inference:** Although the final, fully unfolded diagram is not shown, the step-by-step processes from both models lead to the same conclusion. The final pattern should contain multiple squares and both left- and right-pointing triangles. The question asks for the count of `triangle_left` minus `triangle_right`.
### Interpretation
This image is a technical demonstration of spatial reasoning and procedural problem-solving. It breaks down a complex mental task (reversing a series of folds and cuts) into a verifiable, step-by-step algorithm.
* **What it demonstrates:** The core principle is **symmetry across fold lines**. Every fold creates an axis of reflection. To unfold, one must apply this reflection in reverse, copying features from the folded section to the newly opened section.
* **Relationship between elements:** The diagrams and text are tightly coupled. The visual model provides intuitive, concrete checkpoints, while the verbal model offers a formal, replicable notation. They validate each other.
* **Notable Anomaly/Insight:** The most non-intuitive step is the creation of a square from a diagonal cut. This highlights that a single cut through multiple, misaligned layers can produce unexpected shapes upon unfolding, a key concept in origami and engineering (e.g., kirigami).
* **Purpose:** The problem tests and teaches the ability to mentally manipulate 2D objects in space, a skill crucial in fields like engineering, architecture, chemistry (molecular modeling), and graphic design. The inclusion of two model outputs suggests an analysis of different problem-solving strategies (visual-spatial vs. symbolic-logical).
</details>
Figure 16: Showcases of reasoning generated by post-trained UMMs in the paper folding task. We highlight hallucinations or incorrect reasoning steps in red, but also mark correctly generated visual unfolding intermediate steps with green borders.
<details>
<summary>x19.png Details</summary>
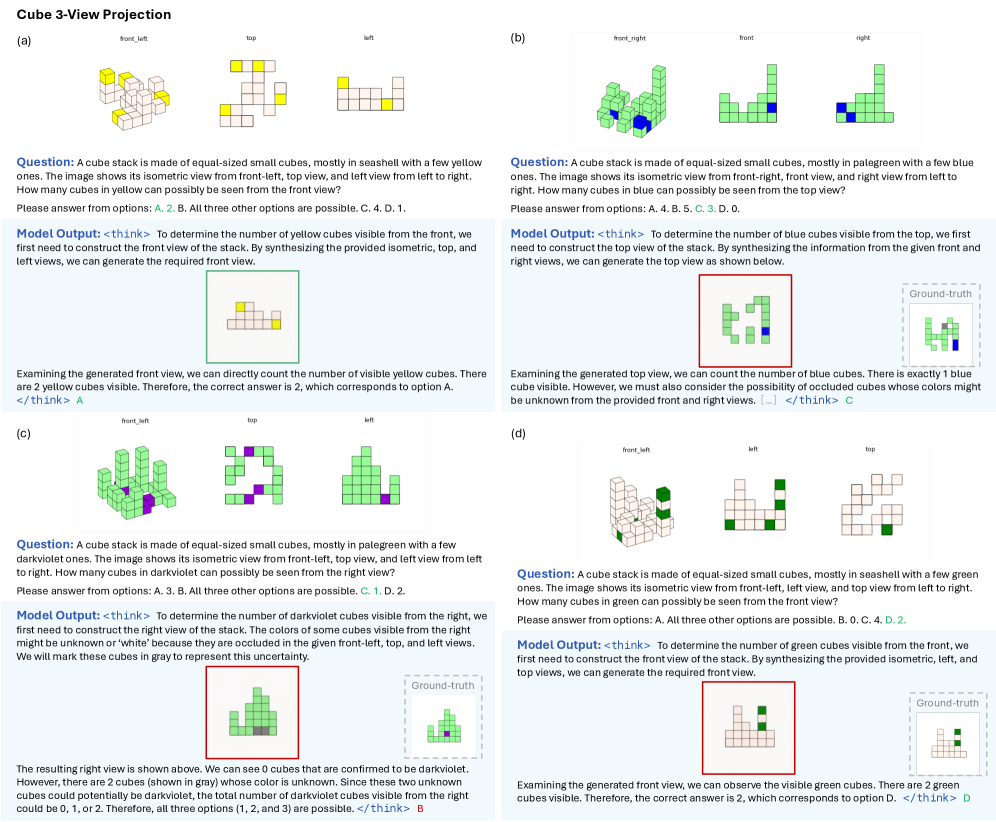
### Visual Description
## Cube 3-View Projection: Spatial Reasoning Problems
### Overview
The image presents four distinct spatial reasoning problems (labeled a, b, c, d) involving stacks of colored cubes. Each problem provides three 2D orthographic projections (views) of a 3D cube stack and asks a question about the count of a specific colored cube visible from a particular viewpoint. The image includes the problem statements, multiple-choice options, and a model's step-by-step reasoning ("Model Output") to arrive at an answer. The overall title is "Cube 3-View Projection."
### Components/Axes
The image is divided into four quadrants. Each quadrant contains:
1. **View Labels:** Three labeled isometric views of a cube stack (e.g., `front_left`, `top`, `left`).
2. **Question Text:** A paragraph describing the cube stack's composition and the specific counting question.
3. **Options:** A list of multiple-choice answers (A, B, C, D).
4. **Model Output:** A section showing the model's reasoning process, often including a generated 2D view diagram and a final answer selection.
5. **Ground-truth Diagram:** A small, faint diagram in some quadrants (b, c, d) labeled "Ground-truth," showing the correct view for comparison.
### Detailed Analysis
#### Quadrant (a)
* **Views:** `front_left`, `top`, `left`.
* **Question:** "A cube stack is made of equal-sized small cubes, mostly in seashell with a few yellow ones. The image shows its isometric view from front-left, top view, and left view from left to right. How many cubes in yellow can possibly be seen from the front view?"
* **Options:** A. 2. B. All three other options are possible. C. 4. D. 1.
* **Model Output & Reasoning:** The model synthesizes the three views to construct a front view. It generates a diagram of this front view, showing a 2D grid with yellow squares. It then counts the visible yellow cubes in this generated view: "There are 2 yellow cubes visible." It concludes the answer is 2, corresponding to option **A**.
* **Colors:** Primary stack color: `seashell` (off-white). Accent color: `yellow`.
#### Quadrant (b)
* **Views:** `front_right`, `front`, `right`.
* **Question:** "A cube stack is made of equal-sized small cubes, mostly in palegreen with a few blue ones. The image shows its isometric view from front-right, front view, and right view from left to right. How many cubes in blue can possibly be seen from the top view?"
* **Options:** A. 4. B. 5. C. 3. D. 0.
* **Model Output & Reasoning:** The model constructs a top view from the given views. It generates a diagram of this top view, showing a grid with one blue square. It states: "There is exactly 1 blue cube visible." However, it then considers "the possibility of occluded cubes whose colors might be unknown from the provided front and right views." This uncertainty leads it to select option **C** (3), implying that while one is confirmed, others could be hidden.
* **Colors:** Primary stack color: `palegreen`. Accent color: `blue`.
* **Spatial Grounding:** The generated top view diagram is placed in the center of the model output section. A faint "Ground-truth" diagram is visible to its right.
#### Quadrant (c)
* **Views:** `front_left`, `top`, `left`.
* **Question:** "A cube stack is made of equal-sized small cubes, mostly in palegreen with a few darkviolet ones. The image shows its isometric view from front-left, top view, and left view from left to right. How many cubes in darkviolet can possibly be seen from the right view?"
* **Options:** A. 3. B. All three other options are possible. C. 1. D. 2.
* **Model Output & Reasoning:** The model constructs the right view. It notes that colors of some cubes might be unknown (occluded) and will be marked in gray. It generates a right view diagram showing green and gray cubes, but no darkviolet. It states: "We can see 0 cubes that are confirmed to be darkviolet." However, it identifies 2 gray (unknown) cubes that "could potentially be darkviolet." Therefore, the total could be 0, 1, or 2, making all options possible. It selects option **B**.
* **Colors:** Primary stack color: `palegreen`. Accent color: `darkviolet`. Uncertainty color: `gray`.
* **Spatial Grounding:** The generated right view diagram is centered. The "Ground-truth" diagram is to its right.
#### Quadrant (d)
* **Views:** `front_left`, `left`, `top`.
* **Question:** "A cube stack is made of equal-sized small cubes, mostly in seashell with a few green ones. The image shows its isometric view from front-left, left view, and top view from left to right. How many cubes in green can possibly be seen from the front view?"
* **Options:** A. All three other options are possible. B. 0. C. 4. D. 2.
* **Model Output & Reasoning:** The model synthesizes the views to generate a front view. The generated diagram shows a grid with two green squares. It observes: "There are 2 green cubes visible." It concludes the answer is 2, corresponding to option **D**.
* **Colors:** Primary stack color: `seashell`. Accent color: `green`.
* **Spatial Grounding:** The generated front view diagram is centered. The "Ground-truth" diagram is to its right.
### Key Observations
1. **Problem Structure:** All four problems follow an identical template: provide three 2D views, ask for a count from a fourth, unseen perspective.
2. **Model Reasoning Pattern:** The model consistently attempts to reconstruct the requested 2D view by synthesizing the given views. Its answers depend on whether the reconstruction yields a definitive count or reveals ambiguity due to occlusion.
3. **Handling Uncertainty:** Problems (b) and (c) explicitly deal with uncertainty from occluded cubes. The model's reasoning highlights this, leading to answers that account for multiple possibilities (options B and C, respectively).
4. **Visual Confirmation:** The generated view diagrams in the model output serve as visual proof for its reasoning, allowing for direct verification of the counted cubes.
5. **Ground-Truth Comparison:** The presence of faint "Ground-truth" diagrams in (b), (c), and (d) suggests this image may be from a dataset or evaluation where the model's generated view is compared to the correct one.
### Interpretation
This image is a technical demonstration of a multimodal AI model's capability in **spatial reasoning and 3D reconstruction from 2D projections**. It showcases the model's ability to:
* **Parse and Integrate Multi-View Data:** Correctly interpret three separate orthographic projections of a single 3D object.
* **Perform Mental Rotation/Synthesis:** Combine the information to construct a mental (or in this case, a drawn) model of the object from a new angle.
* **Reason Under Uncertainty:** Identify when information is missing (occluded cubes) and articulate the range of possible answers rather than forcing a single, potentially incorrect, conclusion.
* **Explain Its Process:** Provide a step-by-step, interpretable rationale for its answer, which is crucial for trust and debugging in AI systems.
The problems themselves are classic spatial intelligence tests, often used in cognitive assessments and engineering graphics education. The model's outputs demonstrate a level of proficiency in this domain, successfully navigating both straightforward counts and more complex scenarios involving hidden elements. The variation in color schemes (seashell/yellow, palegreen/blue, etc.) tests the model's ability to track specific attributes across different visual contexts.
</details>
Figure 17: Showcases of reasoning generated by post-trained UMMs in the paper folding task. We mark correct and incorrect generated cube views with green and red borders, respectively. For incorrect generations, the corresponding ground-truth views are provided for reference (note that these are shown only for readers and are never provided to the models during reasoning).