# SWE-Bench Mobile: Can Large Language Model Agents Develop Industry-Level Mobile Applications?
> 1University of Toronto2Xiaohongshu Inc.3Coolwei AI Lab4University of Illinois Urbana-Champaign5University of California, Berkeley
Abstract.
Can large language model agents develop industry-level mobile applications? We introduce SWE-Bench Mobile, a benchmark for evaluating coding agents on realistic software engineering tasks derived from a production iOS codebase. Unlike existing benchmarks that focus on isolated problems or bug fixes, SWE-Bench Mobile captures the full complexity of industrial development: multi-modal inputs (PRDs and Figma designs), a large-scale mixed Swift/Objective-C codebase, and comprehensive test suites. We evaluate 22 agent-model configurations across four coding agents—three commercial (Cursor, Codex, Claude Code) and one open-source (OpenCode)—and find that even the best configurations achieve only 12% task success rate. Our analysis reveals that (1) agent design matters as much as model capability—the same model shows up to 6 $×$ performance gap across agents, (2) commercial agents consistently outperform open-source alternatives, and (3) simple “Defensive Programming” prompts outperform complex ones by 7.4%. These findings highlight a significant gap between current agent capabilities and industrial requirements, while providing actionable insights for practitioners and researchers. We release SWE-Bench Mobile as a hosted benchmark challenge to prevent data contamination and ensure fair evaluation. The public leaderboard and development toolkit are available at https://swebenchmobile.com.
Large Language Models, Software Engineering Agents, Mobile Development Benchmark copyright: none footnotetext: * Equal contribution. † Corresponding author: jiaxuan@illinois.edu.
1. Introduction
<details>
<summary>figures/fig_pipeline.png Details</summary>
### Visual Description
## Diagram: Software Evaluation Workflow
### Overview
The image is a diagram illustrating a software evaluation workflow, divided into three main stages: Input, Runtime, and Evaluation. It shows the flow of information and processes from initial requirements to final analysis.
### Components/Axes
* **Input:** This stage represents the initial data and resources required for the process.
* Elements:
* "Feature Description" (light blue box)
* "Figma Link" (light blue box with Figma logo)
* "Product Requirement Document" (light blue box)
* "Other Related Context (abtest/multi-lingo/etc)" (light blue box)
* "Mobile Project Codebase (Swift/Objc/RN/etc)" (light red box with a flame icon)
* **Runtime:** This stage represents the processing and execution phase.
* Elements:
* "Bench Runtime (Model Config/Tuned System Prompt/Task Management)" (light purple box)
* "Figma MCP" (light purple box)
* "Vision MCP" (light purple box)
* "Coding Agent (Cursor/CC/Codex/etc)" (light purple box with icons)
* **Evaluation:** This stage represents the analysis and assessment of the results.
* Elements:
* "Entrypoint-wise Eval" (light green box)
* "Functionality-wise Eval" (light green box)
* "Configuration-wise Eval" (light green box)
* "Analyzer" (light green box)
### Detailed Analysis or Content Details
* **Input Stage:**
* The "Feature Description," "Figma Link," "Product Requirement Document," and "Other Related Context" all feed into the "Product Requirement Document."
* The "Mobile Project Codebase" is a separate input.
* All inputs feed into the "Runtime" stage.
* **Runtime Stage:**
* The "Bench Runtime" block is the central component.
* "Figma MCP" and "Vision MCP" feed into the "Coding Agent."
* The "Coding Agent" receives input from the "Bench Runtime."
* The output of the "Coding Agent" is labeled "diff patches" and feeds into the "Evaluation" stage.
* **Evaluation Stage:**
* "Entrypoint-wise Eval," "Functionality-wise Eval," and "Configuration-wise Eval" all feed into the "Analyzer."
* The "Analyzer" is the final step in the workflow.
### Key Observations
* The diagram illustrates a sequential flow from Input to Runtime to Evaluation.
* The "Coding Agent" in the Runtime stage appears to be a key component, receiving input from multiple sources.
* The Evaluation stage involves multiple types of evaluation before the final analysis.
### Interpretation
The diagram outlines a process for automatically evaluating software changes. The "Input" stage gathers all necessary information, including feature descriptions, design links (Figma), requirements, and the codebase. The "Runtime" stage uses this information to generate code changes ("diff patches") via a "Coding Agent," potentially leveraging models and configurations defined in the "Bench Runtime." The "Evaluation" stage then assesses these changes from different perspectives (entry point, functionality, configuration) before a final "Analyzer" provides a comprehensive evaluation. This suggests an automated system for testing and validating software modifications.
</details>
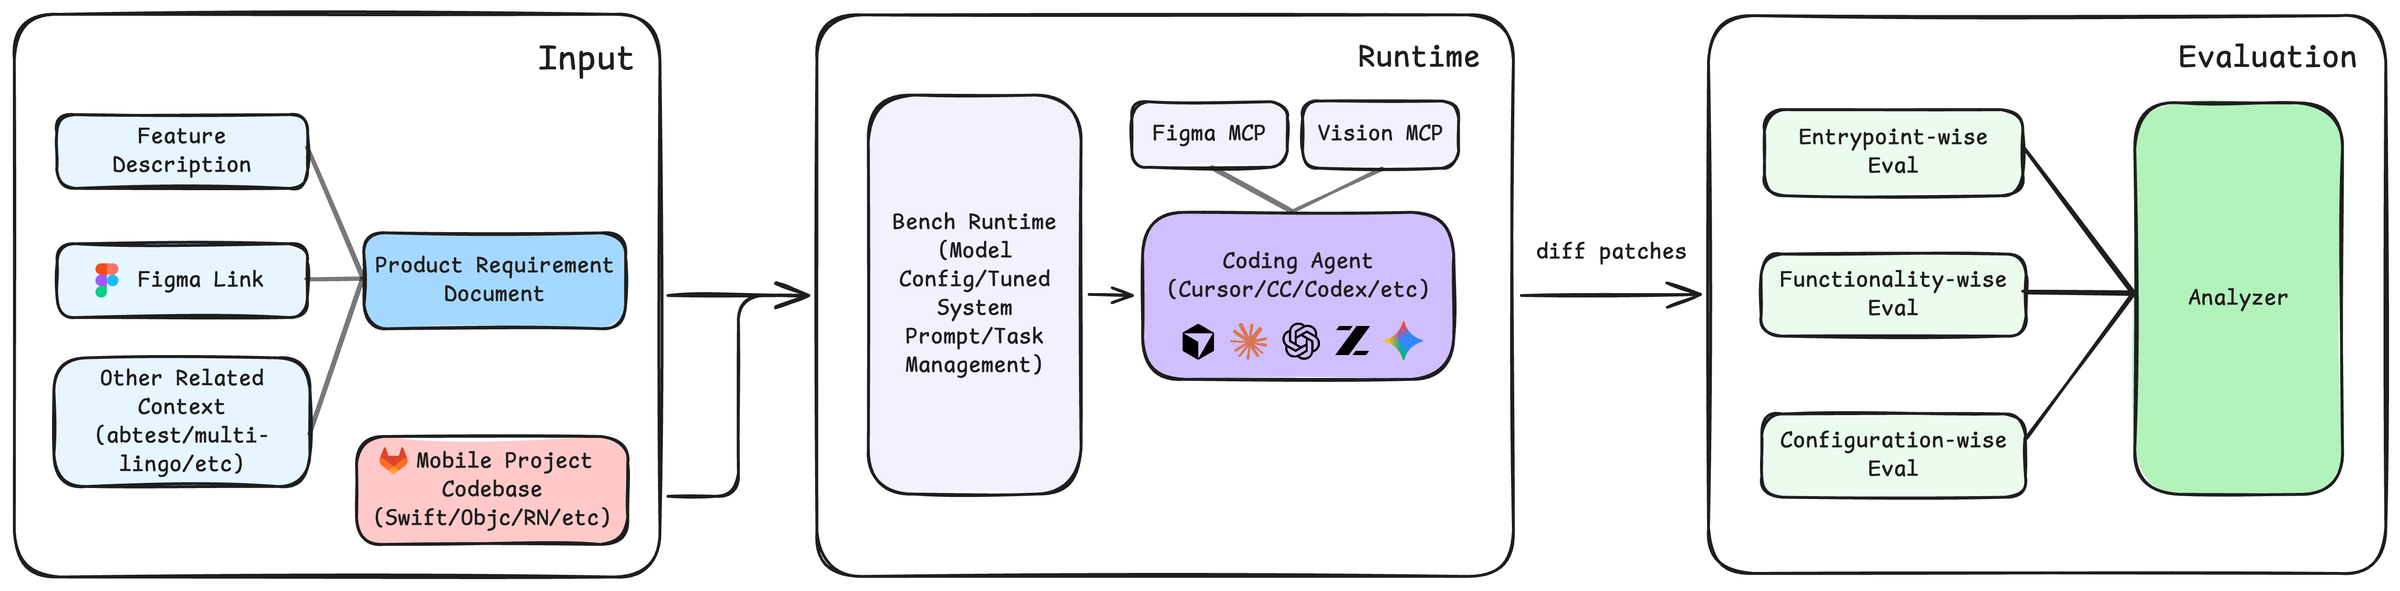
Figure 1. Overview of the SWE-Bench Mobile pipeline. (1) Agents receive multi-modal inputs including a Product Requirement Document (PRD), Figma design, and a large-scale Swift/Objective-C codebase. (2) The agent navigates the codebase, plans the implementation, and generates code. (3) The output is a Git patch that is applied and evaluated against a comprehensive test suite.
Large language models (LLMs) have enabled a new generation of autonomous coding agents that can understand requirements, navigate codebases, and implement features with minimal human intervention. Commercial systems like GitHub Copilot, Cursor, and Claude Code have achieved impressive results on existing benchmarks, raising a critical question: Can these agents handle the complexity of real-world, industry-level mobile software development?
Answering this question requires a comprehensive evaluation that faithfully captures professional software engineering. However, existing benchmarks have significant limitations. HumanEval (Chen et al., 2021) and MBPP (Austin et al., 2021) evaluate isolated algorithmic problems far removed from industrial practice. SWE-Bench (Jimenez et al., 2024) advances the field by using real GitHub issues, but still falls short of industrial realism: it focuses on bug fixes rather than feature development, uses text-only inputs without design specifications, typically involves small localized changes to 1-2 files, and concentrates on Python which is well-represented in training data. Recent work like SWE-Bench Pro (Deng et al., 2025) addresses some limitations by introducing longer-horizon tasks, but still lacks multi-modal inputs and focuses exclusively on Python.
In professional software development, engineers participate in a structured workflow that goes far beyond writing code. They interpret Product Requirement Documents (PRDs) that specify what to build and why. They translate visual designs from tools like Figma into implementation decisions about layout and interaction. They navigate large codebases—often hundreds of thousands of lines—to find relevant files and understand existing patterns. They make coordinated changes across multiple modules while maintaining consistency. And they ensure their implementations handle edge cases and pass comprehensive tests. A benchmark claiming to evaluate “industry-level” capabilities must test all of these aspects.
We focus on mobile application development not merely for language diversity, but because it represents a distinct and critical paradigm in software engineering that remains unexplored by current benchmarks. Unlike server-side logic (e.g., Python scripts), mobile development introduces unique challenges for AI agents: (1) Multi-modal Dependency: Implementation is strictly guided by visual designs (Figma) and user interactions, requiring agents to perform visually-grounded program synthesis rather than just text-to-code generation. (2) Event-Driven Complexity: Mobile apps are stateful systems that must handle asynchronous user events, network changes, and strict OS lifecycle callbacks, challenging agents’ ability to model dynamic system states. (3) Client-Side Constraints: Development occurs within framework-heavy environments (e.g., iOS SDK) with rapid iterations, testing generalization to domain-specific APIs.
We introduce SWE-Bench Mobile, a benchmark for evaluating coding agents on industry-level mobile application development. SWE-Bench Mobile is constructed from real development artifacts at a major technology company, comprising 50 authentic tasks derived from actual product requirements. Each task combines multi-modal inputs—PRDs, Figma designs, and a large-scale mixed Swift/Objective-C production codebase—with comprehensive evaluation through 449 human-verified test cases.
Contributions.
1. We introduce SWE-Bench Mobile, the first benchmark combining PRDs, Figma designs, and a large-scale codebase to capture the full complexity of industrial software development.
1. We evaluate 22 agent-model configurations across four coding agents (three commercial, one open-source), with detailed analysis of performance, cost, and robustness.
1. We systematically categorize agent failures, finding that 54% stem from missing feature flags—a production practice unfamiliar to agents—followed by missing data models (22%) and incomplete file coverage (11–15%).
1. We provide actionable insights: agent design matters as much as model capability (up to 6 $×$ performance gap for the same model), commercial agents outperform open-source ones, simple prompts outperform complex ones, and cost-effective configurations exist.
To strictly preserve the integrity of the evaluation and respect the proprietary nature of the production codebase, we adopt a hosted evaluation paradigm. Unlike static datasets that are prone to data contamination in future model training sets, our held-out private test set ensures that agents are evaluated on truly unseen industrial tasks. We provide a sanitized development kit and a public leaderboard to foster community progress.
Our evaluation reveals a significant gap between current capabilities and industrial requirements. The best configuration achieves only 12% task success rate, with most failures due to incomplete implementations. The same model (Opus 4.5) achieves 12% on Cursor but only 2% on OpenCode—a 6 $×$ gap—demonstrating that agent scaffolding matters as much as model capability. Commercial agents consistently outperform the open-source OpenCode, whose best result (8% with GLM 4.6) trails the best commercial result (12%) by 4 percentage points. Success drops from 18% for simple tasks requiring 1-2 files to just 2% for complex tasks requiring 7+ files, indicating agents struggle with cross-file reasoning. These findings suggest that while coding agents show promise for simple tasks, substantial improvements in requirement understanding, multi-modal reasoning, and codebase navigation are needed for reliable industry-level development.
2. SWE-Bench Mobile
SWE-Bench Mobile is a benchmark designed to evaluate coding agents on industry-level mobile application development. Unlike existing benchmarks that focus on isolated coding problems or bug fixes, SWE-Bench Mobile captures the full complexity of professional software engineering: multi-modal inputs, large codebases, and comprehensive testing. Figure 1 illustrates the overall benchmark pipeline.
2.1. Problem Formulation
Each benchmark instance is represented as a triplet:
$$
\mathcal{T}=(\mathcal{I},\mathcal{O},\mathcal{E}),
$$
where $\mathcal{I}$ is the input context, $\mathcal{O}$ is the expected output, and $\mathcal{E}$ is the evaluation configuration.
Input ( $\mathcal{I}$ ). The input context mimics a typical developer’s starting point for a new feature. It consists of three main components (see Figure 2). First, a Product Requirement Document (PRD) describes the feature goal, user story, acceptance criteria, and constraints. These PRDs are derived from actual product requirements at XiaoHongShu Inc., a major social media platform with over 300 million monthly active users, follow standard industrial conventions (Atlassian, 2024), and have an average length of 450 words, requiring agents to parse natural language specifications. Second, 70% of tasks include a Figma Design specification, containing component layout, typography, and visual details that the agent must translate into code. Finally, the agent is provided with the XiaoHongShu production codebase, a Git repository snapshot containing approximately 500,000 lines of Swift/Objective-C code across thousands of files. This large-scale context forces the agent to perform retrieval and navigation, rather than just code generation.
<details>
<summary>figures/fig_task_example.png Details</summary>
### Visual Description
## UI/Code Comparison: Mobile App Redesign
### Overview
The image presents a comparison of a mobile app's UI "Before" and "After" a redesign, alongside a Figma example showing design specifications and a code snippet illustrating the implementation of UI elements. The image is divided into four main sections: "Before" UI, "Figma example", "After" UI, and "Code diff example".
### Components/Axes
* **"Before" UI:** Shows a mobile app screen with a post featuring a living room image.
* **"After" UI:** Shows a redesigned mobile app screen with a post featuring a person with balloons.
* **"Figma example":** Displays a Figma interface with design specifications for UI elements, including layer properties, layout, typography, and colors.
* **"Code diff example":** Presents a code snippet (Swift) showing the implementation of UI elements, specifically related to the `FeedItemFooter` class.
### Detailed Analysis or ### Content Details
**1. "Before" UI:**
* Image: A living room interior.
* Text: "周末只想赖在家" (Chinese, translates to "Just want to stay at home on weekends").
* User: "七月奶奶" (Chinese, translates to "July Grandma").
* Timestamp: "两天前" (Chinese, translates to "Two days ago").
* Likes: 2009
**2. "After" UI:**
* Image: A person with blue balloons.
* Text: "做了一个蓝色的梦♥" (Chinese, translates to "Had a blue dream♥").
* User: "酒井小乔" (Chinese, a name).
* Timestamp: "4小时前" (Chinese, translates to "4 hours ago").
**3. "Figma example":**
* **Top Bar:** Displays "关注Tab" (Chinese, translates to "Follow Tab"), "关注" (Chinese, translates to "Follow"), "发现" (Chinese, translates to "Discover"), "上海" (Chinese, translates to "Shanghai"), and a search icon.
* **Layer Properties:**
* "Caption/C3" element with dimensions indicated as 10px (left margin) and 14px (right margin).
* Layout: Width Hug (41px), Height Hug (14px).
* Typography: Name Caption/C3, Font PingFang SC, Weight var(--c3-font-weight), Style Regular, Size var(--c3-font-size), Line height var(--c3-line-height), Letter spacing 0%.
* Colors: Text colors var(--placeholder).
**4. "Code diff example":**
* File: `FeedItemFooter.swift`
* Class: `FeedItemFooter: UIView`
* Function: `layoutSubviews()`
* Code Snippets:
* `if FeatureConfig.shared.enableTimeEmphasis { likeButton.isHidden = true }`
* `timeLabel.font = Theme.font(.caption)`
* `timeLabel.frame = CGRect(x: width - timeSize.width - Padding.standard, y: avatarView.center.y - timeSize.height / 2, width: timeSize.width + 5, height: timeSize.height)`
* `nicknameLabel.frame.size.width = timeLabel.frame.minX - nicknameLabel.frame.`
**5. Additional UI Elements (Figma):**
* Pages section with "25.07 笔记封面去除点赞" (Chinese, translates to "25.07 Note cover to remove likes").
* Ready for development section.
* Layers section with various UI elements listed in Chinese, including "关注tab" (Follow Tab), "Rectangle 11115319", "双列" (Double Column), "笔记" (Note), "卡片聚合-合集/直播" (Card Aggregation - Collection/Live Stream), "Frame 2053141301", "两个推荐理由" (Two Recommended Reasons), "无头像气泡" (No Avatar Bubble), "Component / Bar / Tab", "导航栏" (Navigation Bar).
* Bottom navigation bar with icons for "首页" (Home), "热门" (Hot), "+", "消息" (Messages), "我" (Me).
### Key Observations
* The redesign involves changes to the visual style of the app, including the type of content displayed in posts.
* The Figma example provides detailed specifications for UI elements, ensuring consistency and precision in the design.
* The code snippet demonstrates how UI elements are implemented programmatically, including layout and styling.
### Interpretation
The image illustrates the process of redesigning a mobile app's UI, from initial concept to implementation. The "Before" and "After" sections show the visual changes, while the Figma example provides the design specifications and the code snippet demonstrates the technical implementation. The redesign appears to focus on modernizing the app's look and feel, potentially improving user engagement. The use of Figma and code examples highlights the importance of collaboration between designers and developers in creating a cohesive and functional user experience. The Chinese text indicates the app is likely targeted at a Chinese-speaking audience.
</details>
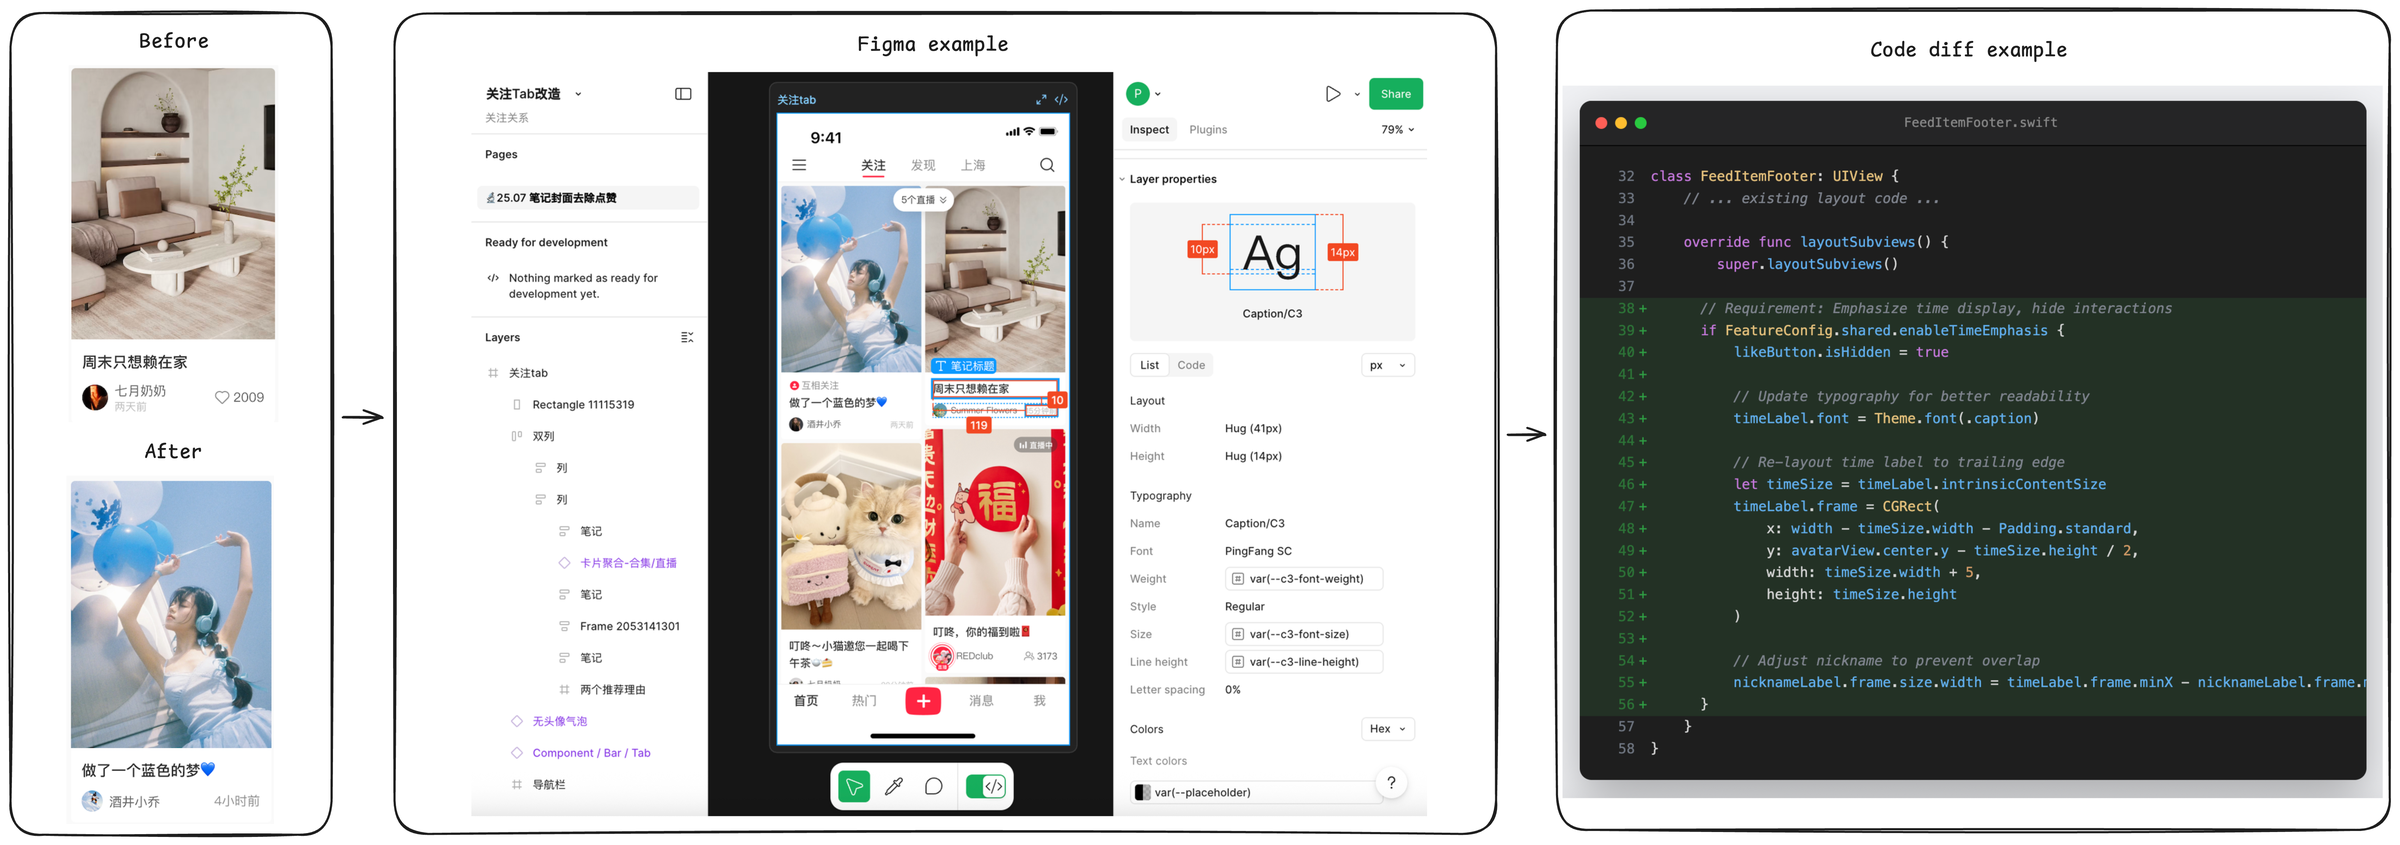
Figure 2. A concrete example of a SWE-Bench Mobile task (Task 056). The agent must interpret the PRD requirements (replace interaction button with publish time label) and visual design (Figma), locate the relevant files in the codebase (FeedItemFooter.swift), and implement the changes while handling edge cases and feature configuration.
Output ( $\mathcal{O}$ ). The expected output is a unified diff patch that, when applied to the codebase, implements the feature described in the PRD. This format matches the standard pull request workflow used in industry.
Evaluation ( $\mathcal{E}$ ). Each task is paired with a task-specific pytest suite (9.1 tests per task on average) that evaluates the generated patch directly. Concretely, tests operate on the unified diff text without compiling or running the iOS application, and therefore avoid build-time overhead and simulator/device nondeterminism. This patch-level evaluation is designed to verify the presence of necessary UI-facing edits (e.g., view construction, layout logic) and data/logic edits (e.g., control-flow, state updates), while remaining tolerant to superficial variability such as identifier naming, refactoring style, and minor structural reorganization.
2.2. Design Principles
SWE-Bench Mobile is constructed under guiding principles to ensure relevance to professional software engineering. End-to-End Realism is paramount; tasks span the full engineering process from PRD to testing, preserving real-world dependencies and incomplete specifications. Unlike synthetic benchmarks, our tasks come from actual product development cycles. Multi-Modal Reasoning is required, as agents must jointly interpret textual requirements (PRD), visual designs (Figma), and structured code. Diverse Coverage ensures robustness, with tasks covering multiple categories (Table 3) and difficulty levels, from simple UI adjustments to complex architectural refactoring. Finally, by focusing on Swift/Objective-C, an Under-Represented Language in LLM training data compared to Python or JavaScript, SWE-Bench Mobile serves as a challenging test of an agent’s ability to generalize to less familiar syntax and frameworks.
2.3. Dataset Statistics
Table 1 summarizes the key statistics of SWE-Bench Mobile. The benchmark consists of 50 tasks with 449 total test cases. The majority of tasks (70%) include Figma designs, and 92% include reference images, highlighting the multi-modal nature of the dataset. The average PRD length is 450 words, providing substantial context. The codebase scale is significant, with the repository size reaching approximately 5GB.
Table 1. SWE-Bench Mobile dataset statistics.
| Metric | Value |
| --- | --- |
| Total Tasks | 50 |
| Total Test Cases | 449 |
| Avg. Test Cases per Task | 9.1 |
| Tasks with Figma Design | 35 (70%) |
| Tasks with Reference Images | 46 (92%) |
| Avg. PRD Length (words) | 450 |
| Codebase Size | Large Scale ( $\sim$ 5GB) |
| Programming Language | Swift/Objective-C (iOS) |
| Avg. Files Modified per Task | 4.2 |
<details>
<summary>x1.png Details</summary>
### Visual Description
## Pie Charts: Category and Difficulty Distribution
### Overview
The image contains two pie charts. The left pie chart shows the distribution of items by category, while the right pie chart shows the distribution of items by difficulty. Each slice of the pie charts represents a different category or difficulty level, with the size of the slice proportional to the number of items in that category or difficulty level.
### Components/Axes
**Left Pie Chart: By Category**
* **Title:** By Category
* **Categories:**
* UI Components: 18 (Orange)
* Data Mgmt: 10 (Reddish-Pink)
* Gesture & Interaction: 8 (Pink)
* Media & Assets: 7 (Purple)
* Networking: 4 (Light Blue)
* Other: 3 (Light Green)
**Right Pie Chart: By Difficulty**
* **Title:** By Difficulty
* **Difficulty Levels:**
* Medium: 25 (Orange)
* Easy: 15 (Light Green)
* Hard: 10 (Reddish-Pink)
### Detailed Analysis
**Left Pie Chart: By Category**
* UI Components (Orange): 18 items, largest slice.
* Data Mgmt (Reddish-Pink): 10 items.
* Gesture & Interaction (Pink): 8 items.
* Media & Assets (Purple): 7 items.
* Networking (Light Blue): 4 items.
* Other (Light Green): 3 items, smallest slice.
**Right Pie Chart: By Difficulty**
* Medium (Orange): 25 items, largest slice.
* Easy (Light Green): 15 items.
* Hard (Reddish-Pink): 10 items, smallest slice.
### Key Observations
* In the "By Category" chart, "UI Components" has the highest number of items, significantly more than other categories.
* In the "By Difficulty" chart, "Medium" difficulty has the highest number of items. "Hard" difficulty has the least.
### Interpretation
The pie charts provide a visual representation of the distribution of items across different categories and difficulty levels. The "By Category" chart suggests that "UI Components" are a significant focus area, while the "By Difficulty" chart indicates that most items are of "Medium" difficulty. This could imply that the system or project being analyzed has a strong emphasis on user interface elements and a moderate level of complexity overall. The relatively small number of items in the "Other" category suggests that the defined categories are comprehensive. The "By Difficulty" chart shows that there are more "Easy" items than "Hard" items, which could indicate a focus on user-friendliness or accessibility.
</details>
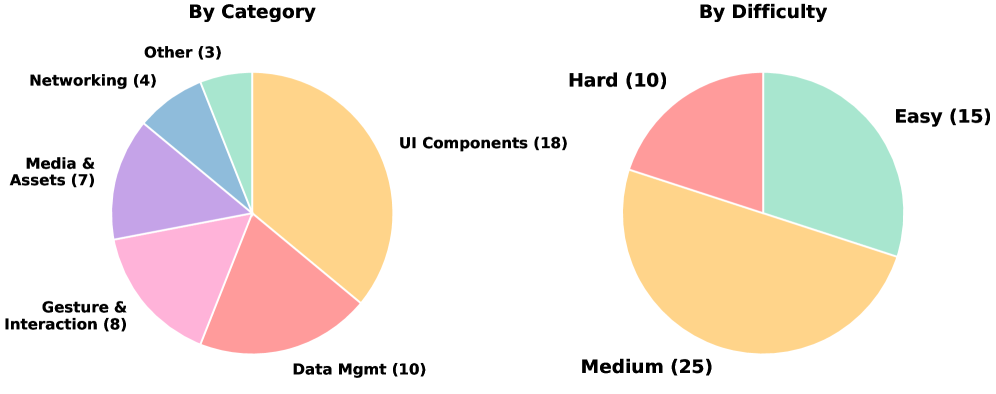
Figure 3. Task distribution by category (left) and difficulty (right). Each label shows the count, percentage, and average agent pass rate. UI Components (36%) dominate the benchmark, while performance drops sharply from Easy (18.5% pass) to Hard (5.8% pass).
2.4. Task Construction
Source. Tasks are derived from real product requirements at XiaoHongShu Inc., a leading social media platform in China with over 300 million monthly active users. Each task represents a feature that was actually implemented by XiaoHongShu engineers in the production iOS application, ensuring realistic complexity and scope. Unlike existing benchmarks that use synthetic problems or isolated bug fixes from open-source repositories, our tasks capture the full complexity of feature development in a commercial mobile application: multi-file changes, UI/UX implementation from design specs, integration with existing business logic, and handling of edge cases and feature flags. This industry-sourced approach ensures that our benchmark reflects the actual challenges faced by software engineers in production environments.
Quality Control. Each task undergoes a rigorous multi-stage review process. First, the PRDs are reviewed to ensure requirements are clear and self-contained. Next, comprehensive test suites are designed to verify both correctness and quality. Finally, we perform human validation to verify that the reference implementation passes all tests.
Difficulty Calibration. Tasks are labeled by implementation complexity based on several factors: the number of files to modify (1-2 for Easy, 3-5 for Medium, 6+ for Hard), the lines of code changed ( $<$ 50 for Easy, 50-150 for Medium, $>$ 150 for Hard), and the architectural complexity, distinguishing between localized changes and cross-module refactoring.
2.5. Evaluation Pipeline
Unlike traditional code benchmarks that rely solely on unit tests, SWE-Bench Mobile performs comprehensive verification through a multi-step pipeline.
Patch-to-Task Routing. SWE-Bench Mobile evaluates submissions as unified diff patches and associates each patch with a specific task. This routing step ensures that each submission is evaluated under the task’s PRD-defined intent and its corresponding test suite, while keeping the evaluation independent of repository checkout, compilation, or runtime execution. In practice, the test harness exposes the patch text to the task-specific tests, enabling purely diff-based verification.
Static Analysis. Before running task-specific assertions, we perform lightweight static checks on the diff text. This includes verifying unified diff structure (e.g., diff --git headers), rejecting empty or near-empty patches, and ensuring that added lines contain meaningful code changes rather than only whitespace or comments. We also check whether the patch touches relevant files using flexible path patterns (e.g., accepting file moves/renames), and apply basic language-agnostic sanity checks to filter malformed submissions early.
Diff-Based Intent Tests. Direct runtime evaluation for mobile applications is challenging to scale. Unit tests are ill-suited for validating visual correctness, while end-to-end UI testing introduces substantial compilation overhead and environmental nondeterminism. To address these constraints, SWE-Bench Mobile adopts a diff-based evaluation strategy: our pytest suites inspect the patch diff and verify structural intent and architectural compliance. This allows us to evaluate high-level architectural decisions and requirement compliance at scale. Tests are constructed from the PRD and a human reference patch, emphasizing:
- Goal-oriented checks: verifying modification patterns (the “what”) rather than exact code shape.
- Feature entry points: checking integration surfaces (e.g., routing, hooks).
- Removal of blocking behavior: ensuring constraints or legacy guards are lifted.
- Cohesion across files: verifying related edits across modules.
- Semantics-aware matching: using flexible pattern matching to accommodate alternative naming.
Batch Reporting and Error Analysis. Beyond pass/fail decisions, our evaluator produces both task-level and test-case-level summaries. For large-scale runs, we classify failures into coarse categories (e.g., missing critical file edits, missing UI components, empty patches). This analysis provides interpretable diagnostics of common agent failure modes and supports systematic iteration on prompts and agent scaffolding.
Metrics. We report two complementary metrics. Task Success Rate is the percentage of tasks where all tests pass, representing the strict standard for a completed feature. Test Pass Rate is the percentage of individual test cases passed, which reveals partial progress even when the full task is not completed. The gap between these metrics reveals how often agents make partial progress without fully completing tasks.
2.6. Comparison with Existing Benchmarks
Table 2 compares SWE-Bench Mobile with existing coding benchmarks. SWE-Bench Mobile distinguishes itself by being multi-modal, including PRDs and Figma designs rather than just code or text descriptions. It operates on a large-scale codebase ( $\sim$ 5GB), significantly larger than the individual repositories or snippets used in other benchmarks. Furthermore, it targets mixed Swift/Objective-C, which is under-represented in training data compared to Python, and focuses on feature implementation rather than bug fixing.
Table 2. Comparison with existing benchmarks.
| Benchmark | Multi-Modal | Codebase | Language |
| --- | --- | --- | --- |
| HumanEval | ✗ | None | Python |
| MBPP | ✗ | None | Python |
| SWE-Bench | ✗ | Medium | Python |
| SWE-Bench Mobile | ✓ | Large | Swift/ObjC |
3. Experiments
We evaluate leading coding agents on SWE-Bench Mobile to answer several key research questions. First, we investigate how state-of-the-art coding agents perform on industry-level mobile development tasks (RQ1). Second, we analyze how task complexity affects agent performance (RQ2). Third, we examine the cost-performance trade-off (RQ3). Fourth, we assess the robustness of agent results across multiple runs (RQ4). Finally, we explore how prompt engineering affects performance (RQ5).
3.1. Experimental Setup
Agents and Models. We evaluate four coding agents spanning commercial and open-source systems: Cursor, an AI-powered code editor with an agent mode; Codex, OpenAI’s coding agent CLI; Claude Code, Anthropic’s coding agent CLI; and OpenCode, an open-source coding agent. We test these agents with multiple backbone models including Claude Opus 4.5, Claude Sonnet 4.5, Claude Haiku, GLM 4.6, GLM 4.7, GPT 5, GPT 5.1, GPT 5.2, and Gemini 3 Pro, yielding 22 agent-model configurations in total.
Metrics. We report two primary metrics: Task Success Rate, which is the percentage of tasks where all test cases pass, and Test Pass Rate, which is the percentage of individual test cases passed. All rates are computed with a fixed denominator of 50 tasks and 449 test cases. When an agent fails to produce a patch for a task (e.g., due to timeout or error), the missing patch is counted as failing all associated tests.
3.2. Main Results (RQ1)
Figure 4 presents the main experimental results across all agent-model configurations.
<details>
<summary>x2.png Details</summary>
### Visual Description
## Horizontal Bar Chart: Task Success Rate by Model Combination
### Overview
The image is a horizontal bar chart comparing the task success rates of different model combinations. The x-axis represents the task success rate in percentage, ranging from 0% to 16%. The y-axis lists the various model combinations. The bars are color-coded to represent different base models: Cursor (red), Codex (blue), Claude Code (green), and OpenCode (orange).
### Components/Axes
* **X-axis:** Task Success Rate (%), ranging from 0 to 16 with increments of 2.
* **Y-axis:** Model Combinations (listed vertically).
* **Legend:** Located in the bottom-right corner, mapping colors to base models:
* Red: Cursor
* Blue: Codex
* Green: Claude Code
* Orange: OpenCode
### Detailed Analysis
Here's a breakdown of the task success rates for each model combination, along with their corresponding colors:
* **Cursor + Opus 4.5:** 12.0% (Red) - Highest success rate for Cursor.
* **Cursor + Sonnet 4.5:** 12.0% (Red) - Highest success rate for Cursor.
* **Codex + GLM 4.6:** 12.0% (Blue) - Highest success rate for Codex.
* **Codex + Sonnet 4.5:** 10.0% (Blue)
* **Codex + GPT 5:** 10.0% (Blue)
* **CC + GLM 4.6:** 10.0% (Green) - Highest success rate for Claude Code.
* **CC + Sonnet 4.5:** 10.0% (Green)
* **Cursor + GPT 5.2:** 8.0% (Red)
* **CC + Opus 4.5:** 8.0% (Green)
* **CC + Haiku:** 8.0% (Green)
* **OC + GLM 4.6:** 8.0% (Orange) - Highest success rate for OpenCode.
* **Cursor + Gemini 3 Pro:** 6.0% (Red)
* **OC + GPT 5.1:** 6.0% (Orange)
* **Codex + Opus 4.5:** 4.0% (Blue)
* **OC + Sonnet 4.5:** 4.0% (Orange)
* **OC + GLM 4.7:** 4.0% (Orange)
* **OC + Gemini 3 Pro:** 4.0% (Orange)
* **OC + GPT 5.2:** 4.0% (Orange)
* **Cursor + GPT 5.1:** 2.0% (Red)
* **OC + Opus 4.5:** 2.0% (Orange)
* **OC + GPT 5:** 2.0% (Orange)
* **Codex + GPT 5.1:** 0.0% (Blue) - Lowest success rate.
### Key Observations
* The highest success rates are achieved by Cursor, Codex, and Claude Code when combined with specific models (Opus 4.5, Sonnet 4.5, and GLM 4.6 respectively).
* Codex + GPT 5.1 has the lowest success rate (0.0%).
* OpenCode generally has lower success rates compared to the other base models.
### Interpretation
The chart illustrates the performance of different model combinations in terms of task success rate. The data suggests that the choice of model combination significantly impacts performance. Certain combinations, such as Cursor + Opus 4.5 and Codex + GLM 4.6, yield significantly higher success rates compared to others. The relatively lower performance of OpenCode across various combinations suggests it may be less effective in these specific tasks or requires further optimization. The 0% success rate for Codex + GPT 5.1 is a notable outlier, indicating a potential incompatibility or issue with this particular combination.
</details>
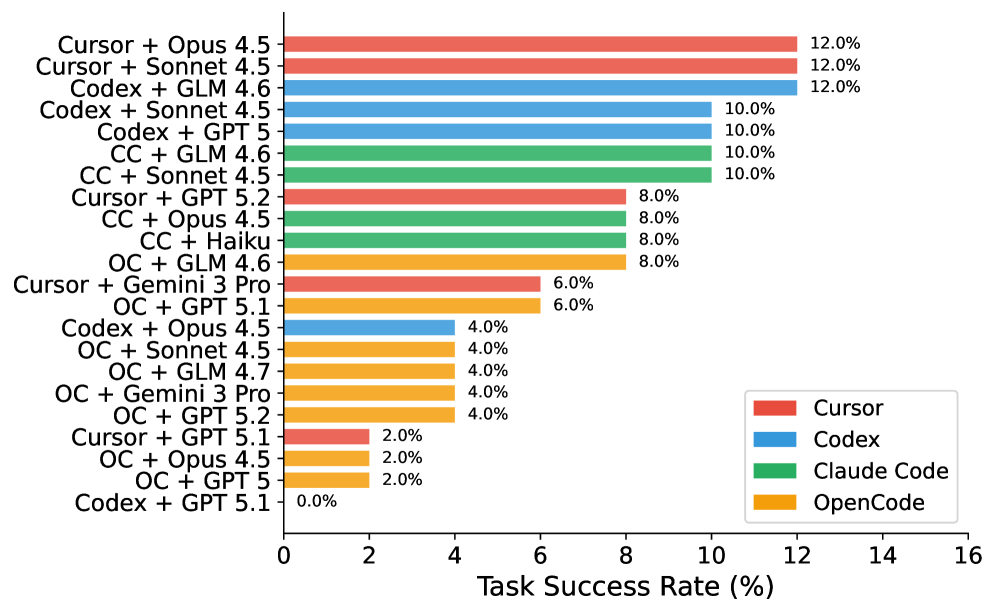
Figure 4. Task Success Rate across all configurations. Best performance is 12%, achieved by Cursor + Opus/Sonnet and Codex + GLM.
Key Findings. Our evaluation reveals a generally low overall performance, with even the best agents solving only 12% of tasks. This indicates a significant gap between current capabilities and industrial requirements. However, the Test Pass Rate (up to 28.1%) is much higher than the Task Success Rate (12%), indicating that agents often make partial progress but fail to complete tasks fully. Notably, we find that the choice of agent matters significantly: the same model (Opus 4.5) achieves 12% on Cursor but only 2% on OpenCode, a 6 $×$ difference. Commercial agents consistently outperform the open-source OpenCode agent: the best OpenCode configuration (GLM 4.6, 8%) trails the best commercial configuration (12%) by 4 percentage points.
3.3. Task Complexity Analysis (RQ2)
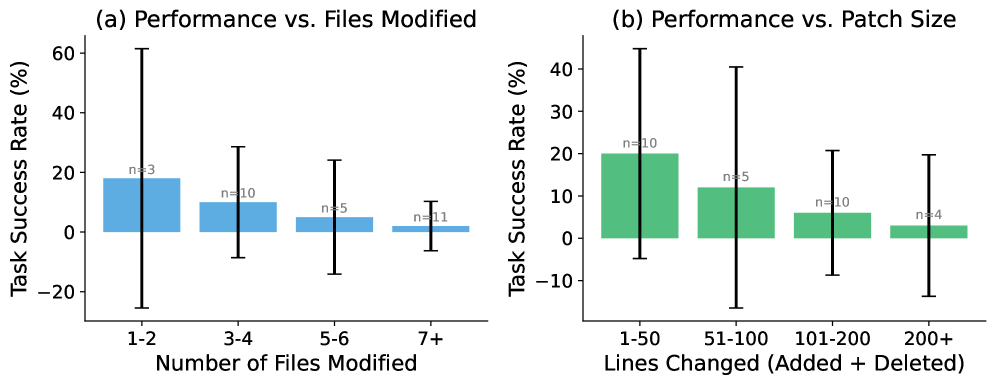
We analyze how task complexity affects agent performance. Figure 5 shows the relationship between task complexity (measured by number of files modified and patch size) and success rate.
<details>
<summary>x3.png Details</summary>
### Visual Description
## Bar Charts: Performance vs. Files Modified and Patch Size
### Overview
The image presents two bar charts comparing task success rate (%) against (a) the number of files modified and (b) the patch size (lines changed). Each bar represents a range of values for the independent variable (files modified or patch size), and the height of the bar indicates the average task success rate for that range. Error bars are included to show the variability in the data. The sample size 'n' is indicated above each bar.
### Components/Axes
**Chart (a): Performance vs. Files Modified**
* **Title:** (a) Performance vs. Files Modified
* **Y-axis:** Task Success Rate (%)
* Scale: 0 to 60, with tick marks at 0, 20, 40, and 60. Negative values are also shown to -20.
* **X-axis:** Number of Files Modified
* Categories: 1-2, 3-4, 5-6, 7+
* **Bar Color:** Light Blue
* **Error Bars:** Black lines indicating variability.
* **Sample Size:** 'n' values are displayed above each bar.
**Chart (b): Performance vs. Patch Size**
* **Title:** (b) Performance vs. Patch Size
* **Y-axis:** Task Success Rate (%)
* Scale: 0 to 40, with tick marks at 0, 10, 20, 30, and 40. Negative values are also shown to -10.
* **X-axis:** Lines Changed (Added + Deleted)
* Categories: 1-50, 51-100, 101-200, 200+
* **Bar Color:** Green
* **Error Bars:** Black lines indicating variability.
* **Sample Size:** 'n' values are displayed above each bar.
### Detailed Analysis
**Chart (a): Performance vs. Files Modified**
* **1-2 Files Modified:**
* Task Success Rate: Approximately 18%
* Sample Size (n): 3
* Error Bar: Extends from approximately -25% to 60%
* **3-4 Files Modified:**
* Task Success Rate: Approximately 10%
* Sample Size (n): 10
* Error Bar: Extends from approximately -10% to 30%
* **5-6 Files Modified:**
* Task Success Rate: Approximately 5%
* Sample Size (n): 5
* Error Bar: Extends from approximately -15% to 25%
* **7+ Files Modified:**
* Task Success Rate: Approximately 2%
* Sample Size (n): 11
* Error Bar: Extends from approximately -5% to 10%
**Trend (a):** The task success rate generally decreases as the number of files modified increases.
**Chart (b): Performance vs. Patch Size**
* **1-50 Lines Changed:**
* Task Success Rate: Approximately 20%
* Sample Size (n): 10
* Error Bar: Extends from approximately -5% to 45%
* **51-100 Lines Changed:**
* Task Success Rate: Approximately 12%
* Sample Size (n): 5
* Error Bar: Extends from approximately -15% to 40%
* **101-200 Lines Changed:**
* Task Success Rate: Approximately 7%
* Sample Size (n): 10
* Error Bar: Extends from approximately -10% to 25%
* **200+ Lines Changed:**
* Task Success Rate: Approximately 3%
* Sample Size (n): 4
* Error Bar: Extends from approximately -15% to 20%
**Trend (b):** The task success rate generally decreases as the number of lines changed (patch size) increases.
### Key Observations
* In both charts, the highest task success rate is observed when the number of files modified or lines changed is the lowest (1-2 files or 1-50 lines).
* The error bars are quite large, indicating substantial variability in the task success rates within each category.
* The sample sizes vary across the categories, which could affect the reliability of the average task success rates.
### Interpretation
The data suggests that smaller changes (fewer files modified or smaller patch sizes) are associated with higher task success rates. This could be because smaller changes are easier to understand, review, and integrate, leading to fewer errors. The large error bars indicate that other factors besides the number of files or lines changed also influence task success. The decreasing trend in task success rate with increasing files modified or lines changed could be due to increased complexity and potential for errors in larger changesets. The sample sizes are relatively small, especially for the '1-2 files' and '200+ lines' categories, which limits the generalizability of the findings.
</details>
Figure 5. Performance decreases sharply with task complexity. (a) Tasks requiring 1-2 file modifications have 18% success rate vs. 2% for 7+ files. (b) Small patches ( $<$ 50 lines) achieve 20% success vs. 3% for large patches ( $>$ 200 lines). Error bars show 95% confidence intervals based on binomial proportions.
Key Findings. Performance drops sharply as complexity increases. The success rate drops from 18% for tasks requiring 1-2 file modifications to just 2% for tasks requiring 7+ files, suggesting that agents struggle with cross-file reasoning. Similarly, larger patches correlate with lower success, indicating difficulty with complex implementations.
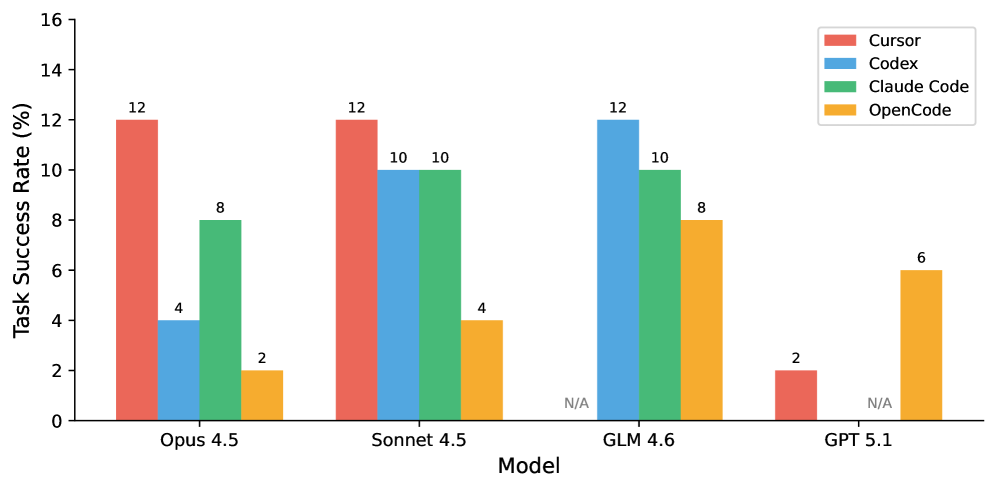
3.4. Model Comparison Across Agents
A surprising finding is that the same model performs very differently across agents. Figure 6 shows this comparison across all four agents.
<details>
<summary>x4.png Details</summary>
### Visual Description
## Bar Chart: Task Success Rate by Model
### Overview
The image is a bar chart comparing the task success rates of four different coding models (Cursor, Codex, Claude Code, and OpenCode) across four different model versions (Opus 4.5, Sonnet 4.5, GLM 4.6, and GPT 5.1). The y-axis represents the task success rate in percentage, ranging from 0% to 16%. The x-axis represents the model versions.
### Components/Axes
* **X-axis:** Model (Opus 4.5, Sonnet 4.5, GLM 4.6, GPT 5.1)
* **Y-axis:** Task Success Rate (%) - Scale from 0 to 16, with tick marks at every increment of 2.
* **Legend (Top-Right):**
* Red: Cursor
* Blue: Codex
* Green: Claude Code
* Orange: OpenCode
### Detailed Analysis
Here's a breakdown of the task success rates for each model version:
* **Opus 4.5:**
* Cursor (Red): 12%
* Codex (Blue): 4%
* Claude Code (Green): 8%
* OpenCode (Orange): 2%
* **Sonnet 4.5:**
* Cursor (Red): 12%
* Codex (Blue): 10%
* Claude Code (Green): 10%
* OpenCode (Orange): 4%
* **GLM 4.6:**
* Cursor (Red): N/A
* Codex (Blue): 12%
* Claude Code (Green): 10%
* OpenCode (Orange): 8%
* **GPT 5.1:**
* Cursor (Red): 2%
* Codex (Blue): N/A
* Claude Code (Green): N/A
* OpenCode (Orange): 6%
### Key Observations
* Cursor performs best on Opus 4.5 and Sonnet 4.5, with a task success rate of 12% in both cases.
* Codex achieves its highest task success rate (12%) on GLM 4.6.
* Claude Code shows relatively consistent performance across Opus 4.5, Sonnet 4.5, and GLM 4.6 (8%, 10%, and 10% respectively).
* OpenCode has the lowest task success rate on Opus 4.5 (2%) and peaks at 8% on GLM 4.6.
* Data is missing for Cursor on GLM 4.6, Codex and Claude Code on GPT 5.1.
### Interpretation
The bar chart provides a comparative analysis of the task success rates of four different coding models across four different model versions. The data suggests that the performance of each coding model varies depending on the model version used. For example, Cursor performs well on Opus 4.5 and Sonnet 4.5, but its performance drops significantly on GPT 5.1. Similarly, Codex achieves its highest task success rate on GLM 4.6. The missing data points for certain models on specific versions indicate that those models may not be compatible with those versions or that the data was not available for those combinations. Overall, the chart highlights the importance of selecting the appropriate coding model and model version to achieve optimal task success rates.
</details>
Figure 6. Same model, different agents: Opus 4.5 achieves 12% on Cursor but only 2% on OpenCode—a 6 $×$ gap. Commercial agents consistently outperform the open-source alternative.
Implications. This finding suggests that agent scaffolding (tool use, context management, iteration strategy) is as important as the underlying model capability. The performance gap between commercial agents (Cursor, Codex, Claude Code) and the open-source OpenCode is substantial across all models, suggesting that years of engineering investment in tool integration, context management, and iterative refinement provide significant advantages. Practitioners should evaluate agents holistically rather than focusing solely on model benchmarks.
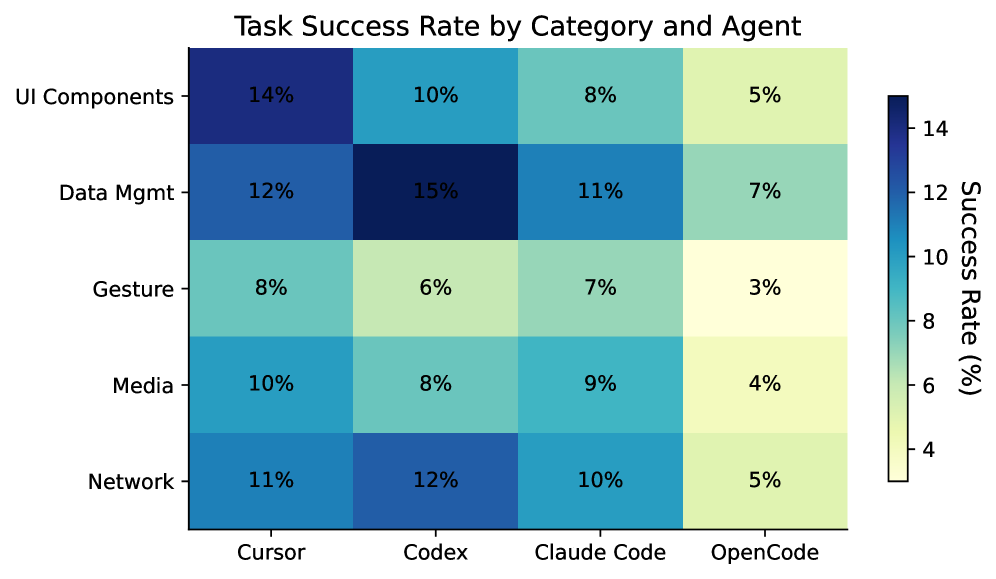
3.5. Performance by Task Category
We analyze how agents perform across different task categories. Figure 7 shows the success rate breakdown.
<details>
<summary>x5.png Details</summary>
### Visual Description
## Heatmap: Task Success Rate by Category and Agent
### Overview
The image is a heatmap displaying the task success rate, in percentage, for different categories (UI Components, Data Mgmt, Gesture, Media, Network) across various agents (Cursor, Codex, Claude Code, OpenCode). The color intensity represents the success rate, with darker blues indicating higher success rates and lighter yellows indicating lower success rates.
### Components/Axes
* **Title:** Task Success Rate by Category and Agent
* **Y-axis (Categories):** UI Components, Data Mgmt, Gesture, Media, Network
* **X-axis (Agents):** Cursor, Codex, Claude Code, OpenCode
* **Color Scale (Success Rate %):** A vertical color bar on the right side of the heatmap indicates the success rate percentage. The scale ranges from approximately 4% (light yellow) to 14% (dark blue). The scale is marked at intervals of 4, 6, 8, 10, 12, and 14.
### Detailed Analysis
Here's a breakdown of the success rates for each category and agent:
* **UI Components:**
* Cursor: 14%
* Codex: 10%
* Claude Code: 8%
* OpenCode: 5%
* **Data Mgmt:**
* Cursor: 12%
* Codex: 15%
* Claude Code: 11%
* OpenCode: 7%
* **Gesture:**
* Cursor: 8%
* Codex: 6%
* Claude Code: 7%
* OpenCode: 3%
* **Media:**
* Cursor: 10%
* Codex: 8%
* Claude Code: 9%
* OpenCode: 4%
* **Network:**
* Cursor: 11%
* Codex: 12%
* Claude Code: 10%
* OpenCode: 5%
### Key Observations
* Codex has the highest success rate (15%) for Data Mgmt.
* OpenCode consistently has the lowest success rates across all categories.
* UI Components have the highest success rate with Cursor (14%).
* Gesture has the lowest success rate with OpenCode (3%).
### Interpretation
The heatmap provides a comparative analysis of task success rates across different categories and agents. The data suggests that Codex performs particularly well in Data Management tasks, while OpenCode generally underperforms across all categories. Cursor shows strong performance in UI Components. The heatmap allows for easy identification of strengths and weaknesses of each agent in specific task categories. The color gradient effectively highlights the variations in success rates, making it easy to identify high and low performance areas.
</details>
Figure 7. Task Success Rate by Category and Agent. Agents generally perform better on Data Management tasks but struggle with Gesture & Interaction and Media tasks, which require complex multi-modal reasoning.
3.6. Cost and Time Analysis (RQ3)
Table 3 presents the cost and time metrics for each configuration. We measure API cost per task and average execution time.
Table 3. Cost and time comparison across all agents. Best value in each column is bold. OpenCode costs are reported via OpenRouter API billing.
| Agent | Model | Cost ($/task) | Time (min) |
| --- | --- | --- | --- |
| Cursor | Opus 4.5 | 3.50 | 15.0 |
| Cursor | Sonnet 4.5 | 2.00 | 14.2 |
| Codex | GLM 4.6 | 1.30 | 13.3 |
| Codex | Sonnet 4.5 | 2.50 | 12.5 |
| CC | GLM 4.6 | 1.30 | 11.7 |
| CC | Sonnet 4.5 | 2.00 | 13.3 |
| CC | Opus 4.5 | 4.00 | 15.0 |
| CC | Haiku | 0.50 | 8.3 |
| OC | Opus 4.5 | 9.33 | 8.2 |
| OC | Sonnet 4.5 | 3.50 | 11.1 |
| OC | GLM 4.6 | 0.13 | 32.5 |
| OC | GLM 4.7 | 0.49 | 52.1 |
| OC | GPT 5 | 0.18 | 9.8 |
| OC | GPT 5.1 | 0.02 | 2.0 |
| OC | GPT 5.2 | 0.04 | 10.9 |
| OC | Gemini 3 Pro | 0.03 | 8.9 |
Key Findings. Among commercial agents, Codex + GLM 4.6 offers the best value, achieving 12% success at only $1.30/task—the same success rate as Cursor + Opus 4.5 but at less than half the cost ($3.50/task). OpenCode exhibits a striking cost–time trade-off: it is dramatically cheaper (GLM 4.6 at $0.13/task vs. $1.30 for Codex/CC), but GLM models run much slower (32–52 min vs. 11–13 min). OpenCode + Opus 4.5 is the most expensive configuration at $9.33/task yet achieves only 2% success, while OpenCode + GPT 5.1 is the cheapest at $0.02/task but completes tasks in only 2 minutes on average—likely because it fails quickly on most tasks (6% success, 7.1% test pass rate).
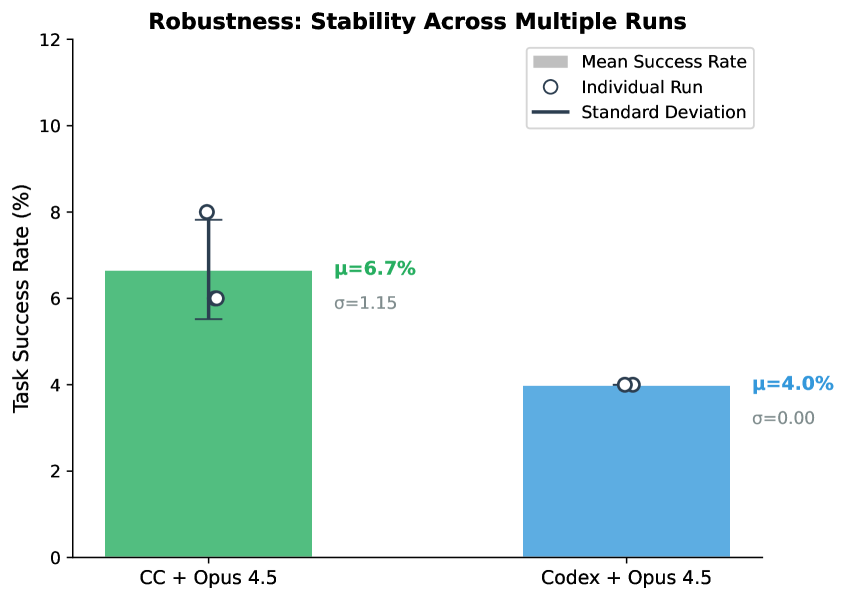
3.7. Robustness Analysis (RQ4)
To assess result stability, we run selected configurations multiple times. Figure 8 shows the variance across runs.
<details>
<summary>x6.png Details</summary>
### Visual Description
## Bar Chart: Robustness: Stability Across Multiple Runs
### Overview
The image is a bar chart comparing the task success rate of two different systems: "CC + Opus 4.5" and "Codex + Opus 4.5". The chart displays the mean success rate for each system, along with individual run data points and standard deviation.
### Components/Axes
* **Title:** Robustness: Stability Across Multiple Runs
* **Y-axis:** Task Success Rate (%)
* Scale: 0 to 12, with tick marks at intervals of 2.
* **X-axis:** Categorical, representing the two systems being compared.
* Categories: "CC + Opus 4.5" and "Codex + Opus 4.5"
* **Legend:** Located in the top-right corner.
* Mean Success Rate (represented by the filled bars)
* Individual Run (represented by the hollow circles)
* Standard Deviation (represented by the vertical black lines)
### Detailed Analysis
* **CC + Opus 4.5:**
* Mean Success Rate: Approximately 6.7% (indicated by the top of the green bar).
* Individual Run: A white circle is plotted at approximately 6% on the green bar.
* Standard Deviation: A black vertical line extends from approximately 5.5% to 8%
* μ = 6.7%
* σ = 1.15
* **Codex + Opus 4.5:**
* Mean Success Rate: Approximately 4.0% (indicated by the top of the blue bar).
* Individual Run: Two white circles are plotted at approximately 4% on the blue bar.
* Standard Deviation: No visible standard deviation line, implying a very small or zero standard deviation.
* μ = 4.0%
* σ = 0.00
### Key Observations
* The "CC + Opus 4.5" system has a higher mean task success rate (6.7%) compared to the "Codex + Opus 4.5" system (4.0%).
* The "CC + Opus 4.5" system exhibits a standard deviation of 1.15, indicating more variability in its task success rate across multiple runs.
* The "Codex + Opus 4.5" system has a standard deviation of 0.00, suggesting consistent performance across multiple runs.
### Interpretation
The chart suggests that the "CC + Opus 4.5" system generally performs better in terms of task success rate, but its performance is more variable. The "Codex + Opus 4.5" system, while having a lower mean success rate, demonstrates more consistent performance. The standard deviation values indicate the stability of each system across multiple runs. The "Codex + Opus 4.5" system appears to be more stable, while the "CC + Opus 4.5" system has more fluctuation in its performance.
</details>
Figure 8. Result stability across multiple runs. Error bars indicate standard deviation. While Claude Code shows moderate variance ( $\sigma$ =1.15%), the absolute fluctuation is small ( $±$ 1 task), indicating that agent performance is relatively stable.
Observations. We observe moderate variance for Claude Code + Opus 4.5, with scores of 6%, 8%, and 6% across 3 runs ( $\mu$ =6.7%, $\sigma$ =1.15%). In contrast, Codex + Opus 4.5 is perfectly stable at 4% across runs.
3.8. Prompt Engineering (RQ5)
We conduct a systematic ablation study with 12 prompt variants using Claude Code + GLM 4.6. Table 4 shows the results.
Table 4. Prompt ablation results. Best and worst highlighted. Full prompts in Appendix C.
| Prompt Strategy | Task (%) | Test (%) |
| --- | --- | --- |
| Defensive Programming | 10.0 | 26.7 |
| Quality Focused | 10.0 | 26.3 |
| Example Driven | 10.0 | 23.4 |
| Chain of Thought | 10.0 | 21.8 |
| Baseline | 10.0 | 19.3 |
| Explicit Instructions | 8.0 | 17.8 |
| Figma Emphasis | 8.0 | 18.0 |
| Test Driven | 6.0 | 22.0 |
| Detailed Role | 4.0 | 20.7 |
| Structured Checklist | 4.0 | 20.7 |
| Context Rich | 4.0 | 22.7 |
| Comprehensive | 4.0 | 22.7 |
Key Findings. The ”Defensive Programming” prompt strategy performs best, improving the Test Pass Rate by 7.4% over the baseline (19.3% $→$ 26.7%) while maintaining the same Task Success Rate (10.0%). This indicates that while both prompts complete the same number of tasks fully, Defensive Programming handles edge cases better in partially-completed tasks, passing significantly more individual test cases. This suggests that emphasizing defensive coding practices helps agents avoid common pitfalls even when they cannot complete all requirements. Interestingly, complexity appears to hurt performance; overly detailed prompts reduce Task Success from 10.0% to 4.0%. Overall, prompts focusing on code quality outperform those emphasizing workflow.
3.9. Error Analysis
We categorize failure modes across all experiments by analyzing test failure messages from the best-performing agents. The most critical failure pattern is Missing Feature Flags (54%), where agents implement core functionality but fail to add proper feature toggles or experiment flags—a standard practice in production mobile development for gradual rollout and A/B testing. Missing Data Models (22%) occurs when agents fail to create or update data structures required by the PRD. Missing Files (11-15%) represents cases where agents identify some but not all required files to modify. Missing UI Components (11-15%) captures failures to implement specific UI elements like buttons, labels, or views. Missing Required Methods (9%) reflects incomplete class implementations. While Incomplete Multi-File Implementation affects only 4-7% of tasks, it disproportionately impacts complex features requiring coordination across 5+ files. The dominance of feature flag failures highlights a gap between agents’ code generation capabilities and their understanding of production deployment practices.
4. Discussion and Conclusion
Our evaluation reveals a significant gap between current agent capabilities and the demands of industrial mobile development, with the best configurations achieving only a 12% success rate. This shortfall, primarily driven by failures in cross-file reasoning and requirement understanding, underscores that autonomous software engineering remains an open challenge.
Implications. For practitioners, our results suggest that agents should currently be viewed as “copilots” requiring human oversight rather than autonomous developers. The high variance in performance across agents for the same model (e.g., Cursor 12% vs. OpenCode 2% for Opus 4.5) highlights the critical role of agent scaffolding—practitioners should evaluate the complete system, not just the underlying model. The consistent gap between commercial and open-source agents suggests that engineering investment in tool integration and context management provides significant practical value. Furthermore, cost-effective models like GLM 4.6 can match the performance of expensive frontier models when paired with effective agent frameworks, offering a viable path for scalable adoption. For researchers, the sharp performance drop on complex, multi-file tasks (18% vs. 2%) points to a need for better code context retrieval and graph-based reasoning. The 25% failure rate due to requirement misunderstanding calls for improved grounding of natural language PRDs into code. Additionally, the under-utilization of visual designs suggests that future work must better integrate multi-modal signals into the coding loop.
Future Work. We plan to expand SWE-Bench Mobile along several dimensions. First, we will add Android (Kotlin) tasks to enable cross-platform comparison and investigate whether agents exhibit consistent strengths and weaknesses across mobile ecosystems. Second, we will integrate simulator-based runtime evaluation to verify UI rendering, gesture handling, and state management—aspects that text-based diff inspection cannot capture. Third, we aim to evaluate additional open-source agents like OpenHands and SWE-Agent, and open-weight models like Qwen-Coder, to further broaden the benchmark’s coverage. Finally, we plan to develop a public API for continuous evaluation, allowing agent providers to track their progress over time as both models and scaffolding improve.
In conclusion, SWE-Bench Mobile provides a rigorous testbed for the next generation of coding agents. While current performance is modest, the benchmark offers a clear roadmap for advancing agents from simple script generation to complex, industry-level software development.
5. Related Work
5.1. Code Generation Benchmarks
Early benchmarks for code generation focused on algorithmic problem-solving. HumanEval (Chen et al., 2021) introduced 164 hand-crafted Python programming problems with unit tests, becoming a standard evaluation for code LLMs. MBPP (Austin et al., 2021) expanded this with 974 crowd-sourced problems. While influential, these benchmarks test isolated function generation rather than realistic software engineering.
SWE-Bench (Jimenez et al., 2024) marked a significant advance by evaluating agents on real GitHub issues from popular Python repositories. Agents must understand issue descriptions, navigate codebases, and generate patches that pass existing tests. The benchmark has since evolved into a family of tasks, including SWE-bench Multimodal (Yang et al., 2025a), which incorporates visual elements such as screenshots and diagrams to test visual software domains; SWE-bench Multilingual (Zan et al., 2025; Yang et al., 2025b), which expands evaluation to 9 programming languages beyond Python; and SWE-bench Pro (Deng et al., 2025), which introduces longer-horizon instances and includes proprietary/commercial codebases. Even with these extensions, many existing benchmarks still derive tasks from GitHub issue and pull-request artifacts, which more often emphasize bug fixing and localized improvements than new feature implementation from high-level specifications.
Other benchmarks target specific domains: DS-1000 (Lai et al., 2023) for data science, ODEX (Wang et al., 2022) for open-domain execution, and ClassEval (Du et al., 2024) for class-level generation. DevBench (Li et al., 2024) evaluates repository-level coding but still focuses on Python.
SWE-Bench Mobile differs from these benchmarks in several key aspects: (1) multi-modal inputs including PRDs and Figma designs, (2) a large-scale production codebase (approx. 5GB), (3) mixed Swift/Objective-C target languages, and (4) feature implementation rather than bug fixing.
5.2. Coding Agents
The emergence of powerful LLMs has enabled a new generation of autonomous coding agents. These systems go beyond simple code completion to perform multi-step reasoning, tool use, and iterative refinement.
Commercial agents include GitHub Copilot (Microsoft), Cursor (Anysphere), Claude Code (Anthropic), and Codex CLI (OpenAI). These agents integrate with development environments and can navigate codebases, run tests, and iterate on solutions.
Open-source agents have emerged as alternatives. OpenCode provides a terminal-based coding agent supporting multiple LLM backends. SWE-Agent (Yang et al., 2024) introduces an agent-computer interface optimized for software engineering. AutoCodeRover (Zhang et al., 2024b) combines code search with LLM reasoning. Agentless (Xia et al., 2024) shows that simpler approaches without complex agent loops can be competitive. CodeAgent (Zhang et al., 2024a) uses a repository-level code graph for navigation.
Our work provides a challenging benchmark for evaluating both commercial and open-source agents on industry-level tasks, revealing significant gaps in current capabilities and the importance of agent scaffolding.
5.3. Multi-Modal Code Understanding
Recent work has explored combining visual and textual information for code-related tasks. Design2Code (Si et al., 2024) evaluates generating code from webpage screenshots. Screenshot2Code systems convert UI designs to implementation.
SWE-Bench Mobile extends this direction by incorporating Figma designs as part of the input specification, requiring agents to reason about visual layouts alongside textual requirements.
5.4. Prompt Engineering for Code
Prompt engineering significantly impacts LLM performance on coding tasks. Chain-of-thought prompting (Wei et al., 2022) improves reasoning. Self-debugging (Chen et al., 2023) enables iterative refinement. Structured prompts with role definitions and examples often outperform simple instructions.
Our ablation study (Section 3.8) systematically evaluates 12 prompt strategies, finding that “Defensive Programming” prompts emphasizing edge cases outperform both simple baselines and complex multi-step prompts.
Limitations
Platform Scope. SWE-Bench Mobile focuses on a single production iOS codebase from XiaoHongShu, which ensures depth and realism but limits generalization to other mobile platforms (Android, cross-platform frameworks like Flutter/React Native) and programming paradigms. The Swift/Objective-C mixed-language codebase, while representative of many large iOS projects, may not capture challenges unique to Kotlin-based Android development or cross-platform toolchains.
Evaluation Methodology. Our evaluation uses text-based diff inspection rather than runtime execution, which means we validate structural correctness and architectural compliance but cannot detect issues that only manifest during runtime interactions, on specific devices, or under particular OS versions. Future work should integrate simulator-based testing to capture dynamic behaviors such as UI rendering, memory management, and concurrency issues.
Prompt and Model Coverage. Our prompt ablation study covers one agent-model configuration (Claude Code + GLM 4.6) and 12 prompt variants. While this provides insights into prompt sensitivity, different models may respond differently to these strategies. Additionally, API costs reported are based on pricing at experiment time and may vary with different prompting strategies or model updates.
Benchmark Scale. The benchmark’s 50 tasks, while derived from real product development, represent a snapshot of mobile development challenges and may not cover all possible feature types (e.g., real-time communication, payment integration, accessibility features) or edge cases encountered in production. We plan to continuously expand the task set to improve coverage.
Ethics Statement
The tasks and codebase in SWE-Bench Mobile are derived from XiaoHongShu Inc. with explicit permission for research use. The codebase snapshot excludes sensitive credentials and business logic. Human validation was performed by the authors and XiaoHongShu engineers; no crowdworkers were employed.
Our work evaluates AI agents for software engineering tasks. Current performance (12% task success rate) indicates that human oversight remains essential. We view these agents as assistive tools rather than replacements for human developers. Practitioners should use comprehensive testing and code review when deploying AI-generated code, as emphasized by our benchmark’s evaluation approach.
References
- (1)
- Atlassian (2024) Atlassian. 2024. How to Write a Product Requirements Document (PRD). https://www.atlassian.com/agile/product-management/requirements.
- Austin et al. (2021) Jacob Austin, Augustus Odena, Maxwell Nye, Maarten Bosma, Henryk Michalewski, David Dohan, Ellen Jiang, Carrie Cai, Michael Terry, Quoc Le, et al. 2021. Program Synthesis with Large Language Models. arXiv preprint arXiv:2108.07732 (2021).
- Chen et al. (2021) Mark Chen, Jerry Tworek, Heewoo Jun, Qiming Yuan, Henrique Ponde de Oliveira Pinto, Jared Kaplan, Harri Edwards, Yuri Burda, Nicholas Joseph, Greg Brockman, et al. 2021. Evaluating Large Language Models Trained on Code. arXiv preprint arXiv:2107.03374 (2021).
- Chen et al. (2023) Xinyun Chen, Maxwell Lin, Nathanael Schärli, and Denny Zhou. 2023. Teaching Large Language Models to Self-Debug. arXiv preprint arXiv:2304.05128 (2023).
- Deng et al. (2025) Xiang Deng, Jeff Da, Edwin Pan, Yannis Yiming He, Charles Ide, Kanak Garg, Niklas Lauffer, Andrew Park, Nitin Pasari, Chetan Rane, et al. 2025. SWE-Bench Pro: Can AI Agents Solve Long-Horizon Software Engineering Tasks? arXiv preprint arXiv:2509.16941 (2025).
- Du et al. (2024) Xueying Du, Mingwei Liu, Kaixin Wang, Hanlin Wang, Junwei Liu, Yixuan Chen, Jiayi Feng, Chaofeng Sha, Xin Peng, and Yiling Lou. 2024. ClassEval: A Manually-Crafted Benchmark for Evaluating LLMs on Class-level Code Generation. In International Conference on Machine Learning.
- Jimenez et al. (2024) Carlos E Jimenez, John Yang, Alexander Wettig, Shunyu Yao, Kexin Pei, Ofir Press, and Karthik R Narasimhan. 2024. SWE-bench: Can Language Models Resolve Real-world GitHub Issues?. In The Twelfth International Conference on Learning Representations.
- Lai et al. (2023) Yuhang Lai, Chengxi Li, Yiming Wang, Tianyi Zhang, Ruiqi Zhong, Luke Zettlemoyer, Wen-tau Yih, Daniel Fried, Sida Wang, and Tao Yu. 2023. DS-1000: A Natural and Reliable Benchmark for Data Science Code Generation. In International Conference on Machine Learning.
- Li et al. (2024) Bowen Li, Wenhan Wu, Ziwei Tang, Lin Shi, John Yang, Jinyang Li, Shunyu Yao, Chen Xiong, and Karthik Narasimhan. 2024. DevBench: A Comprehensive Benchmark for Software Development. arXiv preprint arXiv:2403.08604 (2024).
- Si et al. (2024) Chenglei Si, Yanzhe Li, Zhengyuan Jiang, Xinyang Liu, Zheng Lu, Yuqing Jiang, Yong Liu, Yu Wang, Yujiu Yuan, Lydia Liu, et al. 2024. Design2Code: How Far Are We From Automating Front-End Engineering? arXiv preprint arXiv:2403.03163 (2024).
- Wang et al. (2022) Zhiruo Wang, Shuyan Zhou, Daniel Fried, and Graham Neubig. 2022. Execution-Based Evaluation for Open-Domain Code Generation. arXiv preprint arXiv:2212.10481 (2022).
- Wei et al. (2022) Jason Wei, Xuezhi Wang, Dale Schuurmans, Maarten Bosma, Fei Xia, Ed Chi, Quoc V Le, Denny Zhou, et al. 2022. Chain-of-Thought Prompting Elicits Reasoning in Large Language Models. Advances in Neural Information Processing Systems 35 (2022), 24824–24837.
- Xia et al. (2024) Chunqiu Steven Xia, Yinlin Deng, Soren Dunn, and Lingming Zhang. 2024. Agentless: Demystifying LLM-based Software Engineering Agents. arXiv preprint arXiv:2407.01489 (2024).
- Yang et al. (2024) John Yang, Carlos E Jimenez, Alexander Wettig, Kilian Lieret, Shunyu Yao, Karthik Narasimhan, and Ofir Press. 2024. SWE-agent: Agent-Computer Interfaces Enable Automated Software Engineering. arXiv preprint arXiv:2405.15793 (2024).
- Yang et al. (2025a) John Yang, Carlos E Jimenez, Alex L Zhang, Kilian Lieret, Joyce Yang, Xindi Wu, Ofir Press, Niklas Muennighoff, Gabriel Synnaeve, Karthik R Narasimhan, et al. 2025a. SWE-bench Multimodal: Do AI Systems Generalize to Visual Software Domains?. In The Thirteenth International Conference on Learning Representations.
- Yang et al. (2025b) John Yang, Kilian Lieret, Carlos E Jimenez, Alexander Wettig, Kabir Khandpur, Yanzhe Zhang, Binyuan Hui, Ofir Press, Ludwig Schmidt, and Diyi Yang. 2025b. SWE-smith: Scaling Data for Software Engineering Agents. arXiv preprint arXiv:2504.21798 (2025).
- Zan et al. (2025) Daoguang Zan, Zhirong Huang, Wei Liu, Hanwu Chen, Linhao Zhang, Shulin Xin, Lu Chen, Qi Liu, Xiaojian Zhong, Aoyan Li, Siyao Liu, Yongsheng Xiao, Liangqiang Chen, Yuyu Zhang, Jing Su, Tianyu Liu, Rui Long, Kai Shen, and Liang Xiang. 2025. Multi-SWE-bench: A Multilingual Benchmark for Issue Resolving. arXiv:2504.02605 [cs.SE] https://arxiv.org/abs/2504.02605
- Zhang et al. (2024a) Kechi Zhang, Jia Li, Ge Li, Xianjie Shi, and Zhi Jin. 2024a. CodeAgent: Enhancing Code Generation with Tool-Integrated Agent Systems for Real-World Repo-level Coding Challenges. arXiv preprint arXiv:2401.07339 (2024).
- Zhang et al. (2024b) Yuntong Zhang, Haifeng Ruan, Zhiyu Fan, and Abhik Roychoudhury. 2024b. AutoCodeRover: Autonomous Program Improvement. arXiv preprint arXiv:2404.05427 (2024).
Appendix A Task Examples
We present two representative tasks from SWE-Bench Mobile to illustrate the benchmark format. Each task includes a Product Requirement Document (PRD) with design specifications, translated from the original Chinese used by the development team.
A.1. Task 003: Custom Emoji Limit Adjustment
Difficulty: Easy Files to Modify: 3 Test Cases: 5
Adjust Custom Emoji Collection Limit
Background The current custom emoji (saved stickers) limit is hardcoded to 300 on the client side. As user demand grows, we need to increase this limit to better serve our users. Requirements (1)
Increase limit: Change from 300 to 999 (2)
Update UI prompts: Adjust warning messages to reflect new limit (3)
Server-driven config: Remove hardcoded values; future changes should not require app updates (4)
Comprehensive coverage: Apply to all emoji-saving scenarios (chat, comments, etc.) Competitor Analysis App Emoji Limit WeChat 999 Douyin (TikTok) 599 Kuaishou 158
Design Mockups See Figure 9 for the original design specifications provided to developers.
Evaluation Criteria
- Hardcoded limit (300) removed or increased to $≥$ 450
- New limit (999) properly configured
- Server-driven configuration implemented
- Changes applied across multiple files
- Non-empty, meaningful code changes
A.2. Task 007: Card Message Click Decoupling
Difficulty: Medium Files to Modify: 5 Test Cases: 5
iOS Card Reference Click Decoupling
Background Card messages have been added to the app. While most iOS code is decoupled from the messaging module, the click logic for card message references remains coupled in AppChatBaseViewController. This task decouples the click handling for better maintainability. Architecture Design Abstract click logic to CardRefBaseProvider. The view controller should find the concrete implementation based on card type, following the provider pattern. Implementation Sketch
⬇ @objc (AppRefMessageDataService) public class AppRefMessageDataService: NSObject { var chatType: String? var chatId: String? var senderId: String? var messageId: String? }
Impact Scope: Shopping card, Advertisement card
Evaluation Criteria
- New AppRefMessageDataService class created
- Click handling moved out of AppChatBaseViewController
- Provider pattern correctly implemented
- Shopping and advertisement card handling works
- No regression in existing functionality
Appendix B Complete Experimental Results
Table 5. Complete evaluation results on SWE-Bench Mobile. Task Success measures the percentage of tasks where all test cases pass (out of 50 tasks). Test Pass measures the percentage of individual test cases passed (out of 449 tests). Best results per agent in bold.
| Agent | Model | Task Success (%) | Test Pass (%) | Cost ($/task) | Time (min) |
| --- | --- | --- | --- | --- | --- |
| Cursor | Claude Opus 4.5 | 12.0 | 28.1 | 3.50 | 15.0 |
| Claude Sonnet 4.5 | 12.0 | 26.7 | 2.00 | 14.2 | |
| GPT-5.2 | 8.0 | 27.4 | 1.80 | 20.0 | |
| Gemini 3 Pro | 6.0 | 23.2 | 1.00 | 12.5 | |
| GPT-5.1 | 2.0 | 19.6 | 1.10 | 14.2 | |
| Codex | GLM-4.6 | 12.0 | 19.6 | 1.30 | 13.3 |
| Claude Sonnet 4.5 | 10.0 | 28.1 | 2.50 | 12.5 | |
| GPT-5 | 10.0 | 21.4 | 1.50 | 10.0 | |
| Claude Opus 4.5 | 4.0 | 20.7 | 3.50 | 14.2 | |
| GPT-5.1 | 0.0 | 7.1 | 1.00 | 13.3 | |
| Claude Code | GLM-4.6 | 10.0 | 26.7 | 1.30 | 11.7 |
| Claude Sonnet 4.5 | 10.0 | 24.7 | 2.00 | 13.3 | |
| Claude Opus 4.5 | 8.0 | 21.8 | 4.00 | 15.0 | |
| Claude Haiku | 8.0 | 18.3 | 0.50 | 8.3 | |
| OpenCode | GLM-4.6 | 8.0 | 17.8 | 0.13 | 32.5 |
| GPT-5.1 | 6.0 | 7.1 | 0.02 | 2.0 | |
| Claude Sonnet 4.5 | 4.0 | 14.7 | 3.50 | 11.1 | |
| GLM-4.7 | 4.0 | 14.3 | 0.49 | 52.1 | |
| Gemini 3 Pro | 4.0 | 13.4 | 0.03 | 8.9 | |
| GPT-5.2 | 4.0 | 12.0 | 0.04 | 10.9 | |
| Claude Opus 4.5 | 2.0 | 12.0 | 9.33 | 8.2 | |
| GPT-5 | 2.0 | 12.0 | 0.18 | 9.8 | |
B.1. Cross-Agent Model Comparison
Table 6 reveals that the same model can perform very differently across agents, highlighting the importance of agent design.
Table 6. Same model, different agents: Task Success Rate (%). The gap between best and worst agent can be as large as 6 $×$ .
| Model | Cursor | Codex | CC | OpenCode | Gap |
| --- | --- | --- | --- | --- | --- |
| Opus 4.5 | 12 | 4 | 8 | 2 | 6 $×$ |
| Sonnet 4.5 | 12 | 10 | 10 | 4 | 3 $×$ |
| GLM-4.6 | — | 12 | 10 | 8 | 1.5 $×$ |
| GPT-5.1 | 2 | 0 | — | 6 | $∞$ |
Appendix C Prompt Templates
We designed 12 prompt variants for the ablation study. Below we present the key prompts. All prompts share a common structure: role definition, task description, and output format. The differentiating factor is the emphasis placed on different aspects.
C.1. Best Prompt: Defensive Programming
P10: Defensive Programming (Best)
“You are a senior iOS engineer known for writing robust, production-ready code. Implement the feature with a focus on defensive programming and edge case handling. Don’t just implement the happy path. Think about everything that could go wrong: •
Empty data, nil values, invalid formats •
Very long/short text, different screen sizes •
Slow network, timeouts, concurrent operations •
First-time user, offline mode, low memory Your code should handle all of this gracefully without crashing.”
C.2. Baseline Prompt
P1: Baseline
“You are an iOS developer. Read the PRD carefully and implement the required changes. Generate a unified diff patch that can be applied to the codebase.”
C.3. Worst Performing Prompts
P12: Comprehensive (Worst)
“You are a senior iOS engineer. Before implementing: (1)
Analyze the PRD thoroughly (2)
Identify all affected files (3)
Plan your implementation strategy (4)
Consider edge cases (5)
Review the Figma design (6)
Check for existing patterns (7)
Implement with tests in mind (8)
Validate against requirements Generate a complete, production-ready patch.”
Why Comprehensive Failed: The overly detailed checklist appears to overwhelm the model, causing it to focus on process rather than actual implementation. Simpler, focused prompts consistently outperform complex ones.
C.4. Other Notable Prompts
P7: Chain of Thought:
Asks the model to “think step by step” before coding. Achieved 10% Task Success but lower Test Pass Rate (21.8%) than Defensive Programming. P9: Figma Emphasis:
Emphasizes matching the Figma design exactly. Surprisingly underperformed (8% Task Success), possibly because many tasks don’t require UI changes. P11: Test Driven:
Asks the model to “think about what tests would verify your implementation.” Achieved only 6% Task Success despite the intuitive appeal of test-driven thinking.
Appendix D Dataset Statistics
We provide detailed statistics of the SWE-Bench Mobile dataset in Table 7. The benchmark consists of 50 tasks with varying levels of complexity, involving multi-modal inputs (PRDs and Figma designs) and a large-scale production codebase. The tasks are designed to cover a wide range of mobile development scenarios, ensuring a comprehensive evaluation of agent capabilities.
Table 7. SWE-Bench Mobile dataset statistics.
| Metric | Value |
| --- | --- |
| Task Composition | |
| Total Tasks | 50 |
| Tasks with Figma Design | 35 (70%) |
| Tasks with Reference Images | 46 (92%) |
| Task Complexity | |
| Avg. PRD Length (words) | 450 |
| Avg. Test Cases per Task | 9.1 |
| Total Test Cases | 449 |
| Avg. Files to Modify | 4.2 |
| Codebase | |
| Programming Language | Swift/Objective-C (iOS) |
| Codebase Size | $\sim$ 500K LoC |
Appendix E Reproducibility
Environment. All experiments were conducted on macOS 14.x with:
- Cursor: v2.3 with Agent mode enabled
- Codex: OpenAI Codex CLI v0.77.0
- Claude Code: Anthropic Claude Code CLI v2.1.37
- OpenCode: v1.1.44 (open-source coding agent)
Model API Configuration.
For reproducibility, we specify the exact API endpoints and configurations used:
- GPT Models (GPT 5, 5.1, 5.2): Accessed via Microsoft Azure OpenAI API with default temperature and top-p settings
- Claude Models (Opus 4.5, Sonnet 4.5, Haiku): Accessed via Google Vertex AI API for Anthropic models
- Gemini 3 Pro: Accessed via Google Vertex AI API with standard configuration
- GLM Models (GLM 4.6, 4.7): Used GLM Coding Plan with default agent scaffolding
Multi-Modal Input Handling.
To handle Figma designs and reference images, we configured Model Context Protocol (MCP) integrations:
- Vision-capable models (GPT, Claude, Gemini): Used official Figma MCP to directly access design specifications
- GLM Models: Since GLM 4.6 is not a native vision model, we used the official GLM Vision MCP to process images and Figma designs, converting visual inputs into structured descriptions for the text-only model
Evaluation Pipeline.
1. Load generated patch file as text
1. Run task-specific pytest test suite (tests inspect the patch diff text using pattern matching and structural analysis)
1. Record pass/fail status for each test case
1. Aggregate results across all 50 tasks
Availability and Hosted Evaluation. The SWE-Bench Mobile benchmark is derived from a proprietary production codebase with permission from XiaoHongShu Inc. Due to the confidential nature of the source code and product requirements, the full dataset cannot be publicly released. We view this constraint as a feature rather than a limitation: by keeping the test set private, we eliminate the risk of data contamination —a well-known issue with public benchmarks where test instances may leak into LLM training corpora (Jimenez et al., 2024).
SWE-Bench Mobile is designed as a standardized evaluation platform for coding agent providers and foundation model vendors. We host a public leaderboard at https://swebenchmobile.com where agent companies (e.g., Cursor, Codex, Claude Code) and model providers (e.g., OpenAI, Anthropic, Google, Zhipu AI) can submit their systems for evaluation against our held-out industrial test suite. This provides an objective, contamination-free comparison on real-world mobile development tasks that complements existing Python-centric benchmarks. Submission guidelines and evaluation configurations are available at https://github.com/realtmxi/mobile-bench.
Appendix F Task Design Mockups
Figure 9 shows the design mockups provided to agents for Task 003 (Custom Emoji Limit). These real-world screenshots demonstrate the user pain point and expected UI behavior that agents must understand to implement the feature correctly.
<details>
<summary>figures/fig_mockup_001.jpg Details</summary>

### Visual Description
## Social Media Post: Question about Emoji Limits
### Overview
The image is a screenshot of a social media post, likely from a platform like Weibo or a similar Chinese social media site. The post asks a question about emoji limits on the Xiaohongshu platform (Little Red Book). Several comments are visible below the main post.
### Components/Axes
* **Header:** Contains the user's profile picture and username "一条鱼W" (Yī tiáo yú W, meaning "A Fish W"). There is also a "关注" (Guānzhù, meaning "Follow") button.
* **Main Post:**
* Text: "表情包上限太多了" (Biǎoqíng bāo shàngxiàn tài duō le, meaning "The emoji limit is too high").
* Question: "我想问一下, 要是小红书表情包上线太多, 无法添加表情, 该怎么办?" (Wǒ xiǎng wèn yīxià, yàoshi Xiǎohóngshū biǎoqíng bāo shàngxiàn tài duō, wúfǎ tiānjiā biǎoqíng, gāi zěnme bàn?, meaning "I want to ask, if the Xiaohongshu emoji limit is too high and I can't add emojis, what should I do?").
* Hashtag: "#用一句话迎接五月" (#Yòng yījù huà yíngjiē wǔ yuè, meaning "#Welcome May in one sentence").
* Date: 2024-05-04
* Comment Count: "共40条评论" (Gòng 40 tiáo pínglùn, meaning "Total of 40 comments").
* **Comments Section:** Contains several user comments.
* Comment 1:
* Username: "憶宅^."
* Comment: "我没有表情包但是显示表情包上线太多" (Wǒ méiyǒu biǎoqíng bāo dànshì xiǎnshì biǎoqíng bāo shàngxiàn tài duō, meaning "I don't have emojis, but it shows that the emoji limit is too high"). Includes an emoji.
* Date: 02-08
* Likes: 9
* Dislikes: 0
* Replies: 5
* Comment 2:
* Username: "一条鱼W" (author)
* Comment: "泥..." (Ní..., meaning "Mud..."). Includes an emoji.
* Date: 02-08
* Likes: 3
* Replies: 0
* "展开4条回复" (Zhǎnkāi 4 tiáo huífù, meaning "Expand 4 replies")
* Comment 3:
* Username: "治愈宝宝 朱丽叶吉安娜"
* Comment: "有300个吗,根本不够用" (Yǒu 300 gè ma, gēnběn bù gòuyòng, meaning "Are there 300? It's not enough at all"). Includes an image.
* **Bottom Section:**
* Input field: "说点什么..." (Shuō diǎn shénme..., meaning "Say something...")
* Like Count: 50
* Star Count: 10
* Comment Count: 40
* Share Icon
### Detailed Analysis or ### Content Details
The main post is a question about a potential issue on Xiaohongshu where users are unable to add emojis because the system indicates that the emoji limit has been reached. The comments suggest that other users are experiencing similar problems.
### Key Observations
* The user "一条鱼W" is seeking help or clarification regarding emoji limits on Xiaohongshu.
* Other users are confirming that they are also experiencing issues with emoji limits.
* The comments indicate that the problem might be related to the platform's emoji management system.
### Interpretation
The social media post highlights a potential usability issue on the Xiaohongshu platform related to emoji limits. The user's question and the subsequent comments suggest that the platform may be incorrectly reporting or enforcing emoji limits, preventing users from adding emojis even when they haven't reached the actual limit. This could be a bug or a design flaw in the platform's emoji management system. The comments also reveal that users are actively discussing and seeking solutions to this problem within the Xiaohongshu community.
</details>
(a) User Complaint. Social media post showing frustration with the 300-emoji limit: “Xiaohongshu’s emoji limit is too high, I can’t add more emojis.”
<details>
<summary>figures/fig_mockup_002.jpg Details</summary>

### Visual Description
## Screenshot: Social Media Post
### Overview
The image is a screenshot of a social media post, likely from a platform like Xiaohongshu (Little Red Book). The post contains a user's complaint about the limit on saved emoticons, followed by comments from other users.
### Components/Axes
* **Header:** Contains the user's profile picture and a "关注" (Follow) button.
* **Main Post:** Includes the user's text, date, and location.
* **Comments Section:** Displays comments from other users.
* **Footer:** Contains interaction buttons (like, save, share) and a text input field.
### Detailed Analysis or ### Content Details
**Main Post Text (Chinese with English Translation):**
* Original Text: "小红书能不能取消表情包收藏上限呀?"
* Translation: "Xiaohongshu, can you remove the limit on saved emoticons?"
* Additional Text: "遇到喜欢的表情包我就收藏,看一个见一个爱一个,爱一个收一个,逐渐达到表情包收藏上限。看到新的喜欢的表情包,还是忍不住收藏,但是他已经达到上限了,每次我都只能忍痛放弃,实在喜欢的话就去表情包收藏里面挑挑拣拣的删掉一个相比之下不怎么喜欢的。心痛,哦,太心痛了#表情包#小红书 #收藏上限 #表情包分享 #分享 #喜欢 #停不下来"
* Translation: "Whenever I encounter a favorite emoticon, I save it. I love every one I see, and I save them one by one, gradually reaching the limit on saved emoticons. When I see new favorite emoticons, I can't help but save them, but I've already reached the limit. Every time, I can only painfully give up. If I really like it, I go to my saved emoticons and painstakingly delete one that I don't like as much. It's heartbreaking, oh, so heartbreaking. #emoticon #xiaohongshu #collectionlimit #emoticonshare #share #like #cantstop"
* Date and Location: "02-14 广西" (February 14, Guangxi)
**Comments Section:**
* Comment 1:
* User: "鱼啊鱼你係边"
* Translation (Cantonese): "Fish, fish, where are you?"
* Includes a small image with the text "什么!?" (What!?)
* Comment 2:
* Includes an image of a cat with text overlayed: "发疯" (Crazy), "啊!" (Ah!), "啊!!" (Ah!!).
* Date: "4天前 广东" (4 days ago, Guangdong)
**Footer:**
* Text Input Field: "说点什么..." (Say something...)
* Interaction Buttons:
* Like: 9
* Save: 收藏 (Number not clear, but present)
* Share: 2
**Highlighted Text:**
* The text "小红书能不能 取消表情包 收藏上限呀?" is circled in orange.
### Key Observations
* The user is frustrated with the limit on saved emoticons on Xiaohongshu.
* The comments show other users engaging with the post, with one comment using Cantonese.
* The highlighted text emphasizes the user's main question.
### Interpretation
The post reflects a common user experience on social media platforms where users accumulate saved items and eventually reach storage limits. The user's frustration is relatable, and the comments indicate that others may share the same issue. The highlighting of the question suggests that the user wants to draw attention to the problem and potentially prompt a response from the platform. The comments add a layer of engagement and humor to the post.
</details>
(b) Community Feedback. Another user asking “Can Xiaohongshu remove the emoji collection limit?” showing widespread user demand.
<details>
<summary>figures/fig_mockup_003.jpg Details</summary>
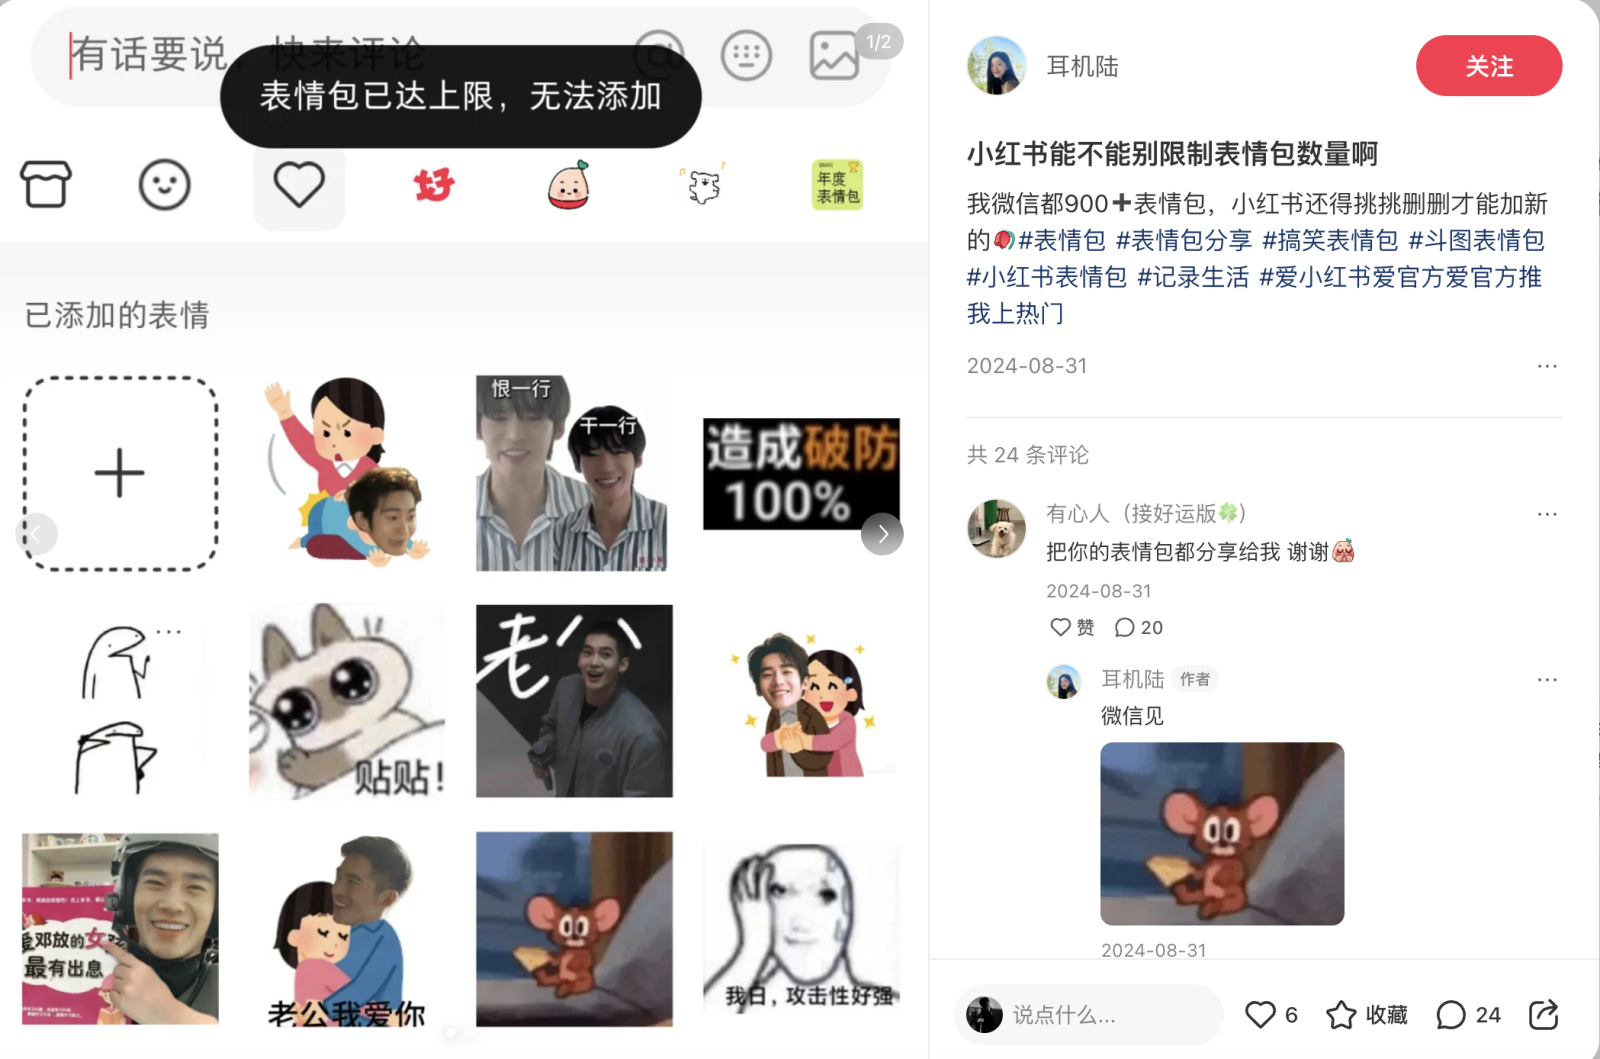
### Visual Description
## Screenshot: Social Media Post
### Overview
The image is a screenshot of a social media post, likely from a platform like Xiaohongshu (Little Red Book). It shows a user's post complaining about the platform's limitations on the number of emojis that can be added. The post includes a collection of emojis the user has added, along with comments and interactions.
### Components/Axes
* **Header:** Contains the post author's username "耳机陆" (Erji Lu), a "关注" (Follow) button, and a page indicator "1/2".
* **Post Content:** Includes the main text of the post, hashtags, and the date "2024-08-31".
* **Emoji Collection:** Displays a grid of emojis that the user has added.
* **Comments Section:** Shows comments from other users, including usernames, comment text, dates, and interaction buttons (like, comment, share).
* **Footer:** Contains input field "说点什么..." (Say something...), and interaction buttons (like, save, comment).
### Detailed Analysis or Content Details
**Header:**
* Username: 耳机陆 (Erji Lu)
* Button: 关注 (guānzhù) - Follow
* Page Indicator: 1/2
**Post Content:**
* Text: 小红书能不能别限制表情包数量啊 (Xiǎohóngshū néng bùnéng bié xiànzhì biǎoqíng bāo shùliàng a) - "Can Xiaohongshu please stop limiting the number of emojis?"
* Text: 我微信都900+表情包, 小红书还得挑挑删删才能加新的 (Wǒ wēixìn dōu 900+ biǎoqíng bāo, xiǎohóngshū hái dé tiāotiāo shānshān cáinéng jiā xīn de) - "I have 900+ emojis on WeChat, and I still have to pick and choose to add new ones on Xiaohongshu."
* Hashtags: #表情包 (biǎoqíng bāo) - Emoji, #表情包分享 (biǎoqíng bāo fēnxiǎng) - Emoji sharing, #搞笑表情包 (gǎoxiào biǎoqíng bāo) - Funny emoji, #斗图表情包 (dòu tú biǎoqíng bāo) - Meme emoji, #小红书表情包 (xiǎohóngshū biǎoqíng bāo) - Xiaohongshu emoji, #记录生活 (jìlù shēnghuó) - Record life, #爱小红书爱官方爱官方推我上热门 (ài xiǎohóngshū ài guānfāng ài guānfāng tuī wǒ shàng热门) - Love Xiaohongshu, love the official account, love the official account pushing me to the top.
* Date: 2024-08-31
**Emoji Collection:**
The emoji collection is displayed in a grid format. Here's a description of each emoji, reading from left to right, top to bottom:
1. A plus sign "+" inside a dashed square, presumably for adding new emojis.
2. A cartoon image of a woman hitting a man's head.
3. Two men standing next to each other. Text: 恨一行 (hèn yīxíng) - Hate a line.
4. A stick figure drawing.
5. A cartoon cat with large eyes. Text: 贴贴! (tiē tiē!) - Stick together!
6. A man smiling. Text: 老八 (lǎo bā) - Old Eight.
7. A man holding a sign. Text: 爱邓放的女孩最有出息 (ài dèng fàng de nǚhái zuì yǒu chūxī) - Girls who love Deng Fang are the most promising.
8. A man hugging a girl. Text: 老公我爱你 (lǎogōng wǒ ài nǐ) - Husband, I love you.
9. A cartoon mouse holding cheese.
10. A man with a surprised expression. Text: 我日, 攻击性好强 (wǒ rì, gōngjí xìng hǎo qiáng) - Damn, so aggressive.
11. A sticker with the text "造成破防 100%" (zàochéng pò fáng 100%) - Cause defense break 100%.
**Comments Section:**
* Total Comments: 共 24 条评论 (gòng 24 tiáo pínglùn) - Total 24 comments
* Comment 1:
* Username: 有心人 (接好运版) (yǒuxīnrén (jiē hǎo yùn bǎn)) - Kind person (Receive good luck version)
* Comment: 把你的表情包都分享给我谢谢 (bǎ nǐ de biǎoqíng bāo dōu fēnxiǎng gěi wǒ xièxiè) - Share all your emojis with me, thank you.
* Date: 2024-08-31
* Likes: 赞 20 (zàn 20) - Like 20
* Comment 2:
* Username: 耳机陆 作者 (ěrjī lù zuòzhě) - Erji Lu Author
* Comment: 微信见 (wēixìn jiàn) - See you on WeChat
* Date: 2024-08-31
**Footer:**
* Input Field: 说点什么... (shuō diǎn shénme...) - Say something...
* Interaction Buttons:
* Like: 6
* Save: (Unclear number)
* Comment: 24
**Overlay Text:**
* 有话要说 快来评论 (yǒu huà yào shuō kuài lái pínglùn) - Have something to say? Come comment!
* 表情包已达上限, 无法添加 (biǎoqíng bāo yǐ dá shàngxiàn, wúfǎ tiānjiā) - The emoji pack has reached the limit and cannot be added.
### Key Observations
* The user is frustrated with the emoji limit on Xiaohongshu.
* The user has a large collection of emojis, as indicated by the "900+" on WeChat.
* The emojis are a mix of popular memes, personal photos, and expressions.
* Other users are engaging with the post, asking the user to share their emojis.
### Interpretation
The screenshot highlights a common user frustration with social media platforms: limitations on customization and expression. The user's post resonates with others who likely experience the same issue, as evidenced by the comments and interactions. The variety of emojis in the user's collection suggests a desire for diverse and personalized communication, which is hindered by the platform's restrictions. The post also demonstrates the importance of emojis in online communication and the desire for users to express themselves creatively.
</details>
(c) Emoji Collection UI. The sticker collection interface with warning dialog “Emoji limit reached, cannot add more.” Agents must increase this limit from 300 to 999.
Figure 9. Design mockups for Task 003 (Custom Emoji Limit). These mockups are provided to agents as part of the PRD to guide implementation. They show real user complaints about the 300-emoji limit and the current UI that needs modification.
Appendix G Qualitative Analysis of Agent Outputs
We present detailed analyses of agent-generated patches to provide insights into both successful implementations and common failure modes. These examples illustrate the practical challenges agents face when implementing features from PRDs and Figma designs in a production codebase.
Table 8. Successful implementation by Cursor + GPT-5.2 on Task 007 (Medium difficulty). The agent correctly created the AppRefMessageDataService class with all required fields and methods, demonstrating strong architectural understanding.
| Task Context |
| --- |
| Difficulty: Medium Files to Modify: 5 Category: Architecture Refactoring |
| Agent: Cursor + GPT-5.2 Result: ✓ PASS (5/5 tests) |
| Problem Statement (Summary) |
| Decouple card message click handling from AppChatBaseViewController by abstracting logic into CardRefBaseProvider. The click logic for card references should be moved to a new AppRefMessageDataService class following the provider pattern. |
| Key Requirements |
| •
Create AppRefMessageDataService class with fields: chatType, chatId, senderId, messageId, sender, innerContentDict •
Move click handling out of view controller •
Implement provider pattern for different card types •
Support shopping and advertisement cards |
| Generated Patch (Key Excerpts) |