# A Note on TurboQuant and the Earlier DRIVE/EDEN Line of Work
**Authors**: Ran Ben-BasatYaniv Ben-ItzhakGal MendelsonUCL and BroadcomVMware Research by BroadcomNorth Carolina State UniversityMichael MitzenmacherAmit PortnoyShay VargaftikHarvard UniversityMicrosoftVMware Research by Broadcom
## Abstract
This note clarifies the relationship between the recent TurboQuant work and the earlier DRIVE (NeurIPS 2021) and EDEN (ICML 2022) schemes. DRIVE is a 1-bit quantizer that EDEN extended to any $b>0$ bits per coordinate; we refer to them collectively as EDEN.
First, TurboQuant ${}_mse$ is a special case of EDEN obtained by fixing EDEN’s scalar scale parameter to $S=1$ . EDEN supports both biased and unbiased quantization, each optimized by a different $S$ (chosen via methods described in the EDEN works). The fixed choice $S=1$ used by TurboQuant is generally suboptimal, although the optimal $S$ for biased EDEN converges to $1$ as the dimension grows; accordingly TurboQuant ${}_mse$ approaches EDEN’s behavior for large $d$ .
Second, TurboQuant ${}_prod$ combines a biased $(b-1)$ -bit EDEN step with an unbiased 1-bit QJL quantization of the residual. It is suboptimal in three ways: (1) its $(b-1)$ -bit step uses the suboptimal $S=1$ ; (2) its 1-bit unbiased residual quantization has worse MSE than (unbiased) 1-bit EDEN; (3) chaining a biased $(b-1)$ -bit step with a 1-bit unbiased residual step is inferior to unbiasedly quantizing the input directly with $b$ -bit EDEN.
Third, some of the analysis in the TurboQuant work mirrors that of the EDEN works: both exploit the connection between random rotations and the shifted Beta distribution, use the Lloyd-Max algorithm, and note that Randomized Hadamard Transforms can replace uniform random rotations.
Experiments support these claims: biased EDEN (with optimized $S$ ) is more accurate than TurboQuant ${}_mse$ , and unbiased EDEN is markedly more accurate than TurboQuant ${}_prod$ , often by more than a bit (e.g., 2-bit EDEN beats 3-bit TurboQuant ${}_prod$ ). We also repeat all accuracy experiments from the TurboQuant paper, showing that EDEN outperforms it in every setup we have tried.
## 1 Introduction
On March 24, 2026, Google publicly highlighted TurboQuant [12], their recently accepted ICLR 2026 paper, as a breakthrough in AI memory efficiency in an official blog post [14, 12]. That public framing quickly spilled into financial coverage. Investing.com, carrying Reuters credit, reported on March 25, 2026 that Samsung Electronics fell 4.8% and SK Hynix 5.9%, while U.S.-listed memory peers Micron, SanDisk, Western Digital, and Seagate fell between 3% and 6% [11]. Seoul Economic Daily likewise covered the March 26–27, 2026 selloff and linked it to concerns that lower AI memory requirements could reduce future demand for advanced memory chips, while also reporting the counterargument that cheaper AI may expand overall demand over time [5, 7].
However, as we explain in this note, the TurboQuant ${}_\texttt{mse}$ algorithm is a suboptimal special case of the biased variant of the EDEN EDEN was also contributed to Intel’s OpenFL [6, 10] in 2022. algorithm from ICML 2022, and the unbiased variant of EDEN has better accuracy than that of the unbiased variant TurboQuant ${}_prod$ . We also show that much of the analysis used in TurboQuant previously appeared in the DRIVE [8] and EDEN [9] papers (which we collectively refer to as EDEN) and conduct experiments to empirically compare the algorithms. We note that the authors of the RaBitQ [3] paper have expressed similar concerns (e.g., [4]) regarding their paper; EDEN and DRIVE also predate the RaBitQ work, which we have recently communicated to the RaBitQ authors. Here, we focus on comparing TurboQuant and EDEN. We hope that demonstrating the advantages of using EDEN will support its continued adoption in emerging systems more rapidly.
## 2 Preliminaries
We use $x∈ℝ^d$ for the input vector, and we write $Q$ and $Q^-1$ for the quantization and dequantization maps. Following EDEN, we also use $η_x:=\frac{√{d}}{\|x\|_2},$ so that $η_xR(x)$ has coordinates on the standard-normal scale after rotation. TurboQuant formulates the reconstruction objective through the mean-squared distortion $D_mse:=E\|x-Q^-1(Q(x))\|_2^2$ and the inner-product distortion $D_prod:=E|⟨ y,x⟩-⟨ y,Q^-1(Q(x))⟩|^2$ in, equations (1)-(2) [12]. EDEN [9] utilizes the vector-normalized mean-squared error $vNMSE:=E\|x-\hat{x}\|_2^2/\|x\|_2^2$ . These are the same normalization conventions we use throughout this note.
The common geometric setup is also the same. After a uniform random rotation, the coordinates become identically distributed. The DRIVE paper [8, Lemma 8, Appendix A.4 of the supplemental material] further explains that the exact distribution of each coordinate with finite $d$ is a shifted Beta distribution that rapidly approaches a normal distribution as $d$ increases [9]. TurboQuant finds the same coordinate distribution in Lemma 1 [12].
### Biased and Unbiased Scales in EDEN
The key distinction for the present note is the choice of reconstruction scale. EDEN’s unbiased scale is introduced in Theorem 2.1: for
$$
S_unb(x,R)=\frac{\|x\|_2^2}{⟨ R(x),Q(η_xR(x))⟩},
$$
EDEN proves $E[\hat{x}]=x$ [9]. EDEN then proves a corresponding vNMSE bound in Theorem 2.3 and its asymptotic form in Corollary 2.4.
One can alternatively choose the scale factor to minimize the distortion, without the unbiasedness constraint, by setting
$$
S_bias(x,R)=\frac{⟨ R(x),Q(η_xR(x))⟩}{\|Q(η_xR(x))\|_2^2}.
$$
With this setting, $\hat{x}=S_bias(x,R)R^-1Q(η_xR(x))$ is the best scalar rescaling of the chosen codeword in squared error. For the one-bit precursor DRIVE, this dichotomy is explicit: Lemma 1 and Theorem 2 analyze the MSE-minimizing scale, while Theorem 3, Theorem 4, and Corollary 1 on analyze the unbiased scale and its distributed-mean-estimation consequences [8]. EDEN generalizes this picture to arbitrary bitwidths: Section 3 chooses the Lloyd–Max quantizer that minimizes scalar MSE, while Section 2.3 and Corollary 2.4 explain how to combine the same scalar quantizer with the unbiased scale [9]. This is exactly the distinction that matters for TurboQuant: TurboQuant ${}_\texttt{mse}$ uses a fixed choice $S=1$ that is biased, whereas EDEN shows that an appropriate choice of scale leads to an unbiased result, and further shows how to choose a (different) optimal $S$ for biased results.
## 3 TurboQuant ${}_\texttt{mse}$ as EDEN with $S=1$
Our first observation concerns the MSE-oriented TurboQuant construction. Viewed through the EDEN parametrization, TurboQuant ${}_\texttt{mse}$ corresponds to the special case obtained by fixing the EDEN scale parameter to $S=1$ .
To make this relationship explicit, Figure 1 shows a unified pseudocode for TurboQuant ${}_\texttt{mse}$ and (both biased and unbiased) EDEN. Relative to the notation of Section 2, the figure writes the dequantized rotated codeword in the same scale as the rotated vector, namely
$$
q:=Q(η_xy)/η_x.
$$
In this normalization, the common structure is especially transparent: rotate, quantize coordinates, apply the inverse rotation, and reconstruct. The three methods differ only in their choice of the final reconstruction scale $S$ : TurboQuant ${}_\texttt{mse}$ fixes $S=1$ , EDEN-biased uses the MSE-minimizing scalar, and EDEN-unbiased uses the unbiased scalar from Figure 1 of [9].
The scalar quantizers themselves also coincide. For the one-bit case, the same two-point reconstruction is already explicit in DRIVE: Algorithm 1 reconstructs with values in $\{± S\}$ , and Lemma 1 gives the biased MSE-minimizing scale explicitly as $S_bias=\frac{\|R(x)\|_1}{d},$ so the one-bit DRIVE reconstruction levels are exactly $\{±\|R(x)\|_1/d\}$ [8, Lemma 1]. EDEN Section 3, specifically Example 1 and Example 2, gives the standard-normal Lloyd–Max codebooks $QI_1≈\{± 0.79788\}$ and $QI_2≈\{± 0.45278,± 1.51042\}$ [9]. TurboQuant (Section 3.1 and Algorithm 1) lists the same centroids, up to the paper’s $√{d}$ normalization. For $b=1$ it uses $±√{2/π}/√{d}$ , and for $b=2$ it uses $\{± 0.453/√{d},± 1.51/√{d}\}$ [12].
Further to these similarities, we note that the analysis of EDEN provides tighter bounds. For example, for $b=1$ , DRIVE shows [8, Theorem 2] that the vNMSE is exactly $(1-2/π)(1-1/d)$ , which is bounded by $1-2/π≈ 0.363$ . TurboQuant proved [12, Theorem 1] that $D_mse≤\frac{√{3}π}{2}·\frac{1}{4^b}$ , which gives $√{3}π/8≈ 0.68$ for $b=1$ . The authors mention [12, Theorem 1] that for $b=1$ , $D_mse≈ 0.36$ , but this is not proven and seems to be based on empirical observation.
As mentioned, these results are derived from the fact that the coordinate distribution after rotation, whose analysis also appears in the DRIVE paper [8, Lemma 8, Appendix A.4 of the supplemental material], follows a shifted Beta distribution (which converges to a normal distribution as the dimension grows large).
TurboQuant ${}_\texttt{mse}$ /EDEN pseudocode Setup 1. Generate the shared random rotation matrix $Π$ . 2. Construct the Lloyd–Max centroid codebook $c_1,\dots,c_2^b$ for the rotated coordinates. Quantize 3. Compute $y←Π x$ . 4. For each $j∈[d]$ , set $idx_j←\arg\min_k∈[2^b]|y_j-c_k|$ . 5. Set $q_j← c_idx_j$ for each $j∈[d]$ . 6. Choose the reconstruction scale $S$ . 7. Send $(q,S)$ . Dequantize 8. Regenerate $Π$ from the same seed. 9. Output $\hat{x}← SΠ^⊤q$ . Relevant choices of $S$ 10. TurboQuant ${}_\texttt{mse}$ : $S← 1$ . 11. EDEN-biased: $S←⟨ y,q⟩/\lVert q\rVert_2^2$ . 12. EDEN-unbiased: $S←\lVert x\rVert_2^2/⟨ y,q⟩$ .
Figure 1: Unified TurboQuant ${}_\texttt{mse}$ /EDEN pseudocode. This presentation is written in the rotated-codeword scale $q=Q(η_xy)/η_x$ , so the difference between the three methods is entirely in the reconstruction factor $S$ . Fixing $S=1$ recovers TurboQuant ${}_\texttt{mse}$ , while the two choices of $S$ recover EDEN-biased and EDEN-unbiased.
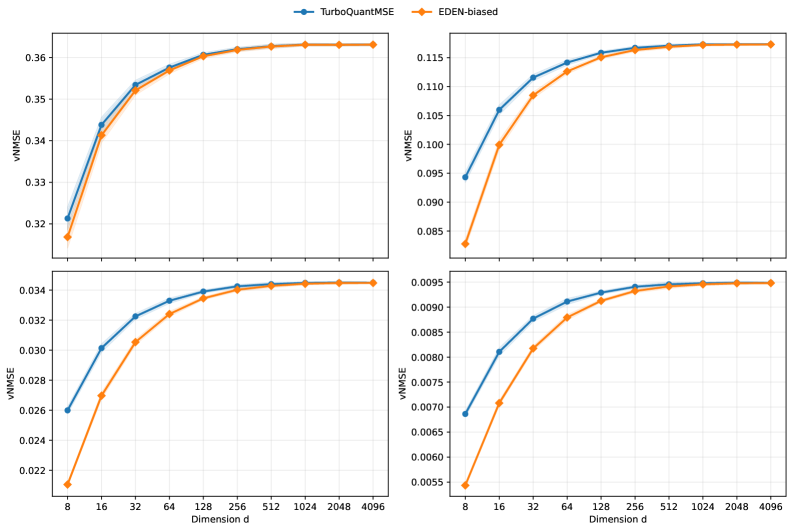
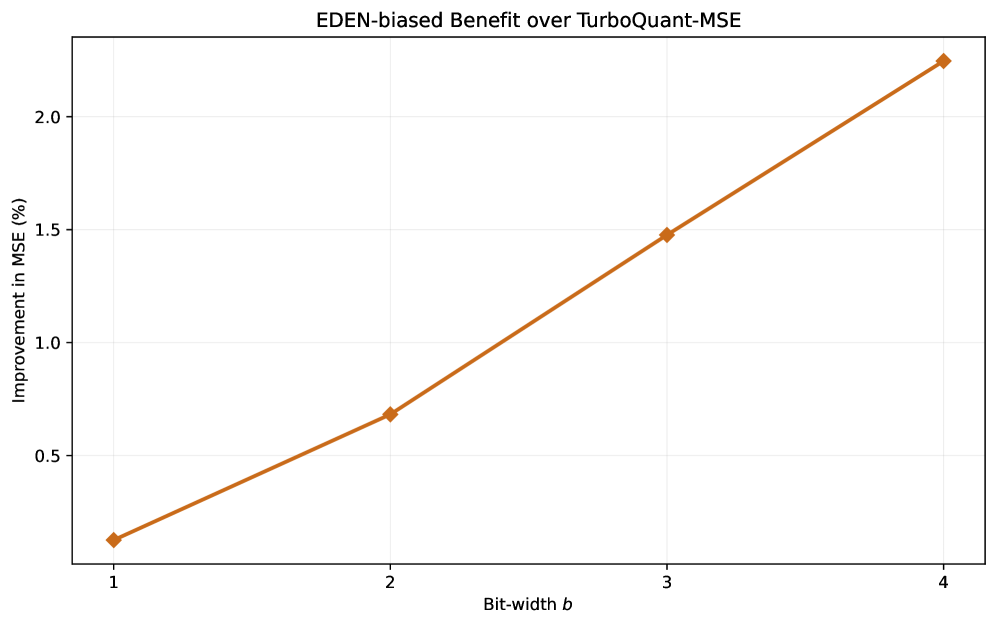
Correspondingly, once Figure 1 is written in this unified form, the empirical behavior is exactly what one should expect. Fixing $S=1$ in TurboQuant ${}_\texttt{mse}$ performs less well than the biased version of EDEN (hereafter referred to as EDEN-biased), which chooses the scale to minimize the resulting distortion. Figure 2 shows this comparison across dimensions and bitwidths. Figure 3 further shows the accuracy gap across bitwidth for a specific $d=128$ dimension.
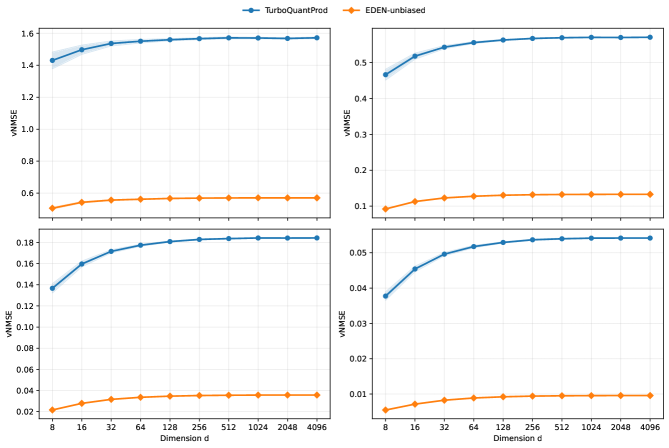
For Figures 2, 4, and 5, each plotted point is the mean over paired repetitions using the same lognormal sample seed and the same quantizer seed across the compared methods. We note that the actual input distribution is irrelevant here as the algorithms randomly rotate the input. The displayed $95\$ confidence intervals are $1.96 s/√{n}$ , where $s$ is the sample standard deviation of the per-pair metric and $n$ is the number of paired seeds for that dimension. In these sweeps, $n=256$ for $d≤ 128$ , $n=128$ for $d=256$ , $n=64$ for $d∈\{512,1024\}$ , $n=32$ for $d=2048$ , and $n=16$ for $d=4096$ .
Across all plotted bitwidths and dimensions, the EDEN-biased curve lies below the TurboQuant ${}_\texttt{mse}$ curve. The gap is most visible in lower dimensions, but it remains throughout the displayed range. In large dimensions, for EDEN-biased $S$ does converge to 1, and correspondingly we see TurboQuant ${}_\texttt{mse}$ does approach EDEN-biased performance for larger dimension.
<details>
<summary>2604.18555v1/x1.png Details</summary>
### Visual Description
## Line Graphs: vNMSE vs Dimension d for TurboQuantMSE and EDEN-biased
### Overview
The image contains four line graphs arranged in a 2x2 grid, comparing the vNMSE (Variance of Normalized Mean Squared Error) performance of two methods: **TurboQuantMSE** (blue line) and **EDEN-biased** (orange line) across different dimensions (d). Each graph represents a distinct scenario or parameter setting, with y-axis ranges varying by graph.
---
### Components/Axes
- **X-axis**: Labeled "Dimension d", with values: 8, 16, 32, 64, 128, 256, 512, 1024, 2048, 4096 (exponential scaling).
- **Y-axis**: Labeled "vNMSE", with ranges specific to each graph:
- Top-left: 0.32–0.36
- Top-right: 0.085–0.115
- Bottom-left: 0.022–0.034
- Bottom-right: 0.0055–0.0095
- **Legends**: Positioned at the top of each graph. Blue = TurboQuantMSE, Orange = EDEN-biased.
---
### Detailed Analysis
#### Top-left Graph (y-axis: 0.32–0.36)
- **Trend**: Both lines start near 0.32 at d=8. TurboQuantMSE (blue) rises sharply to ~0.36 by d=16, while EDEN-biased (orange) increases more gradually, reaching ~0.355 by d=4096. The gap narrows as d increases.
- **Key Points**:
- d=8: TurboQuantMSE ≈ 0.322, EDEN-biased ≈ 0.315
- d=4096: Both ≈ 0.36
#### Top-right Graph (y-axis: 0.085–0.115)
- **Trend**: TurboQuantMSE starts at ~0.095 (d=8) and rises to ~0.115 (d=4096). EDEN-biased begins lower (~0.085) and converges to ~0.114 by d=4096.
- **Key Points**:
- d=8: TurboQuantMSE ≈ 0.095, EDEN-biased ≈ 0.085
- d=4096: TurboQuantMSE ≈ 0.115, EDEN-biased ≈ 0.114
#### Bottom-left Graph (y-axis: 0.022–0.034)
- **Trend**: TurboQuantMSE starts at ~0.026 (d=8) and increases to ~0.034 (d=4096). EDEN-biased begins lower (~0.022) and rises to ~0.033 by d=4096.
- **Key Points**:
- d=8: TurboQuantMSE ≈ 0.026, EDEN-biased ≈ 0.022
- d=4096: TurboQuantMSE ≈ 0.034, EDEN-biased ≈ 0.033
#### Bottom-right Graph (y-axis: 0.0055–0.0095)
- **Trend**: TurboQuantMSE starts at ~0.0065 (d=8) and rises to ~0.0095 (d=4096). EDEN-biased begins lower (~0.0055) and converges to ~0.0094 by d=4096.
- **Key Points**:
- d=8: TurboQuantMSE ≈ 0.0065, EDEN-biased ≈ 0.0055
- d=4096: TurboQuantMSE ≈ 0.0095, EDEN-biased ≈ 0.0094
---
### Key Observations
1. **Consistent Performance Gap**: TurboQuantMSE consistently exhibits higher vNMSE than EDEN-biased at lower dimensions (d=8–32), but the gap diminishes as d increases.
2. **Convergence at High Dimensions**: By d=4096, the vNMSE values of both methods are nearly identical across all graphs, suggesting similar performance in high-dimensional spaces.
3. **Scaling Behavior**: Both methods show increasing vNMSE with dimension, but TurboQuantMSE’s growth is more pronounced at lower dimensions.
---
### Interpretation
- **Method Comparison**: TurboQuantMSE may incur higher initial errors or computational costs at lower dimensions, while EDEN-biased performs better in these regimes. However, both methods converge in high-dimensional settings, indicating comparable effectiveness for large-scale problems.
- **Dimensionality Impact**: The graphs highlight the importance of dimension in algorithm selection. For low-dimensional tasks, EDEN-biased might be preferable, but TurboQuantMSE could be viable for high-dimensional applications where the performance gap closes.
- **Anomalies**: No outliers are observed; trends are smooth and consistent across all graphs. The convergence suggests that both methods stabilize in high-dimensional regimes, though TurboQuantMSE’s initial disadvantage persists until d=4096.
</details>
Figure 2: Comparison between TurboQuant ${}_\texttt{mse}$ and EDEN-biased, i.e. EDEN with the MSE-optimized scale, shown as a function of dimension for bitwidths $b∈\{1,2,3,4\}$ . The four panels correspond, from left to right, to $b=1,2,3,4$ .
<details>
<summary>2604.18555v1/x2.png Details</summary>
### Visual Description
## Line Graph: EDEN-biased Benefit over TurboQuant-MSE
### Overview
The image is a line graph illustrating the relationship between bit-width (`b`) and improvement in Mean Squared Error (MSE) percentage when using EDEN-biased methods compared to TurboQuant-MSE. The graph shows a single data series with a consistent upward trend.
---
### Components/Axes
- **Title**: "EDEN-biased Benefit over TurboQuant-MSE" (centered at the top).
- **X-axis**: Labeled "Bit-width _b_" with integer markers at 1, 2, 3, and 4.
- **Y-axis**: Labeled "Improvement in MSE (%)" with a scale from 0.0 to 2.25% in increments of 0.5%.
- **Legend**: Not explicitly visible in the image.
- **Line Style**: Single orange line with diamond-shaped markers.
---
### Detailed Analysis
- **Data Points**:
- At `b = 1`: Improvement ≈ 0.1% (orange diamond at the bottom-left).
- At `b = 2`: Improvement ≈ 0.7% (orange diamond midway up the y-axis).
- At `b = 3`: Improvement ≈ 1.5% (orange diamond near the top of the y-axis).
- At `b = 4`: Improvement ≈ 2.25% (orange diamond at the top-right corner).
- **Trend**: The line exhibits a **linear upward slope**, indicating a proportional increase in MSE improvement as bit-width increases.
---
### Key Observations
1. **Consistent Growth**: The improvement in MSE increases predictably with each increment in bit-width.
2. **No Outliers**: All data points align precisely with the linear trendline.
3. **Scale Utilization**: The y-axis fully utilizes its range (0% to 2.25%), with the final data point reaching the maximum value.
---
### Interpretation
The graph demonstrates that higher bit-widths (`b`) correlate with greater MSE improvement when using EDEN-biased methods over TurboQuant-MSE. The linear relationship suggests that increasing bit-width systematically enhances performance, likely due to improved numerical precision or computational efficiency at higher bit-widths. This trend could inform optimization strategies for systems prioritizing MSE reduction, such as machine learning models or signal processing algorithms. The absence of noise or deviations implies a controlled experimental setup or theoretical derivation.
</details>
Figure 3: Percentage MSE improvement of EDEN-biased over TurboQuant ${}_\texttt{mse}$ on LogNormal (0,1) vectors at fixed dimension $d=128$ , for bitwidths $b=1,2,3,4$ . The relative gain is $0.13\$ , $0.68\$ , $1.48\$ , and $2.25\$ , respectively.
<details>
<summary>2604.18555v1/x3.png Details</summary>
### Visual Description
## Line Chart: vNMSE Performance Comparison Across Dimensions
### Overview
The chart compares the vNMSE (von Neumann Entropy Measure of State) performance of two quantum algorithms, **TurboQuant QJL (1-bit)** and **EDEN-unbiased (1-bit)**, across increasing dimensions (8 to 4096). The y-axis represents vNMSE values, while the x-axis represents computational dimensions. The chart includes a shaded uncertainty region for TurboQuant QJL.
### Components/Axes
- **X-axis (Dimension)**: Logarithmically spaced values: 8, 16, 32, 64, 128, 256, 512, 1024, 2048, 4096.
- **Y-axis (vNMSE)**: Linear scale from 0.4 to 1.6, with increments of 0.2.
- **Legend**:
- **Blue line**: TurboQuant QJL (1-bit)
- **Green line**: EDEN-unbiased (1-bit)
- **Shaded Region**: Uncertainty bounds for TurboQuant QJL (light blue).
### Detailed Analysis
#### TurboQuant QJL (1-bit)
- **Trend**: Starts at ~1.42 (dimension 8) and increases gradually to ~1.58 (dimension 4096), with a shaded uncertainty region that narrows as dimension increases.
- **Key Data Points**:
- Dimension 8: 1.42 ± 0.05 (uncertainty)
- Dimension 16: 1.48 ± 0.04
- Dimension 32: 1.53 ± 0.03
- Dimension 64: 1.55 ± 0.02
- Dimension 128: 1.56 ± 0.02
- Dimension 256: 1.57 ± 0.01
- Dimension 512: 1.58 ± 0.01
- Dimensions 1024–4096: 1.58 ± 0.01 (stable)
#### EDEN-unbiased (1-bit)
- **Trend**: Remains nearly flat across all dimensions, starting at ~0.48 (dimension 8) and stabilizing at ~0.56 (dimension 128 onward).
- **Key Data Points**:
- Dimension 8: 0.48
- Dimension 16: 0.52
- Dimension 32: 0.54
- Dimension 64: 0.55
- Dimension 128: 0.56
- Dimensions 256–4096: 0.56 (no change)
### Key Observations
1. **TurboQuant QJL** exhibits a consistent upward trend in vNMSE as dimension increases, with diminishing uncertainty at higher dimensions.
2. **EDEN-unbiased** maintains a stable, low vNMSE across all dimensions, outperforming TurboQuant QJL by ~1.02 units at maximum dimension.
3. The shaded uncertainty region for TurboQuant QJL decreases in width as dimension increases, suggesting improved confidence in estimates at higher dimensions.
### Interpretation
- **Performance Implications**: EDEN-unbiased demonstrates superior stability and lower error propagation across dimensions, making it more reliable for high-dimensional computations. TurboQuant QJL’s performance degrades slightly with increasing dimension but stabilizes at ~1.58 vNMSE, with reduced uncertainty at larger scales.
- **Uncertainty Analysis**: The narrowing shaded region for TurboQuant QJL indicates that measurement confidence improves as dimensions grow, though its baseline error remains higher than EDEN-unbiased.
- **Algorithmic Insight**: The divergence between the two algorithms suggests fundamental differences in error handling or state representation, with EDEN-unbiased potentially offering a more robust framework for quantum state estimation.
</details>
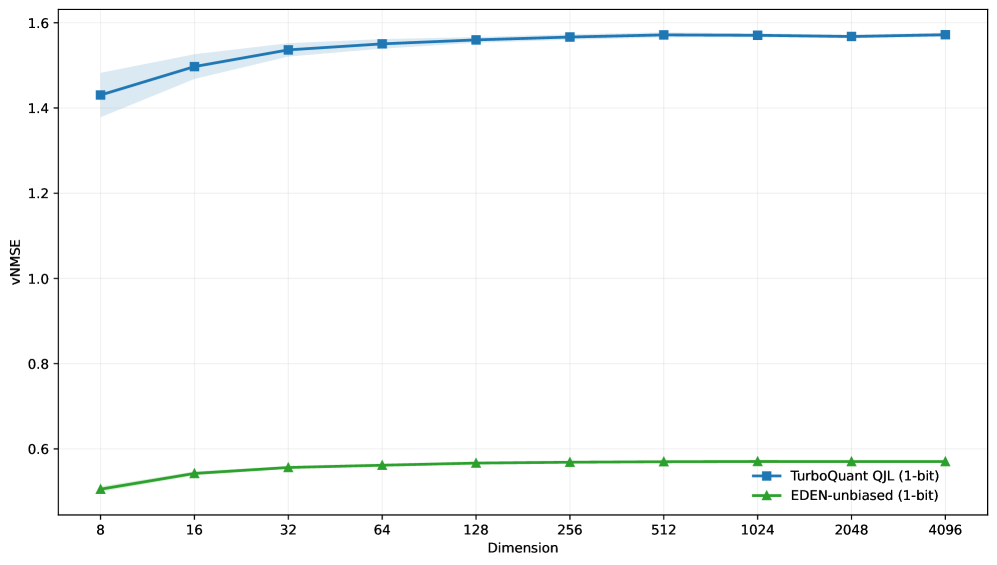
Figure 4: Comparison between the pure one-bit TurboQuant QJL estimator and EDEN-unbiased, shown as a function of dimension. This figure isolates only the one-bit residual-style stage used by TurboQuant ${}_prod$ . Throughout the plotted range, the QJL estimator is substantially weaker than the earlier unbiased DRIVE (e.g., 1-bit EDEN-unbiased) quantizer.
## 4 Unbiased EDEN has better accuracy than TurboQuant ${}_\texttt{prod}$
We now consider the relationship of TurboQuant ${}_prod$ and EDEN.
TurboQuant ${}_prod$ has two logical steps: It first uses TurboQuant ${}_mse$ with $b-1$ bits to quantize the input. Then, it calculates the error (the residual vector) and quantizes it with one bit per coordinate using the Quantized Johnson Lindenstrauss (QJL) method [13].
We find the unbiased variation of EDEN (EDEN-unbiased) outperforms TurboQuant ${}_prod$ . Upon examination, we find TurboQuant ${}_prod$ is suboptimal in several ways.
1. Its first stage uses only $(b-1)$ bits, and that stage is itself just the $S=1$ special case of EDEN rather than the EDEN-biased choice that minimizes MSE for the same codeword.
1. Its second stage uses a one-bit QJL quantization of the residual, and this one-bit estimator is provably and empirically much weaker than the earlier one-bit unbiased DRIVE quantizer (vNMSE for large dimension converges to approximately 0.571 for DRIVE vs 1.57 for QJL).
1. In fact, splitting into a biased quantization with $b-1$ bits followed by a $1$ -bit unbiased quantization is less accurate than using all $b$ bits for unbiased quantization with EDEN.
Figure 5 compares EDEN-unbiased and TurboQuant ${}_prod$ across dimensions and bitwidths. Throughout the plotted range, TurboQuant ${}_prod$ exhibits substantially larger error than the unbiased EDEN baseline. The separation is large for every shown bitwidth, and it remains large as the dimension increases. Notice that the gap is often worth more than a whole bit (e.g., EDEN with 2 bits is more accurate than TurboQuant ${}_prod$ with 3 bits, and with 3 bits EDEN is better than TurboQuant ${}_prod$ with 4 bits).
<details>
<summary>2604.18555v1/x4.png Details</summary>
### Visual Description
## Line Graphs: Comparison of TurboQuantProd and EDEN-unbiased Algorithms
### Overview
The image contains four line graphs arranged in a 2x2 grid, comparing the performance of two algorithms (**TurboQuantProd** and **EDEN-unbiased**) across varying dimensions (`d`). The y-axis measures **vNMSE** (variance-normalized mean squared error), while the x-axis represents computational dimensions (8, 16, 32, ..., 4096). Each graph uses distinct y-axis scales to emphasize performance differences.
---
### Components/Axes
1. **Legends**:
- **Top-right** of each graph:
- **Blue line**: TurboQuantProd
- **Orange line**: EDEN-unbiased
2. **Axes**:
- **X-axis (Horizontal)**:
- Label: "Dimension d"
- Values: 8, 16, 32, 64, 128, 256, 512, 1024, 2048, 4096 (logarithmic spacing).
- **Y-axis (Vertical)**:
- Label: "vNMSE"
- Scales vary per graph:
- Top-left: 0.6–1.6
- Top-right: 0.1–0.5
- Bottom-left: 0.02–0.18
- Bottom-right: 0.01–0.05
---
### Detailed Analysis
#### Top-Left Graph (Scale: 0.6–1.6)
- **TurboQuantProd (Blue)**:
- Starts at ~1.4 (dimension 8), rises to ~1.6 by dimension 16, then plateaus.
- Trend: Slight upward slope initially, then flat.
- **EDEN-unbiased (Orange)**:
- Starts at ~0.5 (dimension 8), rises to ~0.6 by dimension 16, then plateaus.
- Trend: Slight upward slope initially, then flat.
#### Top-Right Graph (Scale: 0.1–0.5)
- **TurboQuantProd (Blue)**:
- Starts at ~0.45 (dimension 8), rises to ~0.5 by dimension 16, then plateaus.
- Trend: Slight upward slope initially, then flat.
- **EDEN-unbiased (Orange)**:
- Starts at ~0.1 (dimension 8), rises to ~0.15 by dimension 16, then plateaus.
- Trend: Slight upward slope initially, then flat.
#### Bottom-Left Graph (Scale: 0.02–0.18)
- **TurboQuantProd (Blue)**:
- Starts at ~0.14 (dimension 8), rises to ~0.18 by dimension 16, then plateaus.
- Trend: Slight upward slope initially, then flat.
- **EDEN-unbiased (Orange)**:
- Starts at ~0.02 (dimension 8), rises to ~0.04 by dimension 16, then plateaus.
- Trend: Slight upward slope initially, then flat.
#### Bottom-Right Graph (Scale: 0.01–0.05)
- **TurboQuantProd (Blue)**:
- Starts at ~0.04 (dimension 8), rises to ~0.05 by dimension 16, then plateaus.
- Trend: Slight upward slope initially, then flat.
- **EDEN-unbiased (Orange)**:
- Starts at ~0.01 (dimension 8), rises to ~0.02 by dimension 16, then plateaus.
- Trend: Slight upward slope initially, then flat.
---
### Key Observations
1. **Consistent Performance Gap**:
- TurboQuantProd consistently exhibits **higher vNMSE** than EDEN-unbiased across all dimensions and scales.
- Example: At dimension 4096, TurboQuantProd’s vNMSE is ~1.6 (top-left) vs. EDEN-unbiased’s ~0.6.
2. **Scalability**:
- Both algorithms show minimal performance degradation as dimension increases, but TurboQuantProd’s error grows more noticeably in higher-scale graphs.
3. **Y-Axis Variability**:
- The differing y-axis ranges suggest the graphs represent distinct metrics or scenarios (e.g., different problem types or error normalization methods).
---
### Interpretation
- **Algorithm Efficiency**:
EDEN-unbiased demonstrates superior accuracy (lower vNMSE) across all tested dimensions, suggesting it is more robust or optimized for the tasks measured.
- **TurboQuantProd Limitations**:
Its higher error rates, especially in higher-dimensional spaces (e.g., 1024–4096), may indicate inefficiencies in handling complexity or overfitting.
- **Practical Implications**:
EDEN-unbiased could be preferred for applications requiring precision at scale, while TurboQuantProd might suffice for simpler, lower-dimensional tasks.
- **Unresolved Questions**:
The differing y-axis scales across graphs warrant clarification—are these separate experiments, or is vNMSE normalized differently?
---
### Spatial Grounding & Verification
- **Legend Placement**: Top-right of each graph, ensuring clarity.
- **Color Consistency**: Blue = TurboQuantProd, Orange = EDEN-unbiased (confirmed across all graphs).
- **Axis Labels**: Explicitly labeled "Dimension d" and "vNMSE" in all cases.
---
### Conclusion
The data underscores EDEN-unbiased’s superiority in minimizing error across computational dimensions, with TurboQuantProd showing diminishing returns as complexity increases. Further investigation into the y-axis normalization and experimental conditions is recommended to contextualize these results.
</details>
Figure 5: Comparison between TurboQuant ${}_prod$ and the unbiased EDEN baseline, shown as a function of dimension for bitwidths $b∈\{1,2,3,4\}$ . The four panels correspond, from left to right, to $b=1,2,3,4$ .
We also note that even if one decides to split the quantization to biased $b-1$ bits followed by unbiased $1$ -bit quantization, it is better to use DRIVE than QJL for this purpose. This is visible directly in Figure 4, which isolates the one-bit residual-style estimator. There, the pure QJL estimator used by TurboQuant ${}_prod$ has much larger vNMSE than DRIVE-unbiased (i.e., 1-bit EDEN-unbiased) across the entire displayed range. So even before considering the first-stage split, the one-bit residual mechanism is already a weak choice relative to the earlier one-bit unbiased baseline.
## 5 Reproducing the TurboQuant Paper’s Empirical Behavior
A contribution of the TurboQuant paper is to show that this compression mechanism can be applied in a variety of settings, such as nearest-neighbor queries using a mechanism based on inner products. We have also reproduced the accuracy experiments reported in the TurboQuant paper using their open-source code, while adding EDEN in order to make a comparison. We did not compare the runtimes, but we expect them to be very similar.
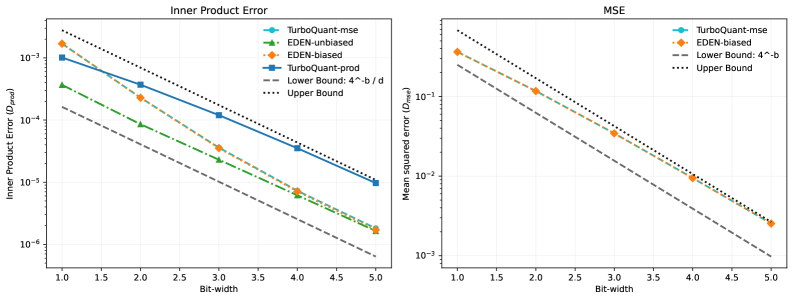
Figure 6 shows that the error of EDEN-unbiased is markedly lower for inner product estimation than both TurboQuant ${}_mse$ and TurboQuant ${}_prod$ . It also shows that the MSE of EDEN-biased is comparable to but lower than TurboQuant ${}_mse$ , consistent with our results from Section 3.
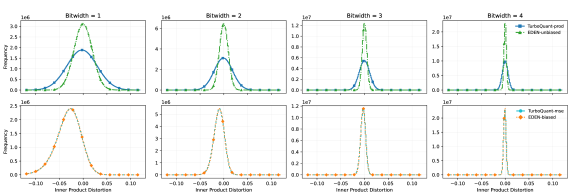
Figure 7 shows the full distributions of inner-product error. Once again, we observe the same patterns: EDEN-unbiased outperforms TurboQuant ${}_prod$ and EDEN-biased is similar to but better than TurboQuant ${}_mse$ .
<details>
<summary>2604.18555v1/x5.png Details</summary>
### Visual Description
## Line Graphs: Inner Product Error and MSE vs Bit-width
### Overview
The image contains two line graphs comparing error metrics (Inner Product Error and Mean Squared Error) across different bit-widths (1.0 to 5.0). Both graphs include multiple data series, theoretical bounds, and logarithmic y-axes. The legends are positioned on the right side of each graph.
---
### Components/Axes
#### Left Graph (Inner Product Error)
- **X-axis**: Bit-width (1.0 to 5.0, linear scale)
- **Y-axis**: Inner Product Error (1e-6 to 1e-3, logarithmic scale)
- **Legend**:
- TurboQuant-mse (blue circles)
- EDEN-unbiased (green triangles)
- EDEN-biased (orange diamonds)
- TurboQuant-prod (blue squares)
- Lower Bound: 4^-b/d (dashed gray line)
- Upper Bound: 4^-b/d (dotted gray line)
#### Right Graph (MSE)
- **X-axis**: Bit-width (1.0 to 5.0, linear scale)
- **Y-axis**: Mean Squared Error (1e-3 to 1e-1, logarithmic scale)
- **Legend**:
- TurboQuant-mse (blue circles)
- EDEN-biased (orange diamonds)
- Lower Bound: 4^-b (dashed gray line)
- Upper Bound: 4^-b (dotted gray line)
---
### Detailed Analysis
#### Left Graph (Inner Product Error)
1. **TurboQuant-mse** (blue circles):
- Starts at ~1e-3 (Bit-width 1.0), decreases to ~1e-5 (Bit-width 5.0).
- Follows a steep downward trend.
2. **EDEN-unbiased** (green triangles):
- Starts at ~1e-4 (Bit-width 1.0), decreases to ~1e-6 (Bit-width 5.0).
- Slightly below TurboQuant-mse at all points.
3. **EDEN-biased** (orange diamonds):
- Starts at ~1e-3 (Bit-width 1.0), decreases to ~1e-5 (Bit-width 5.0).
- Overlaps with TurboQuant-mse at lower Bit-widths but diverges slightly at higher Bit-widths.
4. **TurboQuant-prod** (blue squares):
- Starts at ~1e-3 (Bit-width 1.0), decreases to ~1e-5 (Bit-width 5.0).
- Nearly identical to TurboQuant-mse.
5. **Bounds**:
- Lower Bound (dashed gray): ~1e-4 to ~1e-6.
- Upper Bound (dotted gray): ~1e-3 to ~1e-5.
#### Right Graph (MSE)
1. **TurboQuant-mse** (blue circles):
- Starts at ~1e-1 (Bit-width 1.0), decreases to ~1e-3 (Bit-width 5.0).
- Steep downward trend.
2. **EDEN-biased** (orange diamonds):
- Starts at ~1e-1 (Bit-width 1.0), decreases to ~1e-3 (Bit-width 5.0).
- Parallel to TurboQuant-mse but slightly higher at all points.
3. **Bounds**:
- Lower Bound (dashed gray): ~1e-2 to ~1e-4.
- Upper Bound (dotted gray): ~1e-1 to ~1e-3.
---
### Key Observations
1. **Error Reduction**: All data series show a consistent decrease in error as Bit-width increases.
2. **Convergence**: TurboQuant-mse and EDEN-biased lines in the MSE graph are nearly identical, suggesting similar performance.
3. **Bounds**: Theoretical bounds (dashed/dotted lines) tightly enclose the data series, indicating the errors are well-constrained.
4. **Divergence**: In the Inner Product Error graph, EDEN-unbiased (green triangles) consistently underperforms other methods.
---
### Interpretation
1. **Bit-width Impact**: Higher Bit-widths significantly reduce both Inner Product Error and MSE, validating the effectiveness of increased precision.
2. **Method Comparison**:
- TurboQuant-mse and EDEN-biased perform similarly in MSE, while EDEN-unbiased excels in Inner Product Error.
- The bounds suggest a theoretical limit to error reduction, with all methods approaching the lower bound as Bit-width increases.
3. **Practical Implications**: The convergence of TurboQuant-mse and EDEN-biased in MSE implies that bias mitigation (EDEN-unbiased) may be more critical for Inner Product Error than for MSE.
---
### Spatial Grounding & Verification
- **Legend Alignment**: All line colors/markers match their legend labels (e.g., blue circles = TurboQuant-mse).
- **Trend Verification**:
- Left graph: All lines slope downward, with EDEN-unbiased being the steepest.
- Right graph: TurboQuant-mse and EDEN-biased lines are parallel, both steeper than the bounds.
- **Component Isolation**:
- Left graph focuses on Inner Product Error with tighter bounds (4^-b/d).
- Right graph focuses on MSE with looser bounds (4^-b).
---
### Content Details
- **Inner Product Error Values** (approximate):
- TurboQuant-mse: 1e-3 → 1e-5
- EDEN-unbiased: 1e-4 → 1e-6
- EDEN-biased: 1e-3 → 1e-5
- TurboQuant-prod: 1e-3 → 1e-5
- **MSE Values** (approximate):
- TurboQuant-mse: 1e-1 → 1e-3
- EDEN-biased: 1e-1 → 1e-3
---
### Final Notes
The graphs demonstrate that increasing Bit-width reduces error across all methods, with EDEN-unbiased showing the most significant improvement in Inner Product Error. The bounds provide a theoretical framework for evaluating method performance, with all data series approaching the lower bound as Bit-width increases.
</details>
Figure 6: Aggregate accuracy curves in the reproduced TurboQuant-style presentation. The right panel compares TurboQuant ${}_\texttt{mse}$ with EDEN-biased for MSE, while the left panel compares the inner-product-oriented methods as a function of bitwidth. In both panels, the horizontal axis is the bitwidth $b$ .
<details>
<summary>2604.18555v1/x6.png Details</summary>
### Visual Description
## Line Graphs: Frequency vs. Inner Product Distortion Across Bitwidths
### Overview
The image contains eight line graphs organized in a 2x4 grid, comparing frequency distributions of two datasets ("TurboQuant" variants and "EDDN" variants) across four bitwidths (1–4). Each graph has a y-axis labeled "Frequency" (scaled from 1e6 to 1e7) and an x-axis labeled "Inner Product Distortion" (ranging from -0.10 to 0.10). The top row compares "TurboQuant-prod" (blue) and "EDDN-unbiased" (green), while the bottom row compares "TurboQuant-err" (blue) and "EDDN-biased" (orange).
### Components/Axes
- **X-axis**: "Inner Product Distortion" (range: -0.10 to 0.10 for all graphs).
- **Y-axis**: "Frequency" (scaled logarithmically: 1e6, 1e7).
- **Legends**:
- Top row: Blue = "TurboQuant-prod", Green = "EDDN-unbiased".
- Bottom row: Blue = "TurboQuant-err", Orange = "EDDN-biased".
- **Bitwidth Labels**: Titles above each graph indicate bitwidth (1–4).
### Detailed Analysis
1. **Bitwidth = 1**
- **Top Row**:
- TurboQuant-prod (blue) peaks at ~2.5e6 frequency, centered at 0 distortion.
- EDDN-unbiased (green) peaks slightly lower (~2.0e6), with a narrower distribution.
- **Bottom Row**:
- TurboQuant-err (blue) peaks at ~2.0e6, with a broader spread.
- EDDN-biased (orange) peaks at ~1.5e6, with a flatter curve.
2. **Bitwidth = 2**
- **Top Row**:
- TurboQuant-prod peaks at ~3.0e6, EDDN-unbiased at ~2.5e6.
- **Bottom Row**:
- TurboQuant-err peaks at ~2.5e6, EDDN-biased at ~2.0e6.
3. **Bitwidth = 3**
- **Top Row**:
- TurboQuant-prod peaks at ~1.0e7, EDDN-unbiased at ~8e6.
- **Bottom Row**:
- TurboQuant-err peaks at ~8e6, EDDN-biased at ~6e6.
4. **Bitwidth = 4**
- **Top Row**:
- TurboQuant-prod peaks sharply at ~1.5e7, EDDN-unbiased at ~1.0e7.
- **Bottom Row**:
- TurboQuant-err peaks at ~1.0e7, EDDN-biased at ~8e6.
### Key Observations
- **Trend Verification**:
- TurboQuant variants (both prod and err) consistently show higher frequency peaks than their EDDN counterparts across all bitwidths.
- EDDN-biased (orange) exhibits the lowest frequency and broadest distribution, suggesting higher distortion sensitivity.
- **Outliers/Anomalies**:
- At bitwidth 4, TurboQuant-prod’s peak is exceptionally sharp, indicating minimal distortion tolerance.
- EDDN-biased (orange) shows a gradual decline in frequency as bitwidth increases, unlike TurboQuant variants.
### Interpretation
The data suggests that TurboQuant methods (prod and err) outperform EDDN variants in terms of frequency and distortion tolerance. As bitwidth increases, TurboQuant-prod demonstrates the highest efficiency, likely due to optimized error handling (prod) or error correction (err). EDDN-biased underperforms significantly, possibly due to inherent biases in its design. The logarithmic y-axis scaling highlights exponential differences in frequency, emphasizing the superiority of TurboQuant methods in high-bitwidth scenarios.
</details>
Figure 7: Distribution of inner-product error in the reproduced TurboQuant-style presentation. The top row compares TurboQuant ${}_prod$ with EDEN-unbiased, and the bottom row compares TurboQuant ${}_\texttt{mse}$ with EDEN-biased, for bitwidths $b∈\{1,2,3,4\}$ . Within each row, the four columns correspond from left to right to $b=1,2,3,4$ .
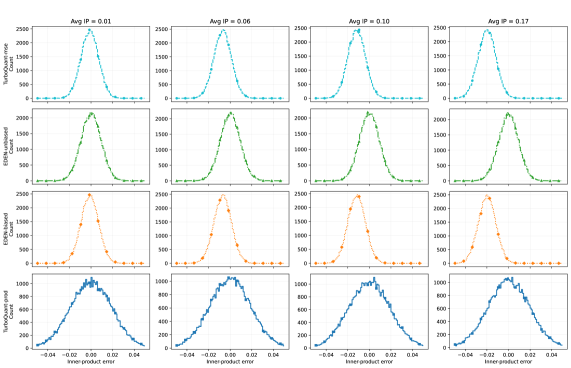
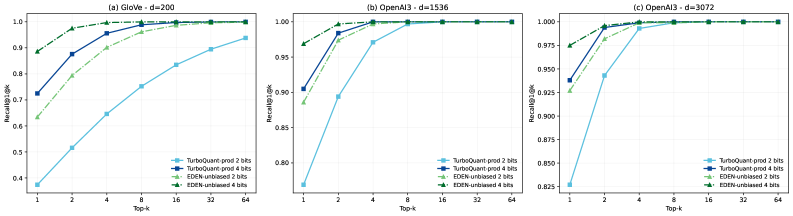
Two additional reproduced figures reinforce the same conclusion in more specialized settings. Figure 8 shows that the inner-product error of TurboQuant ${}_prod$ remains much more dispersed than that of EDEN-unbiased as the average signal strength changes. Figure 9 shows that the same qualitative gap persists in a downstream nearest-neighbor retrieval task.
<details>
<summary>2604.18555v1/x7.png Details</summary>
### Visual Description
## Line Graph Grid: Error Metrics vs Average IP
### Overview
The image contains a 4x3 grid of line graphs comparing four error metrics (TurbQuant-noise, EDEN-unbiased, EDEN-based, Inner-product error) across four Average IP values (0.01, 0.06, 0.10, 0.17). Each column represents a fixed Average IP value, while each row represents a specific error metric. The graphs show distributions of error counts against inner-product error values.
### Components/Axes
- **X-axis**: "Inner-product error" (range: -0.04 to 0.04)
- **Y-axis**: "Count" (range: 0 to 2500)
- **Legend**: Located at bottom-right, color-coded:
- Blue: TurbQuant-noise
- Green: EDEN-unbiased
- Orange: EDEN-based
- Dark Blue: Inner-product error
- **Graph Titles**: Each column header shows "Avg IP = [value]" (e.g., "Avg IP = 0.01")
### Detailed Analysis
1. **TurbQuant-noise (Blue)**
- Peaks shift leftward as Avg IP increases
- Peak height decreases with higher Avg IP (e.g., 2000 at 0.01 → 1500 at 0.17)
- Distribution narrows slightly at higher Avg IP
2. **EDEN-unbiased (Green)**
- Peaks consistently centered at 0 inner-product error
- Peak height decreases with higher Avg IP (e.g., 2000 at 0.01 → 1800 at 0.17)
- Distribution becomes slightly broader at higher Avg IP
3. **EDEN-based (Orange)**
- Peaks show bimodal distribution at lower Avg IP (0.01)
- Single peak emerges at higher Avg IP (0.17)
- Peak height decreases significantly (e.g., 2000 at 0.01 → 1200 at 0.17)
4. **Inner-product error (Dark Blue)**
- Peaks shift rightward as Avg IP increases
- Distribution broadens significantly with higher Avg IP
- Peak height decreases (e.g., 2000 at 0.01 → 1000 at 0.17)
### Key Observations
- All metrics show reduced peak counts at higher Avg IP values
- Inner-product error demonstrates the most pronounced rightward shift (0.01 → 0.17)
- EDEN-based metric transitions from bimodal to unimodal distribution
- TurbQuant-noise and EDEN-unbiased maintain central positioning but with reduced variance
### Interpretation
The data suggests a degradation in model performance as Average IP increases:
1. **Error Propagation**: Higher Avg IP correlates with increased inner-product error spread, indicating reduced model stability
2. **Metric Sensitivity**: EDEN-based metric's bimodal collapse suggests loss of discriminative power at higher IP values
3. **Robustness Tradeoffs**: While EDEN-unbiased maintains central error positioning, its reduced peak height implies diminishing error resolution
4. **Threshold Effects**: The 0.10-0.17 Avg IP range shows accelerated performance degradation across all metrics
All values are approximate, with uncertainty increasing for higher Avg IP measurements. The legend's bottom-right placement ensures clear metric identification across all graphs.
</details>
Figure 8: Inner-product error variance under changing signal strength in the reproduced TurboQuant-style presentation. Across the displayed average inner-product regimes, EDEN-unbiased remains much more tightly concentrated than TurboQuant ${}_prod$ .
<details>
<summary>2604.18555v1/x8.png Details</summary>
### Visual Description
## Line Graphs: Recall@1k vs Top-k for Different Models and Quantization Methods
### Overview
The image contains three line graphs comparing the performance of different quantization methods (TurboQuant-prod and EDEN-unbiased) across three datasets: GloVe (d=200), OpenAI3 (d=1536), and OpenAI3 (d=3072). Each graph plots **Recall@1k** (y-axis) against **Top-k** (x-axis), with performance trends visualized for 2-bit and 4-bit quantization configurations.
---
### Components/Axes
1. **X-axis (Top-k)**:
- Values: 1, 2, 4, 8, 16, 32, 64 (logarithmic scale).
- Label: "Top-k" (positioned at the bottom of each graph).
2. **Y-axis (Recall@1k)**:
- Graph (a): 0.4–1.0 (increments of 0.1).
- Graph (b): 0.80–1.00 (increments of 0.05).
- Graph (c): 0.825–1.000 (increments of 0.025).
- Label: "Recall@1k" (positioned on the left of each graph).
3. **Legends**:
- Located at the bottom-right of each graph.
- Entries:
- **TurboQuant-prod 2 bits** (light blue).
- **TurboQuant-prod 4 bits** (dark blue).
- **EDEN-unbiased 2 bits** (light green).
- **EDEN-unbiased 4 bits** (dark green).
---
### Detailed Analysis
#### Graph (a): GloVe - d=200
- **Trends**:
- **TurboQuant-prod 2 bits** (light blue): Starts at ~0.38 (Top-k=1) and rises steeply to ~0.92 (Top-k=64).
- **TurboQuant-prod 4 bits** (dark blue): Begins at ~0.72 (Top-k=1) and plateaus near 1.0.
- **EDEN-unbiased 2 bits** (light green): Starts at ~0.62 (Top-k=1) and increases to ~0.98 (Top-k=64).
- **EDEN-unbiased 4 bits** (dark green): Begins at ~0.88 (Top-k=1) and stabilizes at 1.0.
- **Key Data Points**:
- At Top-k=1: TurboQuant-prod 2 bits (0.38), TurboQuant-prod 4 bits (0.72), EDEN-unbiased 2 bits (0.62), EDEN-unbiased 4 bits (0.88).
- At Top-k=64: All 4-bit methods reach ~1.0; TurboQuant-prod 2 bits reaches 0.92.
#### Graph (b): OpenAI3 - d=1536
- **Trends**:
- **TurboQuant-prod 2 bits** (light blue): Starts at ~0.80 (Top-k=1) and rises to ~0.98 (Top-k=64).
- **TurboQuant-prod 4 bits** (dark blue): Begins at ~0.90 (Top-k=1) and plateaus near 1.0.
- **EDEN-unbiased 2 bits** (light green): Starts at ~0.88 (Top-k=1) and increases to ~0.99 (Top-k=64).
- **EDEN-unbiased 4 bits** (dark green): Begins at ~0.95 (Top-k=1) and stabilizes at 1.0.
- **Key Data Points**:
- At Top-k=1: TurboQuant-prod 2 bits (0.80), TurboQuant-prod 4 bits (0.90), EDEN-unbiased 2 bits (0.88), EDEN-unbiased 4 bits (0.95).
- At Top-k=64: All 4-bit methods reach ~1.0; TurboQuant-prod 2 bits reaches 0.98.
#### Graph (c): OpenAI3 - d=3072
- **Trends**:
- **TurboQuant-prod 2 bits** (light blue): Starts at ~0.825 (Top-k=1) and rises sharply to ~0.975 (Top-k=2), then plateaus.
- **TurboQuant-prod 4 bits** (dark blue): Begins at ~0.925 (Top-k=1) and plateaus near 1.0.
- **EDEN-unbiased 2 bits** (light green): Starts at ~0.90 (Top-k=1) and increases to ~0.99 (Top-k=64).
- **EDEN-unbiased 4 bits** (dark green): Begins at ~0.975 (Top-k=1) and stabilizes at 1.0.
- **Key Data Points**:
- At Top-k=1: TurboQuant-prod 2 bits (0.825), TurboQuant-prod 4 bits (0.925), EDEN-unbiased 2 bits (0.90), EDEN-unbiased 4 bits (0.975).
- At Top-k=64: All 4-bit methods reach ~1.0; TurboQuant-prod 2 bits plateaus at 0.975.
---
### Key Observations
1. **Quantization Impact**:
- 4-bit quantization consistently outperforms 2-bit across all models and datasets.
- EDEN-unbiased methods outperform TurboQuant-prod in all cases, especially at lower Top-k values.
2. **Performance Plateaus**:
- Higher Top-k values (e.g., 16–64) show diminishing returns, with most lines converging near 1.0.
3. **Dataset-Specific Behavior**:
- GloVe (d=200) shows the steepest improvement for TurboQuant-prod 2 bits.
- OpenAI3 (d=3072) exhibits the most dramatic jump for TurboQuant-prod 2 bits between Top-k=1 and 2.
---
### Interpretation
The data demonstrates that:
- **Higher quantization (4 bits)** reduces performance degradation compared to 2-bit methods, likely due to better preservation of model precision.
- **EDEN-unbiased models** achieve superior recall, suggesting their training or architecture mitigates quantization errors more effectively than TurboQuant-prod.
- **Dataset dimensionality** influences performance: Lower-dimensional GloVe (d=200) allows faster convergence, while higher-dimensional OpenAI3 (d=3072) requires larger Top-k to reach peak performance.
Notably, the sharp rise in TurboQuant-prod 2 bits for OpenAI3 (d=3072) at Top-k=2 implies a critical threshold where recall improves significantly, highlighting the importance of tuning Top-k for high-dimensional models.
</details>
Figure 9: Downstream nearest-neighbor recall comparison in the reproduced TurboQuant-style presentation. EDEN-unbiased outperforms TurboQuant ${}_prod$ on the displayed GloVe and OpenAI3 settings at both two and four bits.
## 6 Randomized Hadamard Transform
We note that both DRIVE/EDEN and TurboQuant suggest using the Randomized Hadamard Transform (RHT) in practice instead of uniform random rotations, in order to reduce the computational cost of the rotation step.
We note that when using RHT, outputs from the RHT step may affect unbiasedness. However, both papers observed that it is essentially as accurate and nearly unbiased in practice.
This is not true for adversarial inputs (the DRIVE paper provides an example [8]). We note that our followup work QUIC-FL [1] allows unbiased estimates with a single RHT, and that our recent results [2] indicate that by using two consecutive RHTs, one can get provably nearly-unbiased results, in the sense that the bias vanishes polynomially in the dimension.
## 7 Discussion
The TurboQuant work suggests that compression techniques based on randomized rotations may have important potential applications to improve efficient use of AI memory. This note has shown that some of the compression algorithms and much of the corresponding analysis for the TurboQuant methods appeared previously in the DRIVE and EDEN papers. In fact, the TurboQuant ${}_\texttt{mse}$ algorithm is a special case of the biased variant of the EDEN, and the unbiased variant of EDEN has better accuracy than that of the unbiased variant TurboQuant ${}_prod$ . We hope that demonstrating the advantages of using EDEN, with its scaling factor, will support its continued adoption in emerging systems more rapidly.
## References
- [1] R. B. Basat, S. Vargaftik, A. Portnoy, G. Einziger, Y. Ben-Itzhak, and M. Mitzenmacher (2024) Accelerating Federated Learning with Quick Distributed Mean Estimation. In International Conference on Machine Learning, Cited by: §6.
- [2] R. Ben Basat, W. Kuszmaul, A. Portnoy, and S. Vargaftik (2026) Preprint in preparation. Cited by: §6.
- [3] J. Gao and C. Long (2024) Rabitq: quantizing high-dimensional vectors with a theoretical error bound for approximate nearest neighbor search. Proceedings of the ACM on Management of Data 2 (3), pp. 1–27. Cited by: footnote 2.
- [4] J. Gao (2026-03) TurboQuant and rabitq: what the public story gets wrong. Note: DEV Communityhttps://dev.to/gaoj0017/turboquant-and-rabitq-what-the-public-story-gets-wrong-1i00 Cited by: footnote 2.
- [5] S. Jong-gap (2026) Google’s ‘turboquant’ sparks memory stock selloff; industry calls demand concerns overblown. Note: Seoul Economic DailyMarch 26, 2026. Available at article link External Links: Link Cited by: §1.
- [6] OpenFL - Secure Federated AI (2022) eden_pipeline.py source code in OpenFederatedLearning. GitHub. Note: GitHub repository https://github.com/securefederatedai/openfederatedlearning/blob/develop/openfl/pipelines/eden_pipeline.py Cited by: footnote 1.
- [7] Seoul Economic Daily (2026) Semiconductor stocks plunge on google turboquant — ‘actual effect limited to 2.6x’. Note: Seoul Economic DailyMarch 27, 2026. Available at article link External Links: Link Cited by: §1.
- [8] S. Vargaftik, R. Ben-Basat, A. Portnoy, G. Mendelson, Y. Ben-Itzhak, and M. Mitzenmacher (2021) DRIVE: one-bit distributed mean estimation. In Advances in Neural Information Processing Systems 34 (NeurIPS 2021), External Links: Link Cited by: §1, §2, §2, §3, §3, §3, §6.
- [9] S. Vargaftik, R. Ben-Basat, A. Portnoy, G. Mendelson, Y. Ben-Itzhak, and M. Mitzenmacher (2022) EDEN: communication-efficient and robust distributed mean estimation for federated learning. In Proceedings of the 39th International Conference on Machine Learning (ICML 2022), PMLR 162. External Links: Link Cited by: §1, §2, §2, §2, §2, §3, §3.
- [10] VMware’s Open Source Team (2022-11) VMware Research Group’s EDEN Becomes Part of OpenFL. Note: VMware Open Source Blog https://blogs.vmware.com/opensource/2022/11/16/vmware-research-groups-eden-becomes-part-of-openfl/ Cited by: footnote 1.
- [11] A. Warrick (2026) Samsung, sk hynix slide as google touts ai memory compression tech ‘turboquant’. Note: Investing.com, with Reuters creditMarch 25, 2026. Available at article link External Links: Link Cited by: §1.
- [12] A. Zandieh, M. Daliri, M. Hadian, and V. Mirrokni (2026) TurboQuant: online vector quantization with near-optimal distortion rate. In The Fourteenth International Conference on Learning Representations, Note: https://openreview.net/forum?id=tO3ASKZlok Cited by: §1, §2, §2, §3, §3.
- [13] A. Zandieh, M. Daliri, and I. Han (2024) QJL: 1-bit quantized JL transform for KV cache quantization with zero overhead. External Links: 2406.03482, Link Cited by: §4.
- [14] A. Zandieh and V. Mirrokni (2026) TurboQuant: redefining ai efficiency with extreme compression. Note: Google blogMarch 24, 2026 External Links: Link Cited by: §1.