## Stacked Area Chart: Number of Jobs by Package Introduction Revision (2018-2023)
### Overview
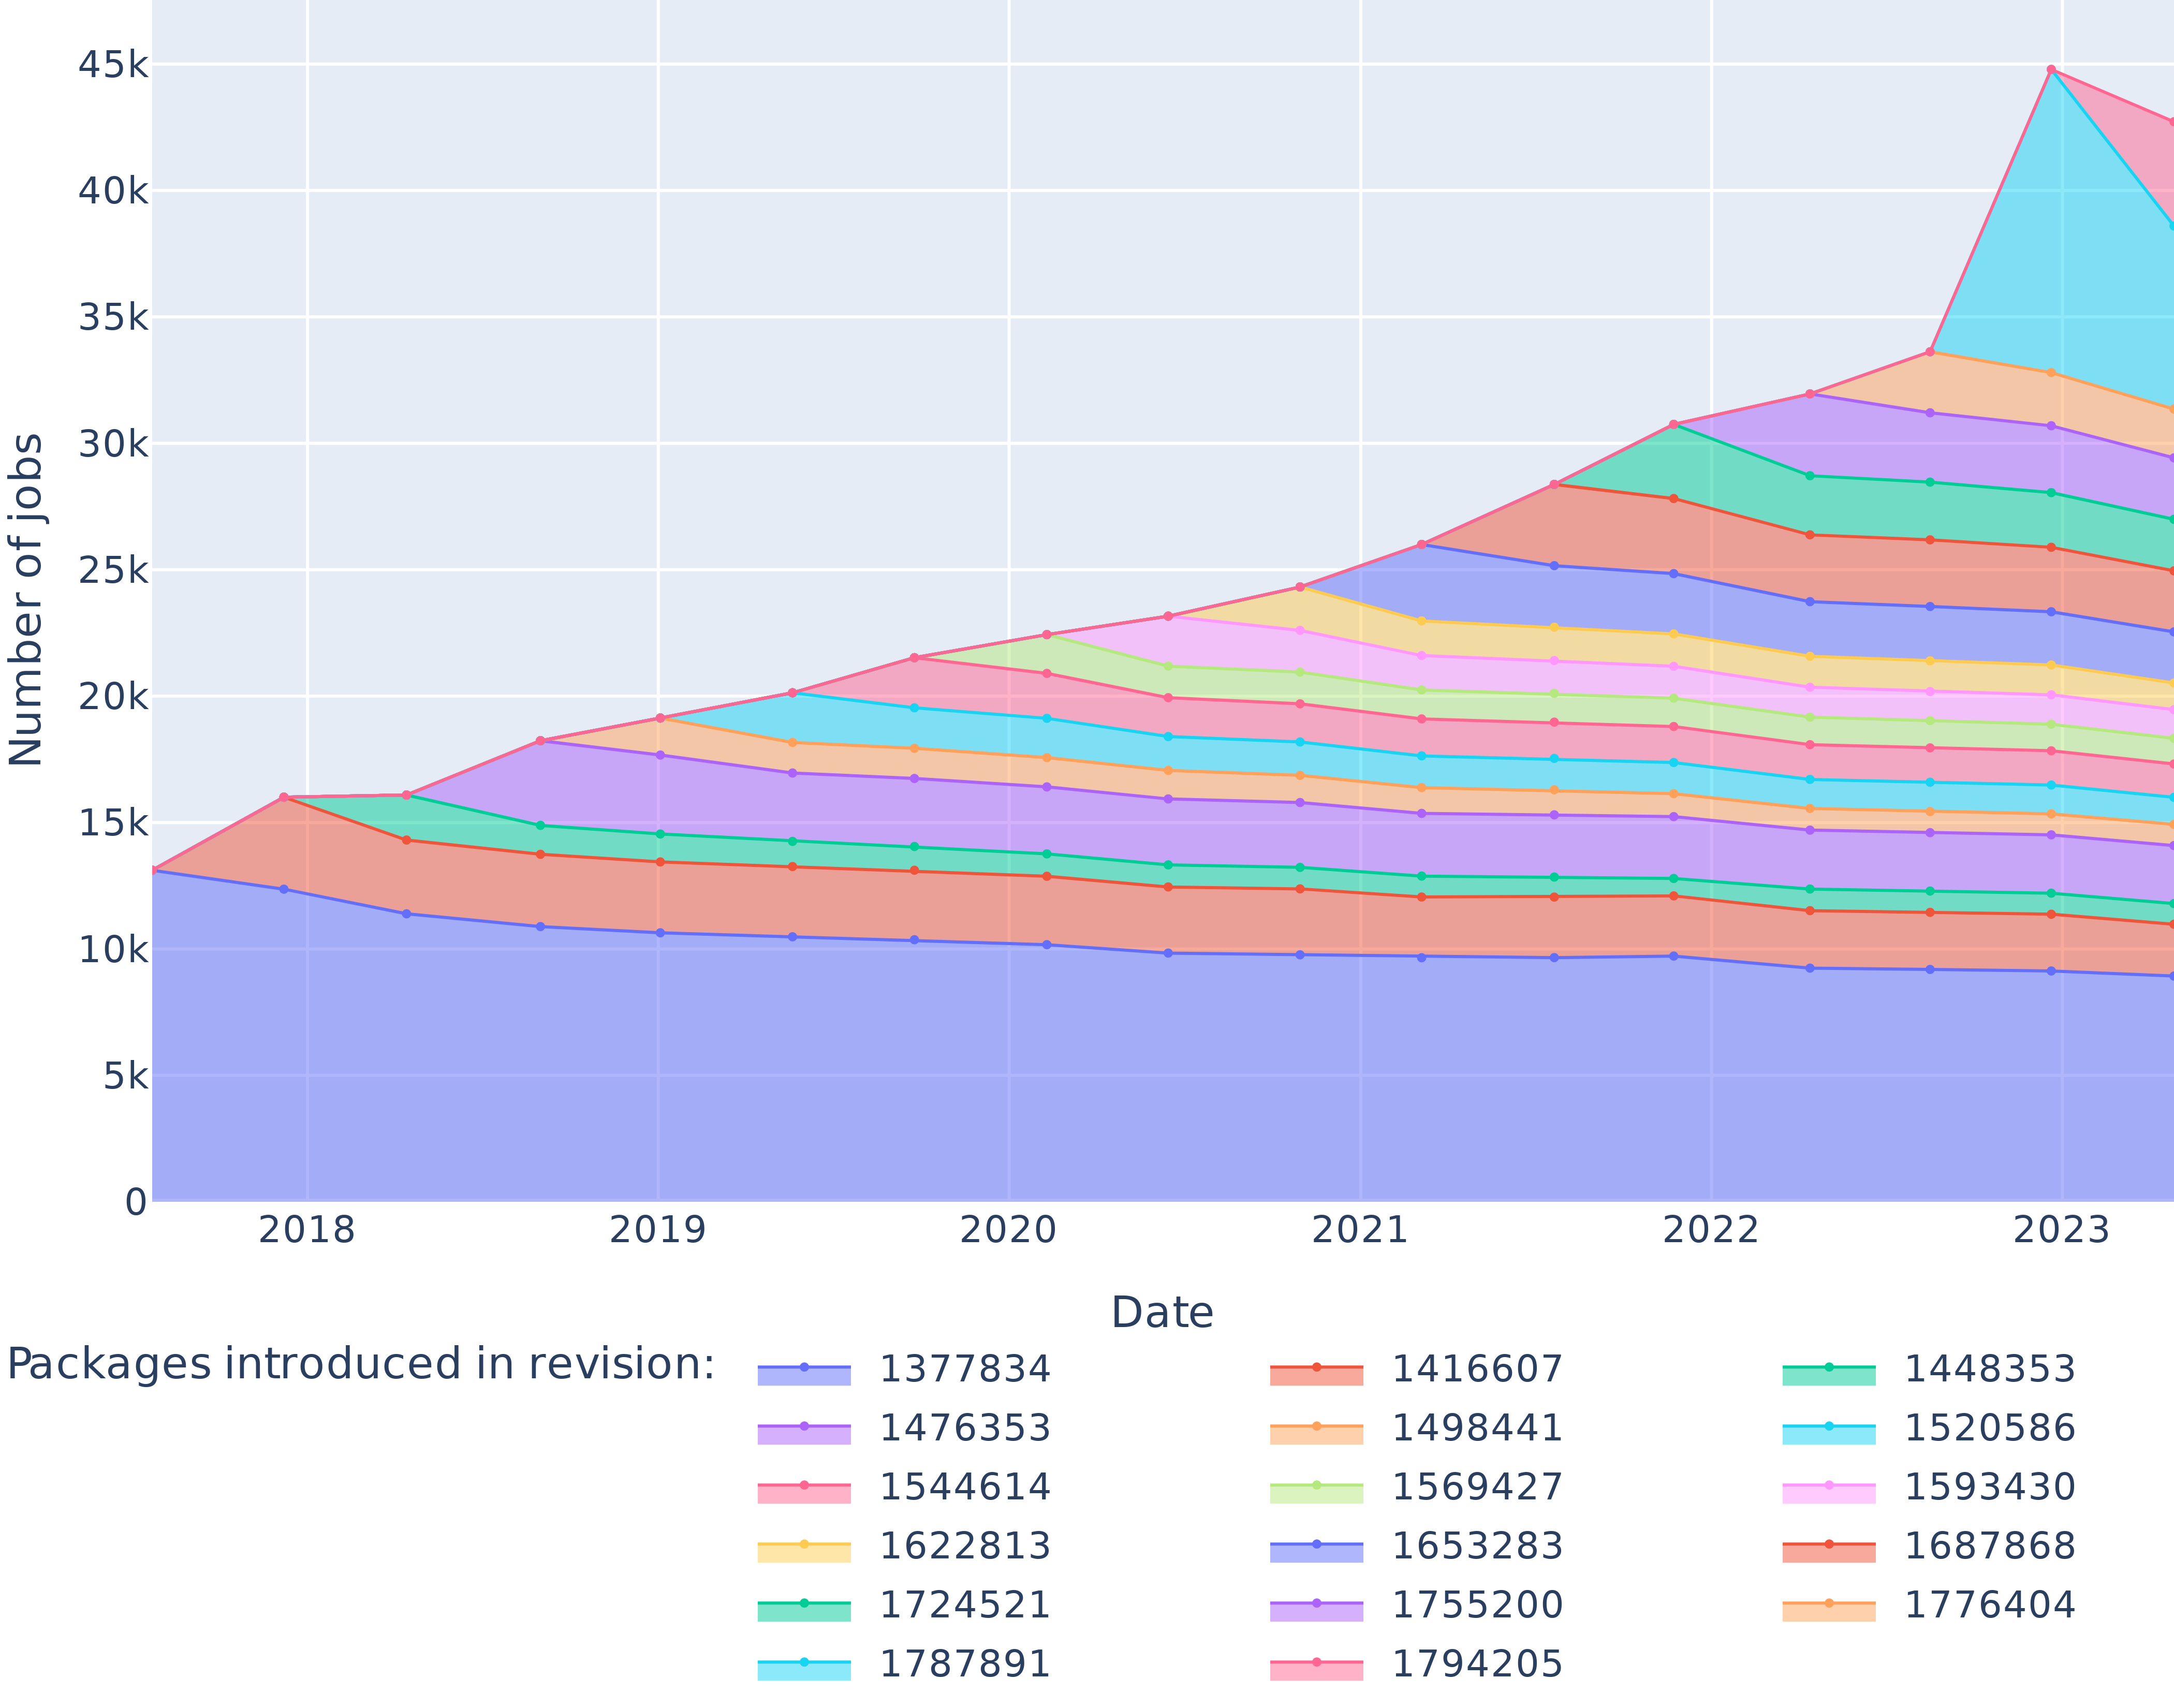
This is a stacked area chart tracking the "Number of jobs" over time, from 2018 to 2023. The chart visualizes how the total volume of jobs is composed of contributions from various software packages, each introduced in a specific revision. The overall trend shows a steady increase in total jobs from 2018 to 2022, followed by a dramatic spike in 2023.
### Components/Axes
* **X-Axis (Horizontal):** Labeled "Date". Major tick marks represent years: 2018, 2019, 2020, 2021, 2022, 2023.
* **Y-Axis (Vertical):** Labeled "Number of jobs". Scale ranges from 0 to 45,000 (45k), with increments of 5,000 (5k).
* **Legend:** Positioned at the bottom of the chart, titled "Packages introduced in revision:". It lists 17 distinct packages, each associated with a unique color and a revision number. The legend is organized into three columns.
* **Column 1:** 1377834 (light blue), 1476353 (light purple), 1544614 (pink), 1622813 (yellow), 1724521 (green), 1787891 (cyan).
* **Column 2:** 1416607 (salmon), 1498441 (light orange), 1569427 (light green), 1653283 (medium blue), 1755200 (medium purple), 1794205 (medium pink).
* **Column 3:** 1448353 (teal), 1520586 (light cyan), 1593430 (light pink), 1687868 (dark orange), 1776404 (peach).
### Detailed Analysis
The chart displays 17 stacked layers, each representing the job count attributable to a package from a specific revision. The layers are stacked from bottom to top. The approximate total job count and the trend for each package are as follows:
**Total Job Count Trend:**
* **2018:** ~16,000
* **2019:** ~19,000
* **2020:** ~22,000
* **2021:** ~26,000
* **2022:** ~31,000
* **2023:** ~45,000 (sharp increase)
**Package-Specific Trends (from bottom layer upward):**
1. **1377834 (Light Blue):** The foundational layer. Shows a steady decline from ~13,000 jobs in 2018 to ~9,000 in 2023.
2. **1476353 (Light Purple):** Sits above the blue layer. Also declines, from ~3,000 to ~2,000 jobs.
3. **1544614 (Pink):** Relatively stable band, contributing approximately 2,000 jobs throughout the period.
4. **1622813 (Yellow):** Shows moderate growth, increasing from ~1,000 to ~2,000 jobs.
5. **1724521 (Green):** Demonstrates clear growth, expanding from ~1,000 to ~3,000 jobs.
6. **1787891 (Cyan):** **The most significant layer.** Shows a dramatic, sharp spike in 2023. It grows from ~1,000 jobs in 2018 to an estimated ~4,000+ jobs in 2023, driving the overall total spike.
7. **1498441 (Light Orange) through 1776404 (Peach):** The remaining 11 layers (1498441, 1569427, 1653283, 1755200, 1794205, 1448353, 1520586, 1593430, 1687868, 1776404) collectively form the upper portion of the stack. Each individually contributes a smaller, growing share, typically increasing from a few hundred jobs in 2018 to approximately 1,000-2,000 jobs each by 2023. Their combined growth adds significantly to the total.
### Key Observations
1. **Dominant Growth Driver:** The package from revision **1787891 (cyan)** is the primary outlier, responsible for the disproportionate surge in total jobs in 2023.
2. **Base Layer Decline:** The two earliest packages (1377834, 1476353) show a consistent downward trend, suggesting they are being phased out or superseded.
3. **Broad-Based Growth:** From 2020 onward, nearly all packages introduced in later revisions (from 1569427 onward) show positive growth trends, indicating a diversifying and expanding ecosystem.
4. **Compositional Shift:** The chart illustrates a clear shift in composition. In 2018, the job count was dominated by the earliest packages (1377834, 1476353). By 2023, the contribution is much more distributed across a larger number of newer packages, with 1787891 becoming a major component.
### Interpretation
This chart likely represents the adoption and usage lifecycle of software packages within a specific ecosystem (e.g., a programming language repository, a cloud platform, or an internal toolchain). The "Number of jobs" could refer to computational tasks, build jobs, or deployment instances that depend on these packages.
The data suggests a healthy, evolving system:
* **Innovation and Adoption:** The consistent introduction of new packages (each tied to a revision number) and their subsequent growth in job count indicates active development and user adoption of new tools and libraries.
* **Technology Migration:** The decline of the earliest packages is a natural part of technology evolution, where older solutions are gradually replaced by newer, more efficient, or more feature-rich alternatives.
* **Potential Major Event in 2023:** The explosive growth of package 1787891 in 2023 is the most notable anomaly. This could correspond to a major version release, a critical security update that forced widespread migration, the package becoming a de facto standard for a new popular framework, or integration into a high-volume automated process. The spike is so pronounced it may warrant investigation into the specific events surrounding revision 1787891.
* **Ecosystem Health:** The overall upward trend in total jobs, coupled with the diversification across many packages, points to an expanding user base or increasing intensity of usage within the ecosystem.