\n
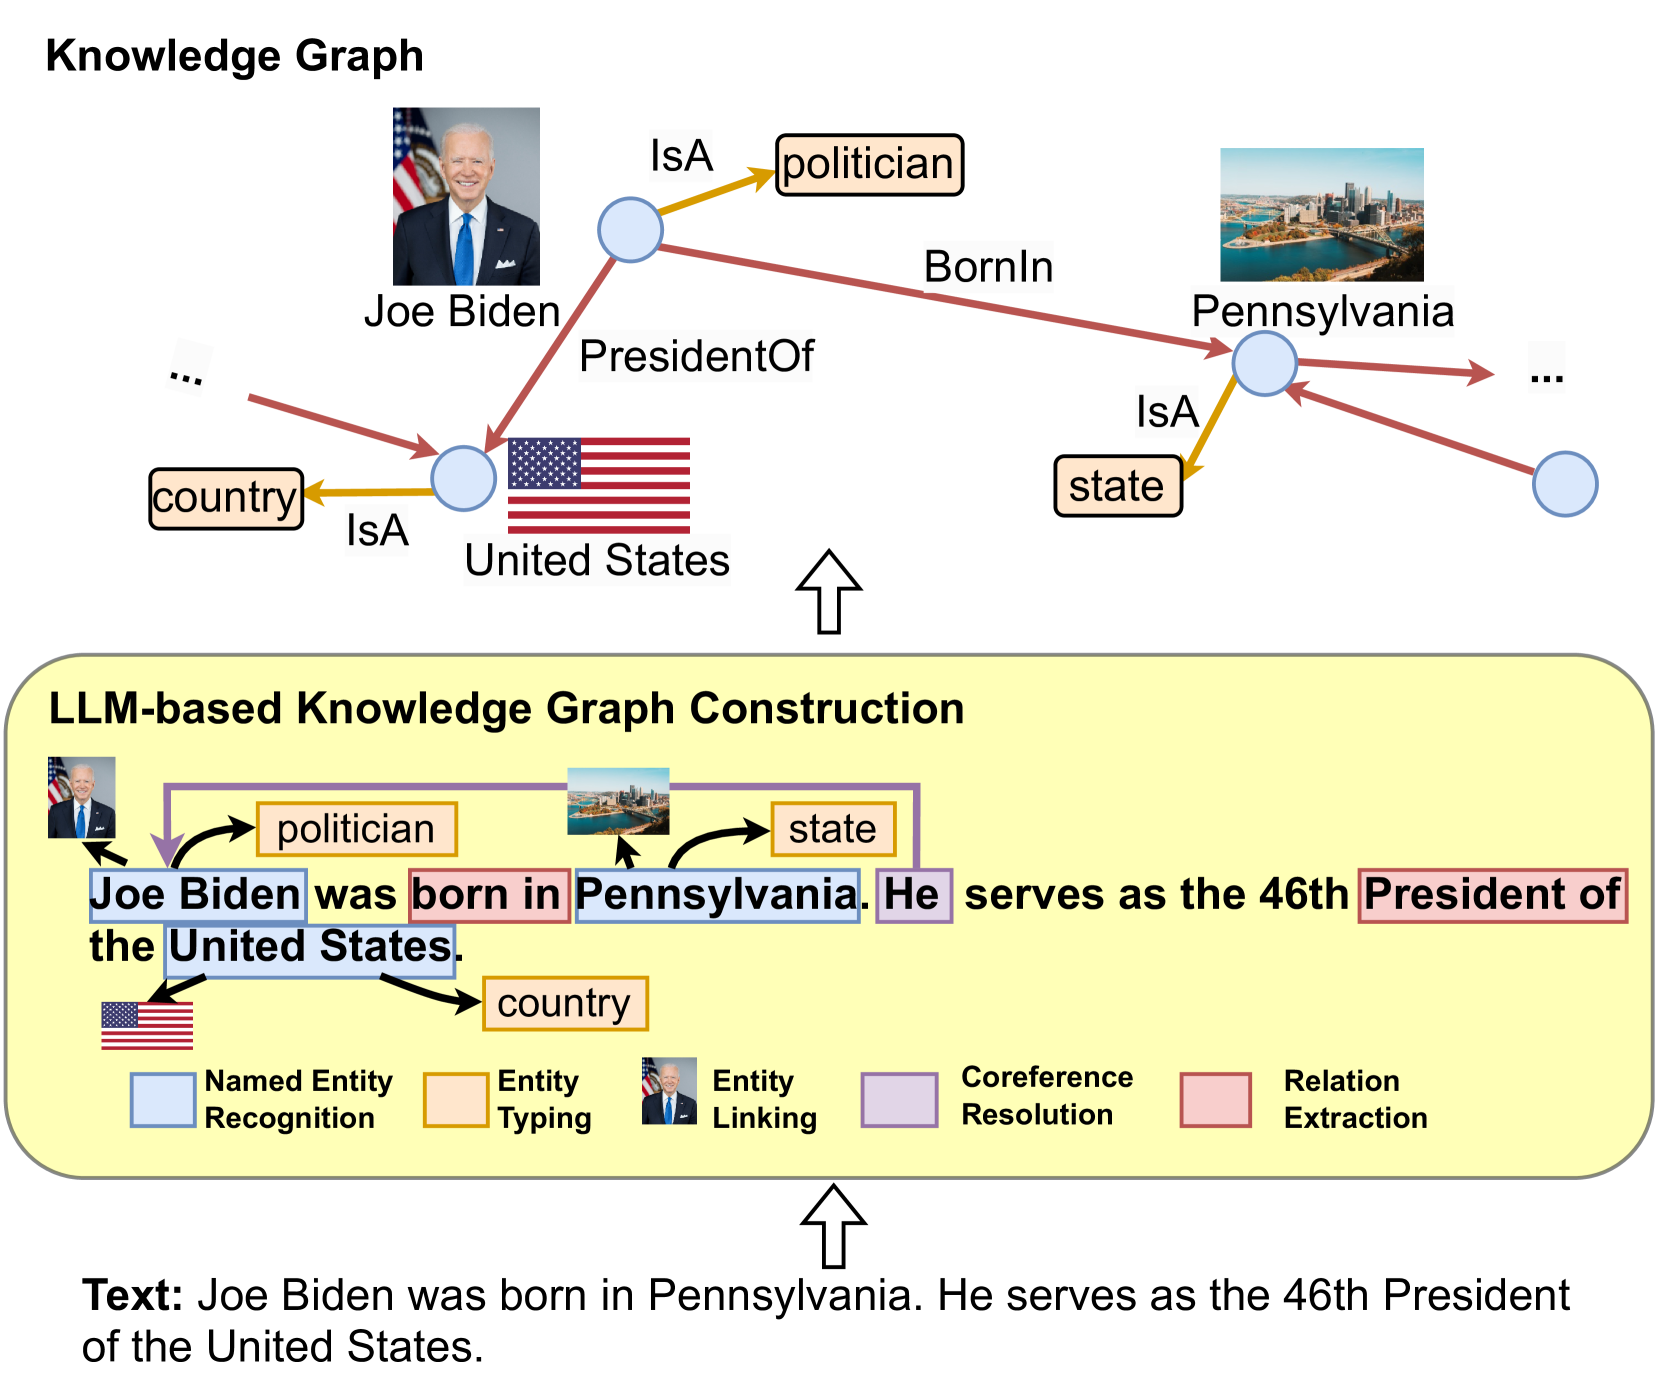
## Diagram: LLM-based Knowledge Graph Construction
### Overview
This diagram illustrates the process of constructing a knowledge graph from text using a Large Language Model (LLM). It shows how a sentence is processed through various stages – Named Entity Recognition, Entity Typing, Entity Linking, Coreference Resolution, and Relation Extraction – to create a structured knowledge representation. The diagram presents two knowledge graphs: one representing the initial state and one representing the constructed graph.
### Components/Axes
The diagram is divided into three main sections:
1. **Knowledge Graph (Top):** Represents the final knowledge graph.
2. **LLM-based Knowledge Graph Construction (Middle):** Illustrates the processing steps.
3. **Text (Bottom):** Shows the input text.
The diagram uses nodes (circles) to represent entities, edges (arrows) to represent relationships, and colored boxes to represent the different stages of LLM processing.
### Detailed Analysis or Content Details
**1. Knowledge Graph (Top)**
* **Entities:**
* Joe Biden (image of a person)
* politician (label)
* Pennsylvania (image of a landscape)
* United States (flag image)
* country (label)
* state (label)
* **Relationships:**
* Joe Biden `IsA` politician (blue arrow)
* Joe Biden `BornIn` Pennsylvania (red arrow)
* Joe Biden `PresidentOf` United States (orange arrow)
* United States `IsA` country (blue arrow)
* Pennsylvania `IsA` state (blue arrow)
* Ellipses (...) indicate further connections not fully shown.
**2. LLM-based Knowledge Graph Construction (Middle)**
* **Input Text:** "Joe Biden was born in Pennsylvania. He serves as the 46th President of the United States."
* **Processing Stages (represented by colored boxes and arrows):**
* **Named Entity Recognition (light blue):** Highlights "Joe Biden", "Pennsylvania", and "United States" in the text.
* **Entity Typing (light green):** Links "Joe Biden" to "politician", "Pennsylvania" to "state", and "United States" to "country".
* **Entity Linking (light blue):** Connects the identified entities to their corresponding nodes in the knowledge graph.
* **Coreference Resolution (light purple):** Resolves "He" to "Joe Biden".
* **Relation Extraction (light red):** Identifies the relationships "born in" and "President of".
**3. Text (Bottom)**
* The original input text: "Joe Biden was born in Pennsylvania. He serves as the 46th President of the United States."
### Key Observations
* The diagram demonstrates a clear flow from unstructured text to a structured knowledge graph.
* Each processing stage builds upon the previous one, progressively enriching the representation.
* The use of color-coding effectively highlights the different stages of the LLM pipeline.
* The diagram focuses on a simple example to illustrate the core concepts.
### Interpretation
The diagram illustrates how LLMs can be used to automatically extract structured knowledge from natural language text. The process involves identifying entities, classifying them into types, linking them to existing knowledge bases, resolving references, and extracting relationships between them. The resulting knowledge graph provides a machine-readable representation of the information contained in the text, which can be used for various downstream tasks such as question answering, reasoning, and knowledge discovery. The diagram highlights the key components of a typical knowledge graph construction pipeline and demonstrates how LLMs can automate this process. The use of visual cues (arrows, colors, images) makes the process easy to understand. The diagram suggests that LLMs are powerful tools for transforming unstructured data into structured knowledge, enabling more effective information processing and utilization.