## Bar Chart: Causal Attribution: The Impact of Exogenous "Luck"
### Overview
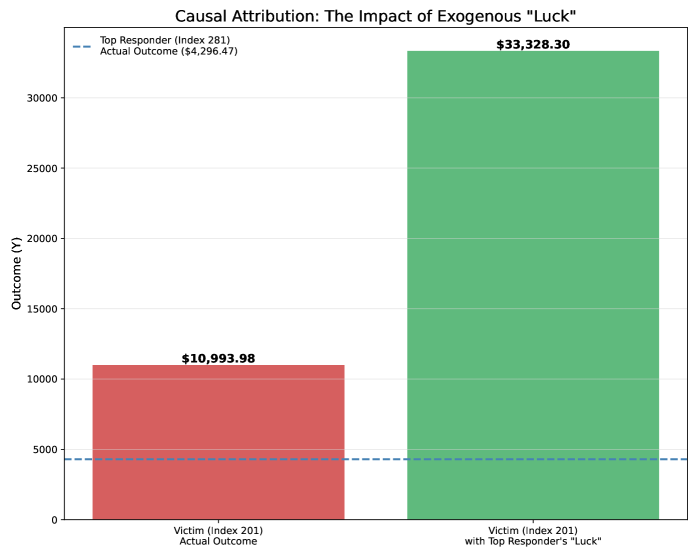
The chart compares two outcomes for "Victim (Index 201)" under different conditions: their actual outcome and the outcome when attributed with the "Top Responder's 'Luck'". A dashed blue line represents the "Top Responder (Index 281) Actual Outcome". The y-axis measures "Outcome (Y)" in monetary values, while the x-axis categorizes the two scenarios.
### Components/Axes
- **Title**: "Causal Attribution: The Impact of Exogenous 'Luck'"
- **Y-Axis**: Labeled "Outcome (Y)" with increments of $5,000 up to $35,000.
- **X-Axis**: Two categories:
- "Victim (Index 201) Actual Outcome" (red bar)
- "Victim (Index 201) with Top Responder's 'Luck'" (green bar)
- **Legend**: Top-left corner, with a dashed blue line labeled "Top Responder (Index 281) Actual Outcome ($4,296.47)".
- **Values**:
- Red bar: $10,993.98
- Green bar: $33,328.30
- Dashed blue line: $4,296.47
### Detailed Analysis
- **Red Bar**: Positioned at ~$11,000, representing the victim's actual outcome.
- **Green Bar**: Positioned at ~$33,328, showing a 203% increase compared to the red bar when the top responder's "luck" is attributed.
- **Dashed Blue Line**: A horizontal reference at ~$4,300, significantly lower than both bars, indicating the top responder's own actual outcome.
### Key Observations
1. The green bar (victim with top responder's "luck") is **3x higher** than the red bar (victim's actual outcome).
2. The top responder's own outcome ($4,296.47) is **72% lower** than the victim's actual outcome, suggesting their "luck" disproportionately benefits others.
3. The green bar exceeds the y-axis maximum ($35,000), emphasizing its magnitude.
### Interpretation
The data suggests that exogenous "luck" (when attributed to a top responder) has a **disproportionately positive impact** on outcomes for others compared to the responder's own actual results. This could imply:
- **Causal Misattribution**: The top responder's success may be overestimated when externally attributed to others.
- **Systemic Bias**: Outcomes for victims may be artificially inflated by associating them with high-performing individuals.
- **Anomaly in Top Responder's Performance**: Their own outcome is notably lower than the impact they have on others, raising questions about measurement or contextual factors.
The chart highlights how external attribution of "luck" can distort perceptions of causality and outcomes, potentially leading to misguided resource allocation or policy decisions.