## Line Graphs: Model Performance Across Token Counts and Parameters
### Overview
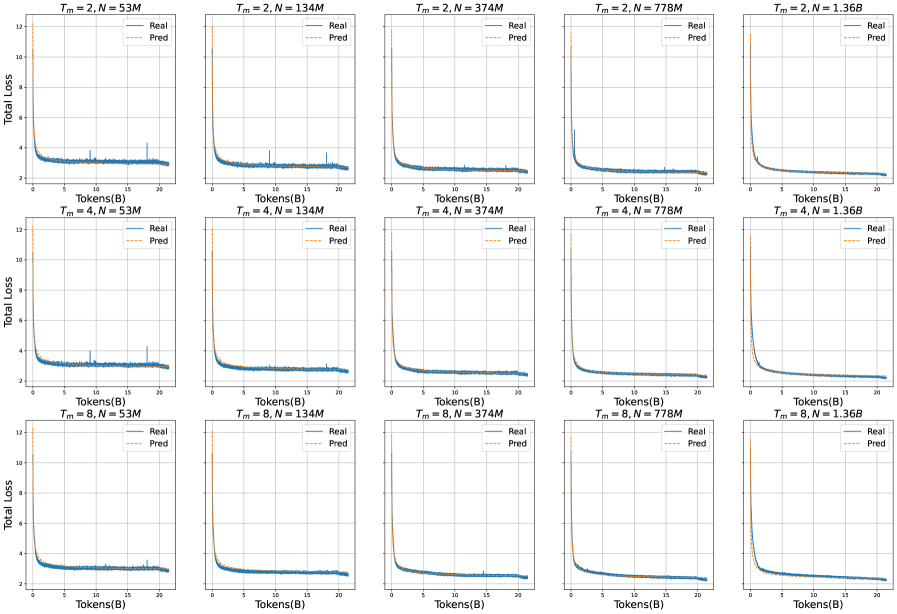
The image displays 15 line graphs arranged in a 3x5 grid, comparing "Real" (blue) and "Pred" (orange) total loss values across varying token counts (0-20 tokens). Each graph is labeled with parameters `T_m` (2, 4, or 8) and `N` (model size: 53M, 134M, 374M, 778M, or 1.36B). All graphs show a sharp initial decline in loss followed by stabilization.
---
### Components/Axes
- **X-axis**: "Tokens(B)" (0–20 tokens, linear scale)
- **Y-axis**: "Total Loss" (0–12, linear scale)
- **Legend**:
- Top-right corner of each graph
- "Real" = solid blue line
- "Pred" = dashed orange line
- **Graph Titles**:
- Format: `T_m = [value], N = [value]`
- Positioned at the top-left of each graph
---
### Detailed Analysis
#### Row 1: `T_m = 2`
1. **N = 53M**:
- Real loss drops from ~12 to ~3.5 by 10 tokens, then stabilizes.
- Pred loss follows a similar trajectory but remains ~0.5 higher.
2. **N = 134M**:
- Real loss decreases to ~3.0 by 10 tokens.
- Pred loss plateaus slightly above Real.
3. **N = 374M**:
- Real loss reaches ~2.8 by 10 tokens.
- Pred loss converges closer to Real.
4. **N = 778M**:
- Real loss drops to ~2.5 by 10 tokens.
- Pred loss remains marginally higher.
5. **N = 1.36B**:
- Real loss stabilizes at ~2.2.
- Pred loss closely matches Real.
#### Row 2: `T_m = 4`
1. **N = 53M**:
- Real loss decreases to ~3.2 by 10 tokens.
- Pred loss remains ~0.3 higher.
2. **N = 134M**:
- Real loss reaches ~2.9 by 10 tokens.
- Pred loss converges.
3. **N = 374M**:
- Real loss drops to ~2.6 by 10 tokens.
- Pred loss aligns with Real.
4. **N = 778M**:
- Real loss stabilizes at ~2.4.
- Pred loss slightly exceeds Real.
5. **N = 1.36B**:
- Real loss reaches ~2.1.
- Pred loss closely matches Real.
#### Row 3: `T_m = 8`
1. **N = 53M**:
- Real loss decreases to ~3.0 by 10 tokens.
- Pred loss remains ~0.2 higher.
2. **N = 134M**:
- Real loss drops to ~2.7 by 10 tokens.
- Pred loss converges.
3. **N = 374M**:
- Real loss reaches ~2.5 by 10 tokens.
- Pred loss aligns with Real.
4. **N = 778M**:
- Real loss stabilizes at ~2.3.
- Pred loss slightly exceeds Real.
5. **N = 1.36B**:
- Real loss reaches ~2.0.
- Pred loss closely matches Real.
---
### Key Observations
1. **Loss Reduction**: All graphs show a sharp decline in loss within the first 10 tokens, followed by stabilization.
2. **Model Size Impact**: Larger `N` values (e.g., 1.36B) consistently achieve lower final loss compared to smaller models (e.g., 53M).
3. **Parameter Correlation**: Higher `T_m` values (8 > 4 > 2) correlate with lower final loss across all `N` values.
4. **Pred vs. Real**: The "Pred" line consistently overestimates "Real" loss by ~0.1–0.5, suggesting potential calibration issues in predictions.
5. **Anomalies**: The first graph (`T_m=2, N=53M`) shows a minor spike in Real loss at ~5 tokens, likely noise.
---
### Interpretation
- **Model Scaling**: Larger models (`N`) and higher `T_m` values improve loss reduction, indicating better performance with increased capacity or training steps.
- **Prediction Bias**: The persistent gap between "Pred" and "Real" loss suggests the prediction mechanism may overestimate uncertainty or misalign with actual outcomes.
- **Efficiency Tradeoff**: While larger models perform better, the diminishing returns (e.g., 778M vs. 1.36B) highlight potential inefficiencies in scaling.
- **Parameter Role**: `T_m` likely represents a critical hyperparameter (e.g., time steps, attention windows) that significantly impacts model efficacy.
This analysis underscores the importance of balancing model size, training parameters, and prediction calibration for optimal performance.