## Grouped Bar Chart: Performance Comparison of Embedding Methods Across Benchmarks
### Overview
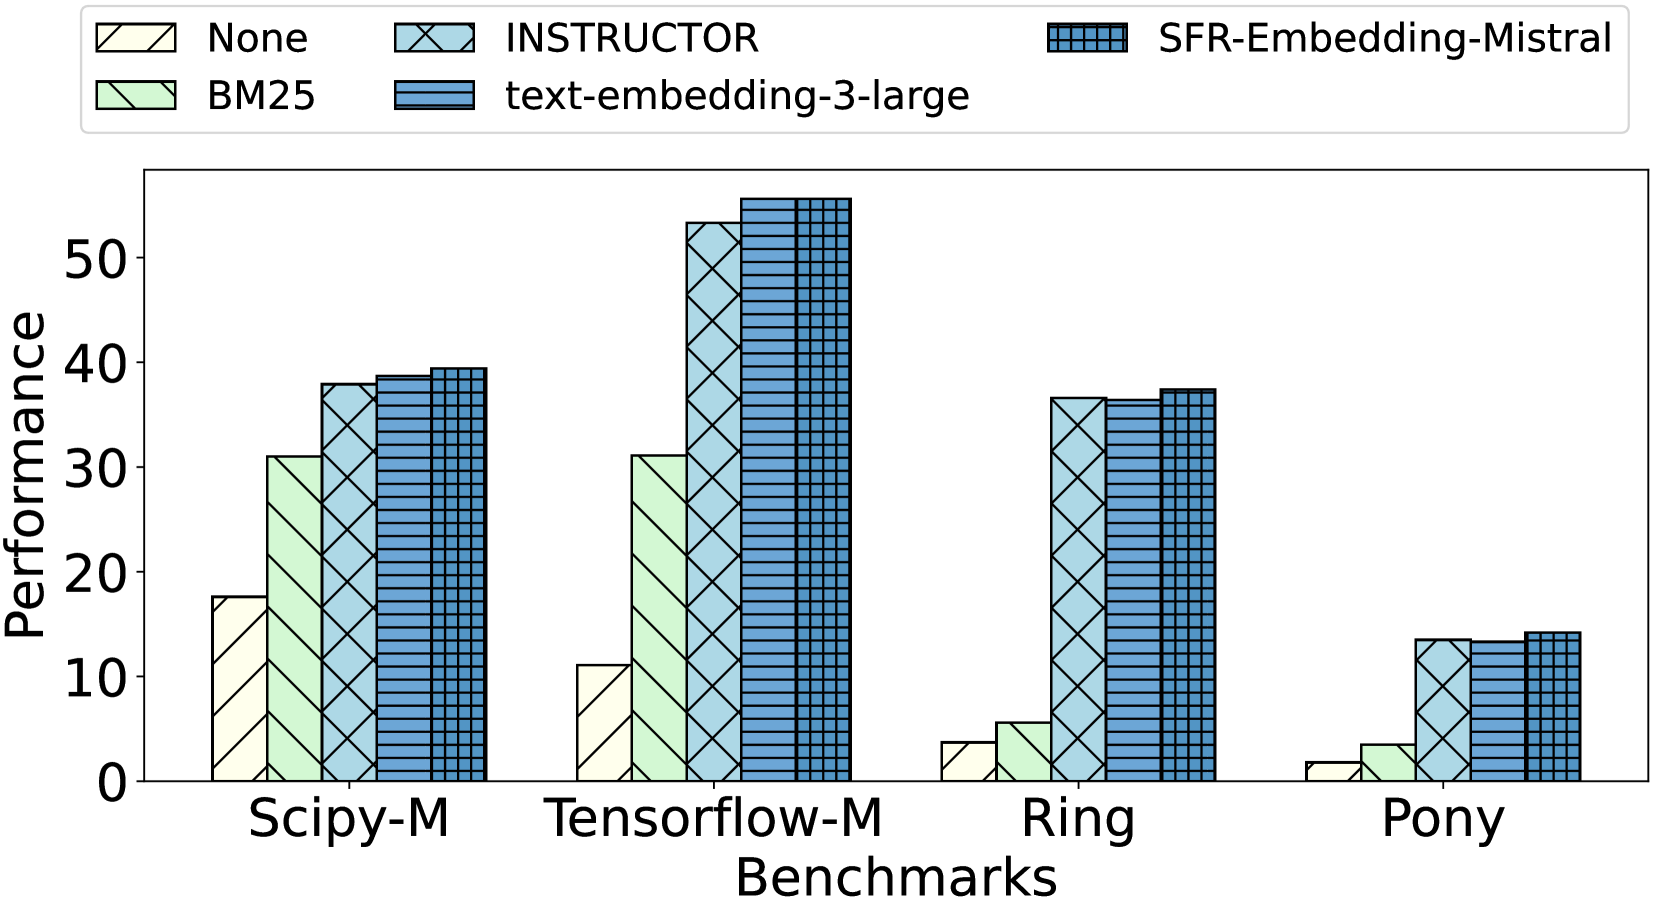
This image is a grouped bar chart comparing the performance of five different information retrieval or embedding methods across four distinct benchmarks. The chart visually demonstrates how each method performs relative to the others within each benchmark category.
### Components/Axes
* **Chart Type:** Grouped Bar Chart.
* **X-Axis (Horizontal):** Labeled "Benchmarks". It contains four categorical groups:
1. `Scipy-M`
2. `Tensorflow-M`
3. `Ring`
4. `Pony`
* **Y-Axis (Vertical):** Labeled "Performance". It is a linear scale with major tick marks at intervals of 10, ranging from 0 to 50.
* **Legend:** Positioned at the top of the chart, above the plot area. It defines five data series, each with a unique color and hatch pattern:
* **None:** Light yellow/cream fill with diagonal hatching (`\`).
* **BM25:** Light green fill with diagonal hatching (`\`).
* **INSTRUCTOR:** Light blue fill with cross-hatching (`X`).
* **text-embedding-3-large:** Medium blue fill with horizontal hatching (`-`).
* **SFR-Embedding-Mistral:** Dark blue fill with a grid/checkered hatch pattern (`+`).
### Detailed Analysis
Performance values are approximate, estimated from the bar heights relative to the y-axis.
**1. Benchmark: Scipy-M**
* **None:** ~18
* **BM25:** ~31
* **INSTRUCTOR:** ~38
* **text-embedding-3-large:** ~39
* **SFR-Embedding-Mistral:** ~40
* *Trend:* Performance increases progressively from "None" to "SFR-Embedding-Mistral".
**2. Benchmark: Tensorflow-M**
* **None:** ~11
* **BM25:** ~31
* **INSTRUCTOR:** ~53
* **text-embedding-3-large:** ~56
* **SFR-Embedding-Mistral:** ~56
* *Trend:* A significant performance jump occurs between "BM25" and the three advanced embedding models ("INSTRUCTOR", "text-embedding-3-large", "SFR-Embedding-Mistral"), which perform very similarly at the top.
**3. Benchmark: Ring**
* **None:** ~4
* **BM25:** ~6
* **INSTRUCTOR:** ~37
* **text-embedding-3-large:** ~36
* **SFR-Embedding-Mistral:** ~38
* *Trend:* "None" and "BM25" show very low performance. The three advanced models show a dramatic increase and cluster closely together in the high 30s.
**4. Benchmark: Pony**
* **None:** ~2
* **BM25:** ~4
* **INSTRUCTOR:** ~14
* **text-embedding-3-large:** ~14
* **SFR-Embedding-Mistral:** ~15
* *Trend:* All methods show their lowest performance on this benchmark. The relative pattern holds: "None" and "BM25" are very low, while the three advanced models are higher and similar to each other.
### Key Observations
1. **Consistent Hierarchy:** Across all four benchmarks, the performance order is consistent: `None` < `BM25` < `INSTRUCTOR` ≈ `text-embedding-3-large` ≈ `SFR-Embedding-Mistral`.
2. **Performance Clustering:** The three advanced embedding models (`INSTRUCTOR`, `text-embedding-3-large`, `SFR-Embedding-Mistral`) consistently form a high-performing cluster, with minimal differences between them in most benchmarks.
3. **Benchmark Difficulty:** The benchmarks appear to have varying levels of difficulty. `Tensorflow-M` yields the highest absolute performance scores for the top models, while `Pony` yields the lowest scores for all methods.
4. **Baseline Performance:** The `None` and `BM25` methods serve as baselines. `BM25` consistently outperforms `None`, but both are significantly outperformed by the neural embedding models, especially on the `Ring` and `Pony` benchmarks.
### Interpretation
This chart provides a clear comparative analysis of retrieval/embedding techniques. The data suggests that modern neural embedding models (`INSTRUCTOR`, `text-embedding-3-large`, `SFR-Embedding-Mistral`) offer a substantial and consistent performance advantage over traditional lexical methods (`BM25`) and a no-retrieval baseline (`None`) across diverse technical domains (implied by benchmarks named after libraries like Scipy and Tensorflow).
The near-identical performance of the three top models indicates a potential performance ceiling or convergence in capability for this specific evaluation task. The significant drop in scores for the `Pony` benchmark suggests it may represent a more challenging or out-of-domain task for all evaluated methods. The chart effectively argues for the adoption of advanced embedding models over traditional baselines for the tasks represented by these benchmarks.