## Comparative Analysis of Training Methods
### Overview
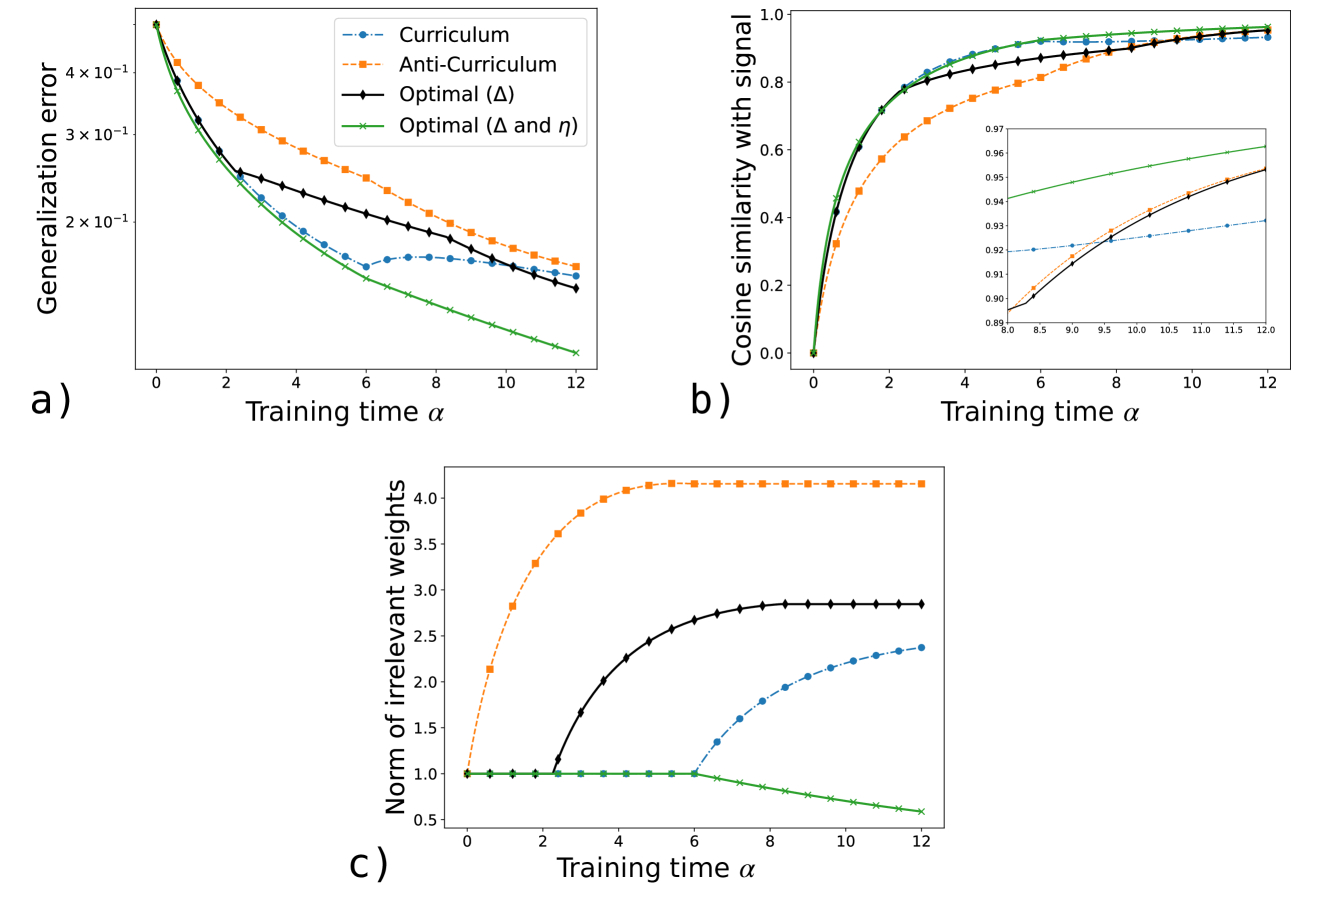
The image presents three line graphs comparing the performance of four different training methods: Curriculum, Anti-Curriculum, Optimal (Δ), and Optimal (Δ and η). The graphs depict Generalization error, Cosine similarity with signal, and Norm of irrelevant weights, all plotted against Training time (α).
### Components/Axes
**Common Elements:**
* **X-axis:** Training time α, ranging from 0 to 12 in all three graphs.
* **Legend (Top-Right of Figure A):**
* Blue dashed line with circular markers: Curriculum
* Orange dashed line with square markers: Anti-Curriculum
* Black solid line with diamond markers: Optimal (Δ)
* Green solid line with cross markers: Optimal (Δ and η)
**Graph a) Generalization Error:**
* **Y-axis:** Generalization error, ranging from approximately 0 to 4 x 10<sup>-1</sup>.
**Graph b) Cosine Similarity with Signal:**
* **Y-axis:** Cosine similarity with signal, ranging from 0 to 1.0.
* **Inset:** A zoomed-in view of the cosine similarity between 8.0 and 12.0, and 0.89 to 0.97.
**Graph c) Norm of Irrelevant Weights:**
* **Y-axis:** Norm of irrelevant weights, ranging from 0.5 to 4.0.
### Detailed Analysis
**Graph a) Generalization Error:**
* **Curriculum (Blue):** Starts at approximately 0.4, decreases rapidly until α = 6, then plateaus around 0.15.
* **Anti-Curriculum (Orange):** Starts at approximately 0.45, decreases steadily to approximately 0.15 at α = 12.
* **Optimal (Δ) (Black):** Starts at approximately 0.4, decreases steadily to approximately 0.1 at α = 12.
* **Optimal (Δ and η) (Green):** Starts at approximately 0.45, decreases rapidly to approximately 0.05 at α = 12.
**Graph b) Cosine Similarity with Signal:**
* **Curriculum (Blue):** Starts at approximately 0, increases rapidly until α = 6, then plateaus around 0.95.
* **Anti-Curriculum (Orange):** Starts at approximately 0, increases rapidly until α = 4, then plateaus around 0.85.
* **Optimal (Δ) (Black):** Starts at approximately 0, increases rapidly until α = 6, then plateaus around 0.97.
* **Optimal (Δ and η) (Green):** Starts at approximately 0, increases rapidly until α = 4, then plateaus around 0.98.
**Graph c) Norm of Irrelevant Weights:**
* **Curriculum (Blue):** Starts at approximately 1.0, remains constant until α = 6, then increases to approximately 2.3 at α = 12.
* **Anti-Curriculum (Orange):** Starts at approximately 1.0, increases rapidly until α = 4, then plateaus around 4.1.
* **Optimal (Δ) (Black):** Starts at approximately 1.0, remains constant until α = 3, then increases to approximately 2.9 at α = 12.
* **Optimal (Δ and η) (Green):** Starts at approximately 1.0, remains constant until α = 6, then decreases to approximately 0.6 at α = 12.
### Key Observations
* The "Optimal (Δ and η)" method consistently achieves the lowest generalization error and highest cosine similarity with signal.
* The "Anti-Curriculum" method results in the highest norm of irrelevant weights.
* The "Curriculum" method shows a delayed increase in the norm of irrelevant weights compared to the "Anti-Curriculum" and "Optimal (Δ)" methods.
* The "Optimal (Δ and η)" method shows a decrease in the norm of irrelevant weights after a certain training time.
### Interpretation
The data suggests that the "Optimal (Δ and η)" training method is the most effective among the four, as it minimizes generalization error and maximizes cosine similarity with the signal. The "Anti-Curriculum" method, on the other hand, appears to be the least effective, as it results in the highest norm of irrelevant weights. The delayed increase in the norm of irrelevant weights for the "Curriculum" method may indicate a slower learning process compared to the "Anti-Curriculum" and "Optimal (Δ)" methods. The decrease in the norm of irrelevant weights for the "Optimal (Δ and η)" method suggests that this method is able to effectively filter out irrelevant information during training.