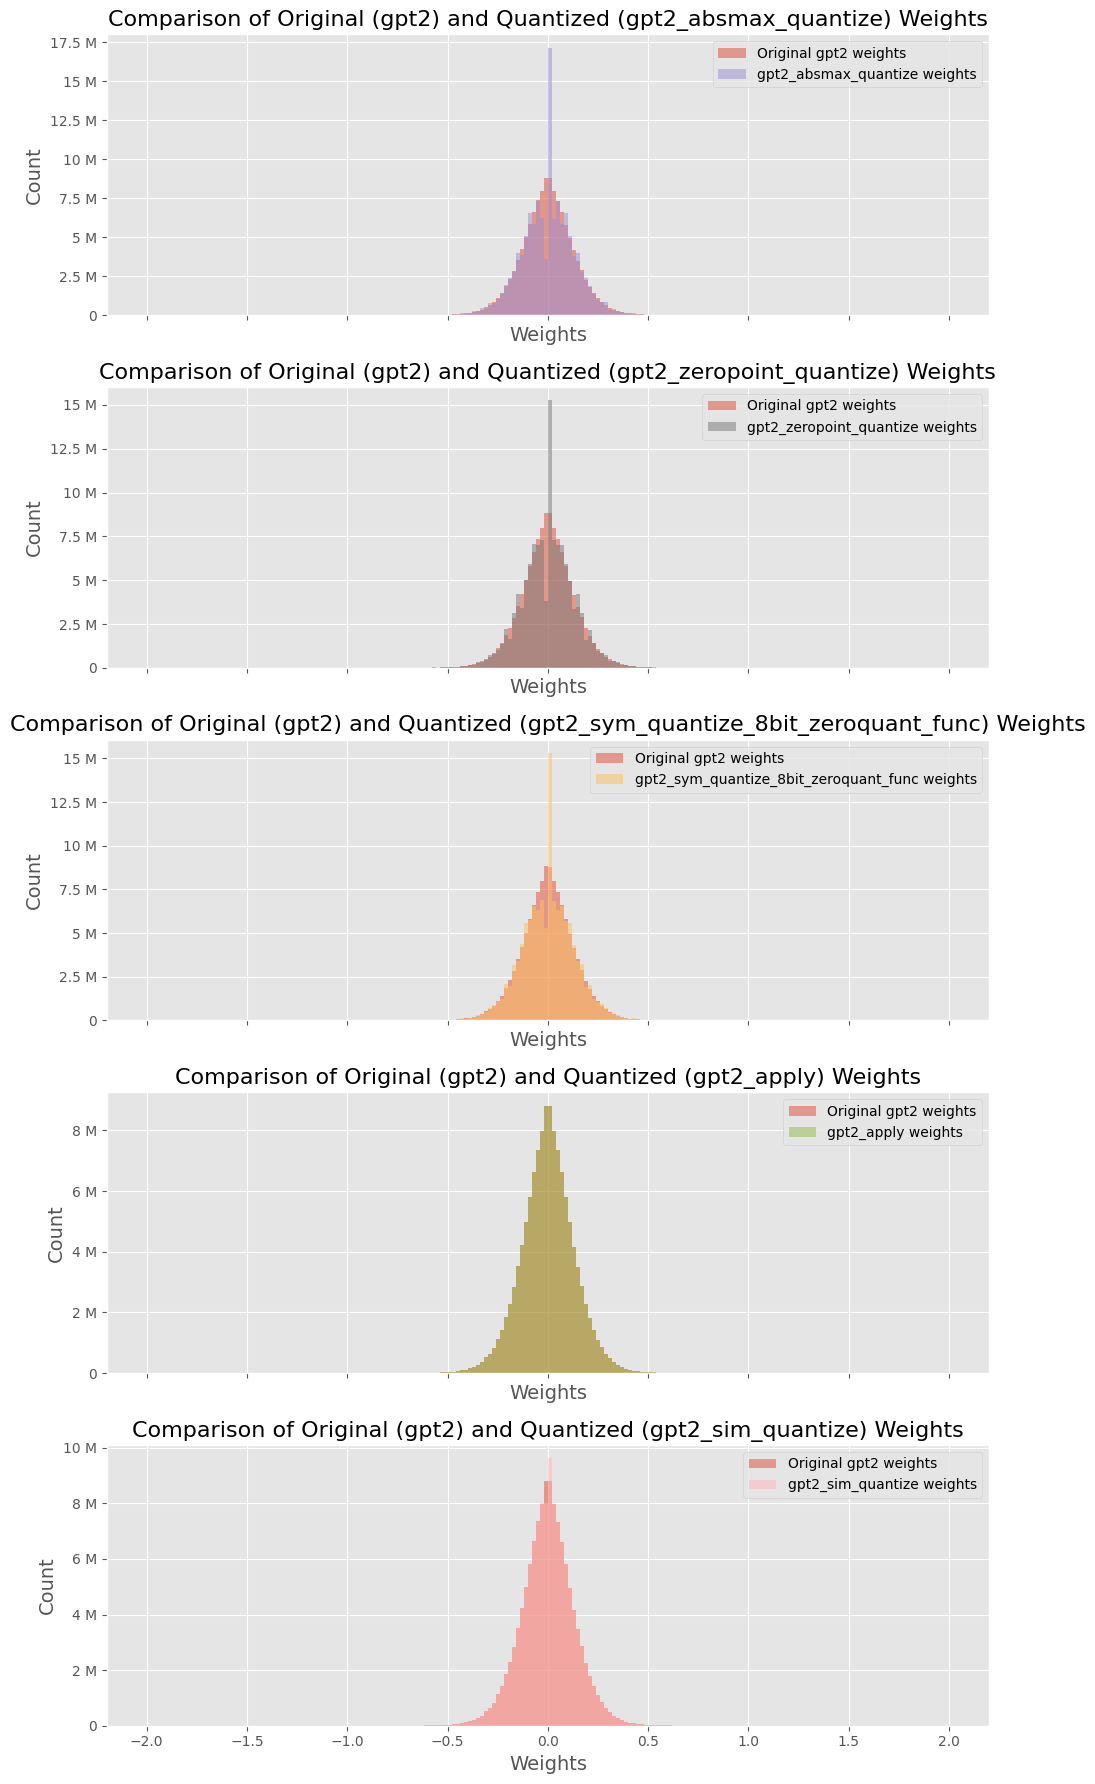
## Histograms: Comparison of Original and Quantized GPT-2 Model Weights
### Overview
The image displays five vertically stacked histograms. Each histogram compares the distribution of weight values from the original GPT-2 model against the distribution after applying a specific quantization method. The plots share a common structure: a title, a legend, and axes labeled "Weights" (x-axis) and "Count" (y-axis). The language of all text is English.
### Components/Axes
* **Titles:** Each subplot has a title following the pattern: `Comparison of Original (gpt2) and Quantized (gpt2_[method_name]) Weights`.
* **X-Axis:** Labeled `Weights`. The scale is consistent across all plots, ranging approximately from -2.0 to 2.0, with major ticks at -2.0, -1.5, -1.0, -0.5, 0.0, 0.5, 1.0, 1.5, 2.0.
* **Y-Axis:** Labeled `Count`. The scale varies between plots to accommodate the data range. Units are in millions (M).
* **Legends:** Located in the top-right corner of each subplot. Each legend contains two entries:
1. `Original gpt2 weights` (represented by a red/salmon color in all plots).
2. The specific quantized model name (represented by a unique color per plot).
### Detailed Analysis
**Plot 1 (Top): `gpt2_absmax_quantize`**
* **Legend:** Original (red), `gpt2_absmax_quantize weights` (purple).
* **Y-Axis Range:** 0 to 17.5 M.
* **Data Distribution:** Both distributions are centered at 0. The original weights form a broad, bell-shaped curve. The quantized weights (purple) form a much sharper, narrower peak centered at 0, indicating a significant concentration of weight values at or near zero after this quantization method.
**Plot 2: `gpt2_zeropoint_quantize`**
* **Legend:** Original (red), `gpt2_zeropoint_quantize weights` (gray).
* **Y-Axis Range:** 0 to 15 M.
* **Data Distribution:** Similar to Plot 1, the original distribution is broad. The quantized distribution (gray) is also sharply peaked at 0, but appears slightly less narrow than the `absmax` method in Plot 1.
**Plot 3: `gpt2_sym_quantize_8bit_zeroquant_func`**
* **Legend:** Original (red), `gpt2_sym_quantize_8bit_zeroquant_func weights` (orange).
* **Y-Axis Range:** 0 to 15 M.
* **Data Distribution:** The quantized distribution (orange) shows an extremely sharp and tall peak at 0, surpassing the height of the original distribution's peak. This suggests this symmetric 8-bit quantization method aggressively maps many weights to zero.
**Plot 4: `gpt2_apply`**
* **Legend:** Original (red), `gpt2_apply weights` (olive green).
* **Y-Axis Range:** 0 to 8 M.
* **Data Distribution:** The quantized distribution (olive green) is again centered at 0 but is notably broader and shorter than the quantized distributions in the plots above. Its peak is lower than the original's peak. This indicates the `gpt2_apply` method results in a weight distribution that more closely resembles the spread of the original, albeit still centered and likely discrete.
**Plot 5 (Bottom): `gpt2_sim_quantize`**
* **Legend:** Original (red), `gpt2_sim_quantize weights` (pink).
* **Y-Axis Range:** 0 to 10 M.
* **Data Distribution:** The quantized distribution (pink) is very similar in shape and spread to the original red distribution. Both are broad, bell-shaped curves centered at 0. The peaks are of comparable height. This suggests the `sim_quantize` method preserves the original weight distribution's shape most faithfully among the methods shown.
### Key Observations
1. **Universal Centering:** All weight distributions, both original and quantized, are symmetric and centered at zero.
2. **Quantization Effect:** Most quantization methods (`absmax`, `zeropoint`, `sym_8bit`) dramatically increase the concentration of weights at zero, creating a sharp central peak. This is a visual signature of weight clustering or sparsity induced by quantization.
3. **Method Variance:** The `gpt2_apply` method produces a quantized distribution that is less peaked than others. The `gpt2_sim_quantize` method produces a distribution nearly identical to the original.
4. **Original Consistency:** The red "Original gpt2 weights" histogram appears identical across all five subplots, serving as a consistent baseline for comparison.
### Interpretation
This image is a technical diagnostic tool for evaluating the impact of different model quantization techniques on the internal weight parameters of a GPT-2 model. Quantization is a model compression technique that reduces the precision of numerical values (weights) to decrease model size and computational requirements.
The histograms reveal the core trade-off:
* Methods like `absmax`, `zeropoint`, and especially `sym_quantize_8bit` aggressively compress the weight distribution, forcing many values to zero. This likely leads to higher compression rates but may risk losing fine-grained information, potentially affecting model accuracy.
* The `sim_quantize` method appears to be a "simulation" or a very conservative quantization that barely alters the original distribution, suggesting minimal compression but also minimal distortion.
* The `gpt2_apply` method represents a middle ground.
The choice of quantization method involves balancing the desired level of compression (smaller model, faster inference) against the tolerance for altering the model's fundamental weight distribution, which correlates with its performance. This visual analysis allows a researcher to quickly assess how "destructive" or "preservative" each quantization algorithm is with respect to the original model's parameters.