# Technical Data Extraction: Resonant Inelastic X-ray Scattering (RIXS) Spectra
This document provides a comprehensive extraction of the data and components from the provided scientific figure, which displays RIXS (Resonant Inelastic X-ray Scattering) intensity maps and line profiles.
## 1. Image Structure and Layout
The image is divided into three primary panels:
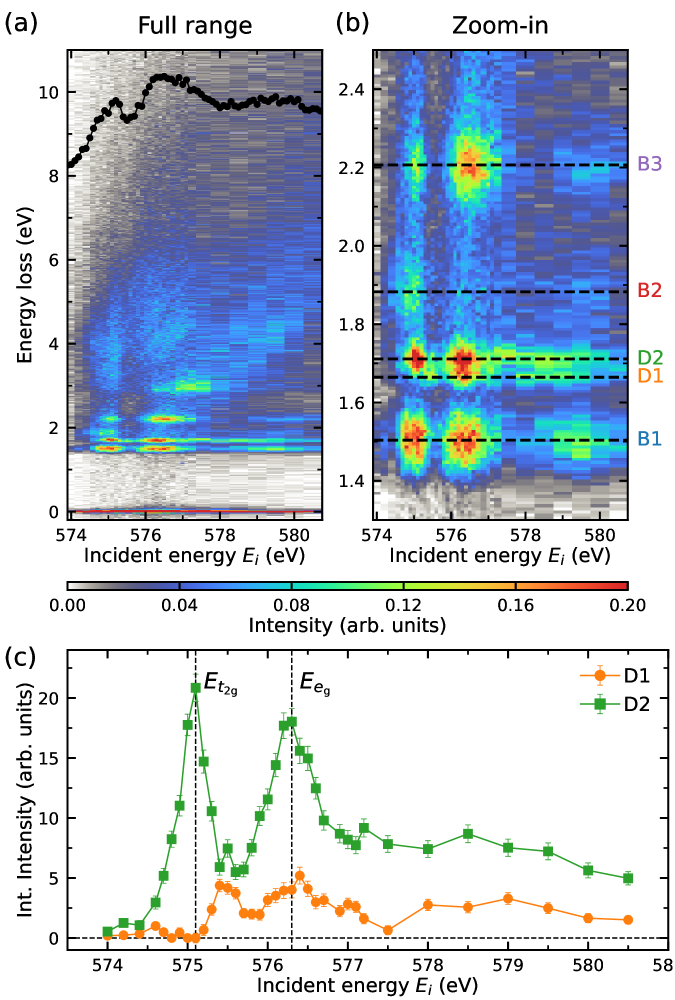
* **Panel (a) [Top Left]:** A 2D heatmap showing the "Full range" of energy loss.
* **Panel (b) [Top Right]:** A 2D heatmap showing a "Zoom-in" of a specific energy loss region.
* **Panel (c) [Bottom]:** A 1D line plot showing integrated intensity vs. incident energy.
* **Color Bar [Middle]:** A shared legend for the heatmaps in panels (a) and (b).
---
## 2. Heatmap Data (Panels a and b)
### Shared Axis and Legend Information
* **X-axis (Horizontal):** Incident energy $E_i$ (eV). Range: 574 to 581 eV.
* **Y-axis (Vertical):** Energy loss (eV).
* **Panel (a) Range:** 0 to 11 eV.
* **Panel (b) Range:** 1.3 to 2.5 eV.
* **Color Scale (Intensity):** Measured in "Intensity (arb. units)".
* **Scale Range:** 0.00 (Grey/Black) to 0.20 (Red).
* **Gradient:** Grey $\rightarrow$ Blue ($\approx$ 0.04) $\rightarrow$ Cyan ($\approx$ 0.08) $\rightarrow$ Green ($\approx$ 0.12) $\rightarrow$ Yellow ($\approx$ 0.16) $\rightarrow$ Red ($\approx$ 0.20).
### Panel (a): Full Range Analysis
* **Components:**
* **Heatmap:** Shows high-intensity features (yellow/red) concentrated between 1.5 eV and 3.0 eV energy loss.
* **Black Line Plot (Overlay):** A line with circular markers is overlaid at the top of the heatmap (approx. 8 to 10.5 eV energy loss).
* **Trend:** The line starts at ~8.2 eV (at $E_i = 574$), rises to a peak of ~9.8 eV at $E_i \approx 575.2$, dips slightly, then reaches a broad maximum of ~10.4 eV at $E_i \approx 576.5$ before leveling off around 9.8 eV for higher incident energies.
### Panel (b): Zoom-in Analysis
This panel highlights specific electronic transitions labeled with dashed horizontal lines and text markers.
* **Labeled Features (Energy Loss Positions):**
* **B3 (Purple text):** Located at Energy loss $\approx$ 2.21 eV. Shows high intensity at $E_i \approx 576.5$ eV.
* **B2 (Dark Red text):** Located at Energy loss $\approx$ 1.88 eV.
* **D2 (Green text):** Located at Energy loss $\approx$ 1.71 eV. Shows two distinct resonance peaks at $E_i \approx 575.1$ and $E_i \approx 576.3$.
* **D1 (Orange text):** Located at Energy loss $\approx$ 1.66 eV.
* **B1 (Blue text):** Located at Energy loss $\approx$ 1.50 eV. Shows two distinct resonance peaks at $E_i \approx 575.1$ and $E_i \approx 576.3$.
---
## 3. Line Plot Data (Panel c)
### Axis and Legend Information
* **X-axis:** Incident energy $E_i$ (eV). Range: 574 to 581 eV.
* **Y-axis:** Int. Intensity (arb. units). Range: 0 to 23.
* **Legend [Spatial Grounding: Top Right of Panel c]:**
* **D1 (Orange circles):** Corresponds to the orange line.
* **D2 (Green squares):** Corresponds to the green line.
### Trend Verification and Data Points
* **Series D2 (Green Squares):**
* **Trend:** Shows a sharp, dominant peak followed by a secondary peak.
* **Peak 1 ($E_{t_{2g}}$):** Reaches maximum intensity of ~21 units at $E_i \approx 575.1$ eV. This is marked by a vertical dashed line labeled **$E_{t_{2g}}$**.
* **Peak 2 ($E_{e_g}$):** Reaches a secondary maximum of ~18 units at $E_i \approx 576.3$ eV. This is marked by a vertical dashed line labeled **$E_{e_g}$**.
* **Tail:** Intensity decays to ~5 units by $E_i = 580.5$ eV.
* **Series D1 (Orange Circles):**
* **Trend:** Significantly lower intensity than D2. Shows a multi-peak structure that mirrors the resonance positions of D2 but with different relative weights.
* **Feature 1:** Small peak of ~4.5 units at $E_i \approx 575.5$ eV.
* **Feature 2:** Peak of ~5.2 units at $E_i \approx 576.4$ eV (near the $E_{e_g}$ resonance).
* **Baseline:** Remains between 1 and 4 units across the rest of the range.
---
## 4. Summary of Key Transitions
| Label | Energy Loss (eV) | Primary Resonance ($E_i$) | Color Code |
| :--- | :--- | :--- | :--- |
| **B3** | ~2.21 | ~576.5 eV | Purple |
| **B2** | ~1.88 | - | Dark Red |
| **D2** | ~1.71 | 575.1 eV ($E_{t_{2g}}$) & 576.3 eV ($E_{e_g}$) | Green |
| **D1** | ~1.66 | 576.4 eV | Orange |
| **B1** | ~1.50 | 575.1 eV & 576.3 eV | Blue |