## Grid Puzzle: Operation-Result Matrix
### Overview
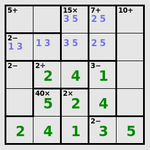
The image depicts a 5x5 grid containing numerical values and arithmetic operations. The grid is divided into cells with colored text: **blue** for operations (e.g., `5+`, `2-`, `15x`) and **green** for numerical results (e.g., `2`, `4`, `5`). A legend in the bottom-right corner identifies the color coding: **blue = Operations**, **green = Results**.
### Components/Axes
- **Grid Structure**:
- **Rows**: 5 rows, labeled implicitly by position (top to bottom).
- **Columns**: 5 columns, labeled implicitly by position (left to right).
- **Legend**:
- Located in the **bottom-right corner**.
- **Blue**: "Operations" (e.g., `5+`, `2-`, `15x`).
- **Green**: "Results" (e.g., `2`, `4`, `5`).
- **Key Labels**:
- **First Row**: Contains operations (`5+`, `15x`, `7+`, `10+`) and empty cells.
- **First Column**: Contains operations (`2-`, `2-`, `40x`, `2`) and empty cells.
- **Other Cells**: Mix of operations and results, with some empty cells.
### Detailed Analysis
- **Operations (Blue Text)**:
- **Top Row**: `5+`, `15x`, `7+`, `10+`.
- **Left Column**: `2-`, `2-`, `40x`, `2`.
- **Other Cells**: `2+`, `3-`, `2-`, `3-`.
- **Results (Green Text)**:
- **Top Row**: Empty.
- **Left Column**: Empty.
- **Other Cells**: `2`, `4`, `1`, `5`, `2`, `4`, `1`, `3`, `5`.
- **Empty Cells**:
- **Top Row**: Second and fifth columns.
- **Left Column**: Second and fifth rows.
- **Other Cells**: Third row, fourth column; fourth row, first and fifth columns.
### Key Observations
1. **Color Coding**:
- Blue text consistently represents operations (e.g., `5+`, `2-`).
- Green text consistently represents numerical results (e.g., `2`, `4`).
2. **Pattern in Results**:
- The green numbers (`2`, `4`, `1`, `5`) appear to be outcomes of the operations in their respective rows and columns.
- Example: The cell at row 2, column 2 (`2+2`) results in `4`.
3. **Missing Data**:
- Several cells are empty, suggesting incomplete or unresolved operations.
4. **Ambiguity**:
- The relationship between operations and results is not explicitly defined (e.g., whether operations apply to adjacent cells or follow a specific rule).
### Interpretation
The grid appears to function as a **logic puzzle** where operations in the first row and column are applied to numbers in the grid to produce results. For example:
- The operation `5+` in the first row might relate to the result `2` in row 2, column 1 (though the exact rule is unclear).
- The operation `2-` in the first column could correspond to the result `1` in row 3, column 3 (e.g., `2-1=1`).
- The presence of empty cells suggests the puzzle is incomplete or requires further input to resolve.
The color coding (blue for operations, green for results) provides a clear visual distinction, but the lack of explicit rules or axis labels limits the ability to fully interpret the relationships between elements. This structure resembles a **Sudoku-like puzzle** or a **mathematical grid** where operations and results are interdependent.