## Line Chart: Accuracy on Ir< (%) vs. # Iterations
### Overview
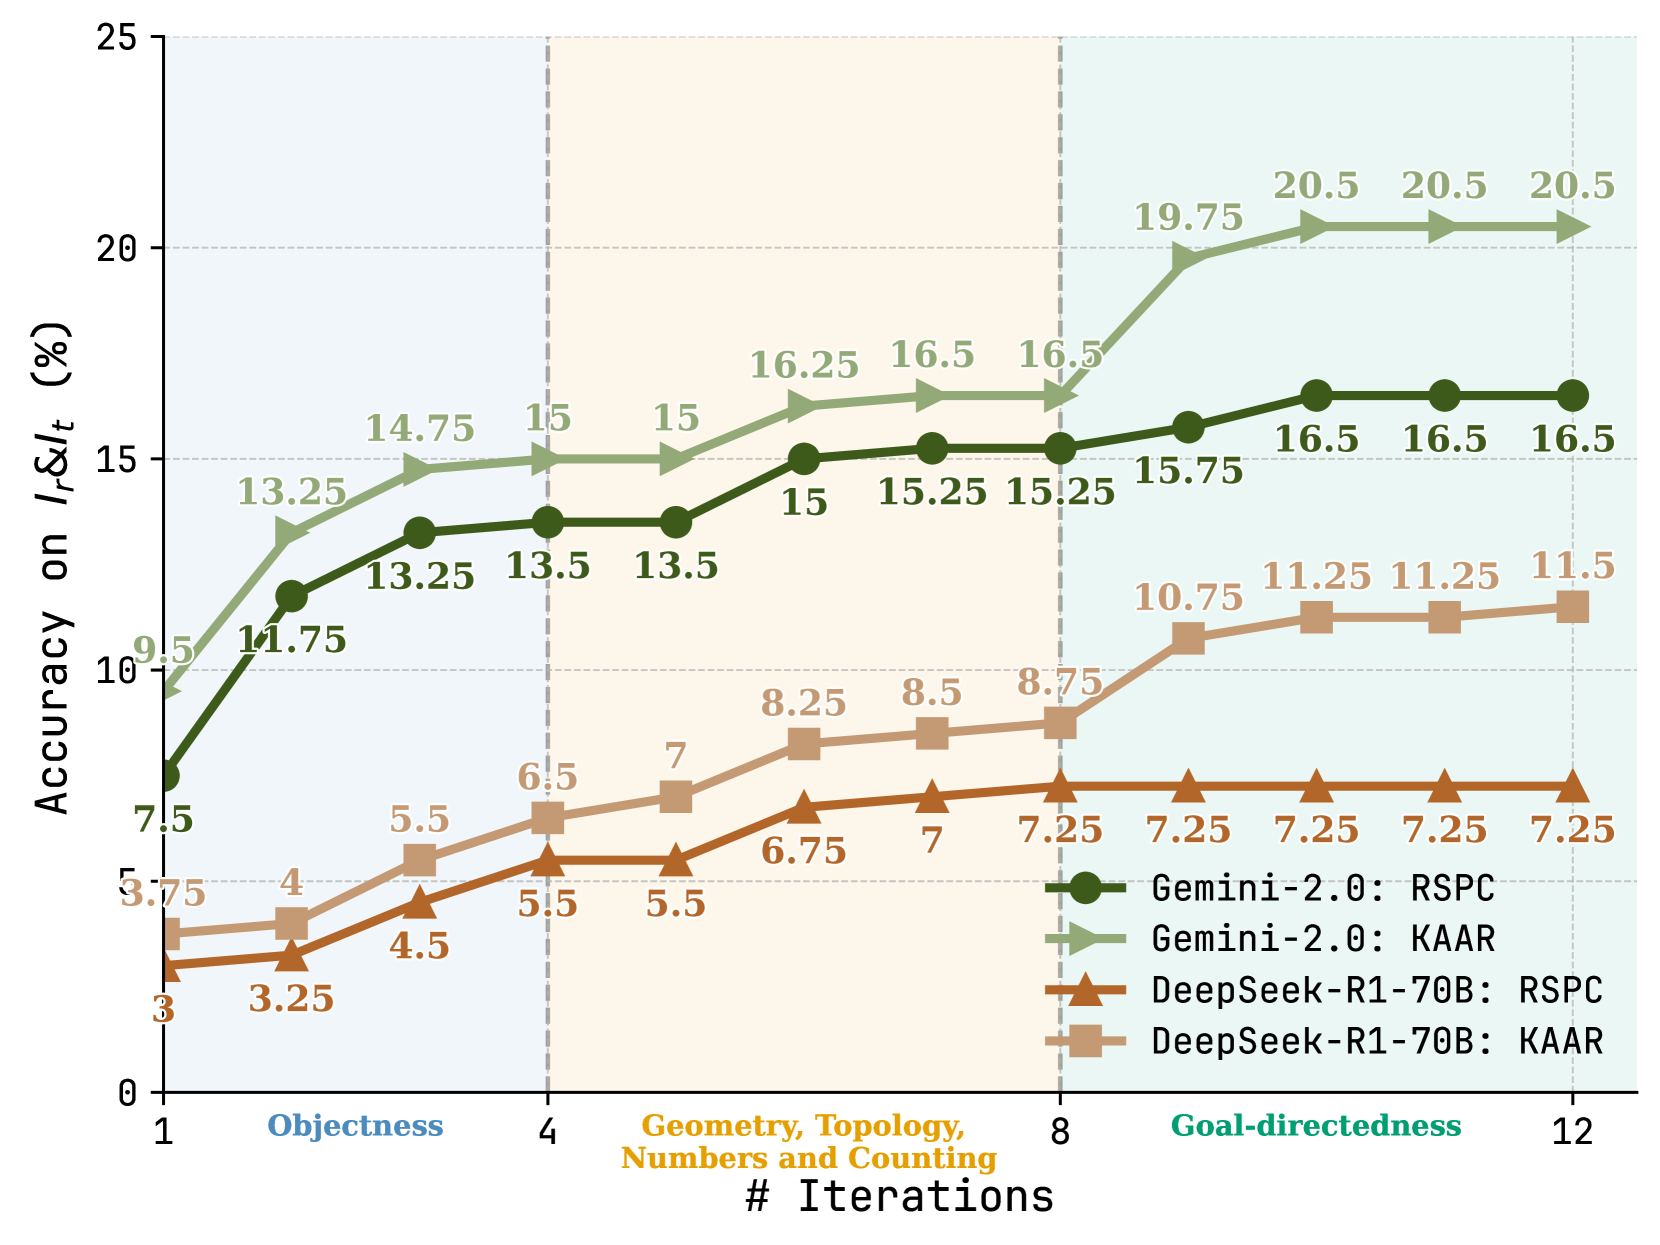
The image is a line chart comparing the accuracy of different models (Gemini-2.0 and DeepSeek-R1-70B) on various tasks (RSPC and KAAR) across an increasing number of iterations. The x-axis represents the number of iterations, and the y-axis represents the accuracy percentage. The chart is divided into three sections representing different task categories: Objectness, Geometry/Topology/Numbers and Counting, and Goal-directedness.
### Components/Axes
* **Title:** Accuracy on Ir< (%)
* **X-axis:** # Iterations, with labels 1, 4, 8, and 12. The axis is divided into three sections:
* Objectness (light blue background)
* Geometry, Topology, Numbers and Counting (light orange background)
* Goal-directedness (light green background)
* **Y-axis:** Accuracy on Ir< (%) with labels from 0 to 25, incrementing by 5.
* **Legend:** Located at the bottom-right of the chart.
* Dark Green (circle marker): Gemini-2.0: RSPC
* Light Green (triangle marker): Gemini-2.0: KAAR
* Brown (triangle marker): DeepSeek-R1-70B: RSPC
* Tan (square marker): DeepSeek-R1-70B: KAAR
### Detailed Analysis
**1. Gemini-2.0: RSPC (Dark Green Line with Circle Markers)**
* Trend: Generally increasing, plateaus after 8 iterations.
* Data Points:
* Iteration 1: 7.5%
* Iteration 4: 13.5%
* Iteration 8: 15.25%
* Iteration 12: 16.5%
**2. Gemini-2.0: KAAR (Light Green Line with Triangle Markers)**
* Trend: Increasing sharply initially, then plateaus after 8 iterations.
* Data Points:
* Iteration 1: 9.5%
* Iteration 4: 15%
* Iteration 8: 16.5%
* Iteration 12: 20.5%
**3. DeepSeek-R1-70B: RSPC (Brown Line with Triangle Markers)**
* Trend: Gradually increasing, plateaus after 8 iterations.
* Data Points:
* Iteration 1: 3%
* Iteration 4: 5.5%
* Iteration 8: 7%
* Iteration 12: 7.25%
**4. DeepSeek-R1-70B: KAAR (Tan Line with Square Markers)**
* Trend: Increasing, plateaus after 8 iterations.
* Data Points:
* Iteration 1: 3.75%
* Iteration 4: 6.5%
* Iteration 8: 8.75%
* Iteration 12: 11.5%
### Key Observations
* Gemini-2.0 models (both RSPC and KAAR) consistently outperform DeepSeek-R1-70B models across all iterations.
* The accuracy of all models tends to plateau after 8 iterations.
* Gemini-2.0: KAAR shows the highest accuracy among all models, reaching 20.5% at 12 iterations.
* DeepSeek-R1-70B: RSPC has the lowest accuracy among all models, reaching only 7.25% at 12 iterations.
* The transition from "Objectness" to "Geometry, Topology, Numbers and Counting" shows a performance increase for all models.
### Interpretation
The chart demonstrates the performance of two different models (Gemini-2.0 and DeepSeek-R1-70B) on different tasks (RSPC and KAAR) as the number of training iterations increases. The data suggests that Gemini-2.0 models are more effective than DeepSeek-R1-70B models for these specific tasks. The plateauing of accuracy after 8 iterations indicates a point of diminishing returns, suggesting that further training beyond this point may not significantly improve performance. The different task categories ("Objectness," "Geometry, Topology, Numbers and Counting," and "Goal-directedness") appear to influence the models' performance, with a noticeable jump in accuracy when transitioning from "Objectness" to the other categories. This could indicate that the models find the "Objectness" tasks more challenging or that the subsequent tasks benefit from the knowledge gained during the initial "Objectness" phase.