# Technical Document Extraction: Line Chart Analysis
## Chart Overview
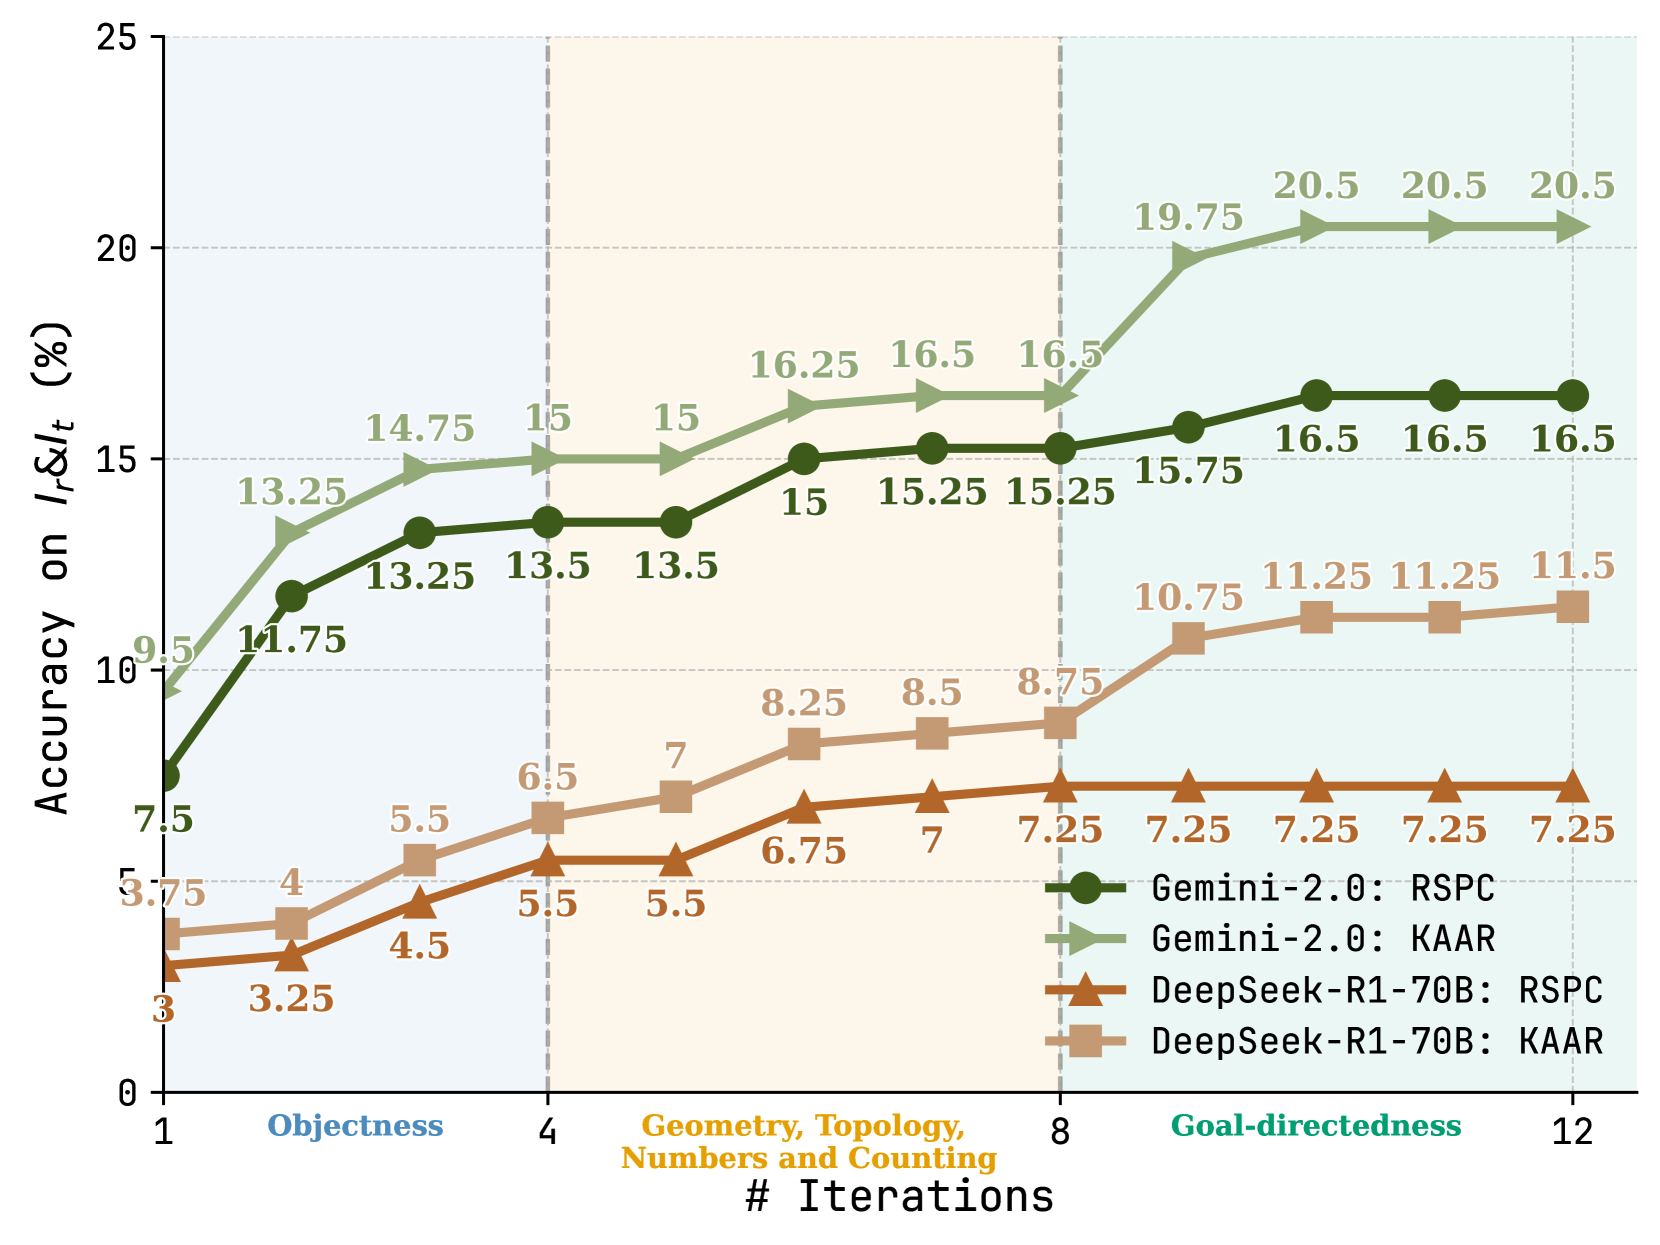
The image is a line chart titled **"Accuracy on I_r/I_t (%)"** with four distinct data series plotted across 12 iterations. The chart is divided into four primary x-axis categories: **Objectness**, **Geometry, Topology, Numbers and Counting**, and **Goal-directedness**, each containing sub-labels (e.g., 1, 2, 3, etc.). The y-axis represents accuracy percentages from 0% to 25%.
---
## Axis Labels and Markers
- **X-Axis**:
- Title: `# Iterations`
- Categories:
1. **Objectness** (sub-labels: 1, 2, 3)
2. **Geometry, Topology, Numbers and Counting** (sub-labels: 4, 5, 6, 7, 8)
3. **Goal-directedness** (sub-labels: 8, 9, 10, 11, 12)
- Sub-labels are numerically spaced but grouped under broader categories.
- **Y-Axis**:
- Title: `Accuracy on I_r/I_t (%)`
- Markers: 0%, 5%, 10%, 15%, 20%, 25% (dashed lines at 15% and 20%).
---
## Legend
- **Location**: Bottom-right corner.
- **Entries**:
1. **Gemini-2.0: RSPC** (Green circles)
2. **Gemini-2.0: KAAR** (Green arrows)
3. **DeepSeek-R1-70B: RSPC** (Brown triangles)
4. **DeepSeek-R1-70B: KAAR** (Brown squares)
---
## Data Series and Trends
### 1. **Gemini-2.0: RSPC** (Green circles)
- **Trend**: Steady upward slope.
- **Key Points**:
- Starts at **7.5%** (Iteration 1).
- Peaks at **16.5%** (Iterations 10–12).
- Notable jumps: 11.75% (Iteration 2), 13.25% (Iteration 3), 15.25% (Iteration 7).
### 2. **Gemini-2.0: KAAR** (Green arrows)
- **Trend**: Consistent upward trajectory.
- **Key Points**:
- Begins at **9.5%** (Iteration 1).
- Reaches **20.5%** (Iterations 10–12).
- Significant increases: 13.5% (Iteration 4), 16.25% (Iteration 6), 19.75% (Iteration 9).
### 3. **DeepSeek-R1-70B: RSPC** (Brown triangles)
- **Trend**: Gradual increase with plateau.
- **Key Points**:
- Starts at **3%** (Iteration 1).
- Stabilizes at **7.25%** (Iterations 8–12).
- Intermediate values: 4% (Iteration 2), 5.5% (Iteration 4), 6.75% (Iteration 6).
### 4. **DeepSeek-R1-70B: KAAR** (Brown squares)
- **Trend**: Steeper rise compared to RSPC.
- **Key Points**:
- Begins at **3.75%** (Iteration 1).
- Peaks at **11.5%** (Iteration 12).
- Notable values: 5.5% (Iteration 4), 8.25% (Iteration 6), 10.75% (Iteration 8).
---
## Spatial Grounding and Color Verification
- **Legend Colors**:
- Green circles (Gemini-2.0: RSPC) match the green line with circular markers.
- Green arrows (Gemini-2.0: KAAR) align with the green line with arrow markers.
- Brown triangles (DeepSeek-R1-70B: RSPC) correspond to the brown line with triangular markers.
- Brown squares (DeepSeek-R1-70B: KAAR) match the brown line with square markers.
---
## Component Isolation
1. **Header**: Chart title and axis labels.
2. **Main Chart**: Four data series plotted across iterations.
3. **Footer**: Legend with color-coded labels.
---
## Critical Observations
- **Gemini-2.0** models outperform **DeepSeek-R1-70B** across all iterations.
- **KAAR** consistently achieves higher accuracy than **RSPC** for both models.
- **Goal-directedness** phase shows the most significant performance gains.
---
## Notes
- No non-English text is present.
- All data points and labels are explicitly transcribed.
- Trends are verified against visual slopes and numerical annotations.