## Diagram: Broadcast and Selection Process
### Overview
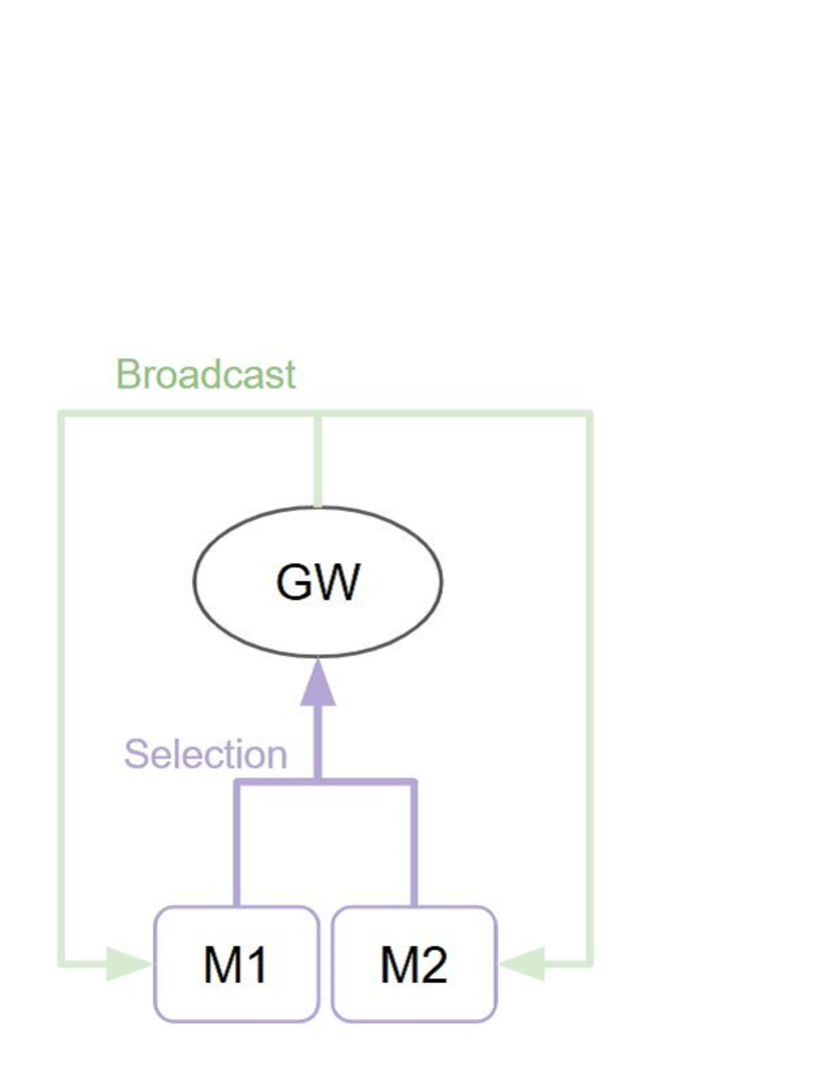
The image is a diagram illustrating a process involving broadcast and selection mechanisms. It shows two modules, M1 and M2, which are connected to a gateway (GW) through a selection process. The gateway then broadcasts back to both M1 and M2.
### Components/Axes
* **Nodes:**
* GW (Gateway): Represented by an oval shape.
* M1: Represented by a rounded rectangle.
* M2: Represented by a rounded rectangle.
* **Connections:**
* Selection: A purple line connecting M1 and M2 to GW.
* Broadcast: A light green line connecting GW to M1 and M2.
* **Labels:**
* "Broadcast" (light green, positioned above the GW node).
* "Selection" (purple, positioned between M1/M2 and GW).
### Detailed Analysis
* **Flow:**
1. M1 and M2 are connected to GW via a "Selection" process (purple line).
2. GW broadcasts back to M1 and M2 (light green line).
* **Node Shapes:**
* GW is represented as an oval.
* M1 and M2 are represented as rounded rectangles.
* **Line Colors:**
* Selection is represented by a purple line.
* Broadcast is represented by a light green line.
### Key Observations
* The diagram illustrates a two-way communication process.
* The "Selection" process seems to aggregate data from M1 and M2 to GW.
* The "Broadcast" process distributes data from GW to M1 and M2.
### Interpretation
The diagram likely represents a system where data from modules M1 and M2 is selected and aggregated at a gateway (GW). The gateway then broadcasts information back to the modules. This could represent a sensor network, a distributed computing system, or any system where data is collected, processed, and redistributed. The "Selection" process could involve filtering, prioritization, or any other mechanism for choosing which data to send to the gateway. The "Broadcast" process could involve sending updates, commands, or other information to the modules.