\n
## Scatter Plot: Confidence vs. Target Length (Management)
### Overview
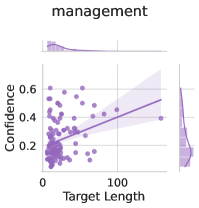
This image presents a scatter plot visualizing the relationship between "Target Length" and "Confidence" for the category "management". A regression line and confidence interval are overlaid on the scatter points. Marginal histograms are displayed above and to the right of the main plot, showing the distributions of Target Length and Confidence, respectively.
### Components/Axes
* **Title:** "management" (positioned top-center)
* **X-axis:** "Target Length" (ranging from approximately 0 to 120, with tick marks at 0 and 100)
* **Y-axis:** "Confidence" (ranging from approximately 0.15 to 0.65, with tick marks at 0.2, 0.4, and 0.6)
* **Scatter Points:** Numerous purple dots representing individual data points.
* **Regression Line:** A purple line representing the linear relationship between Target Length and Confidence.
* **Confidence Interval:** A light purple shaded area around the regression line, indicating the uncertainty in the estimated relationship.
* **Marginal Histogram (Top):** Displays the distribution of "Target Length".
* **Marginal Histogram (Right):** Displays the distribution of "Confidence".
### Detailed Analysis
The scatter plot shows a generally positive trend between Target Length and Confidence. As Target Length increases, Confidence tends to increase, although the relationship is not strong.
* **Scatter Point Distribution:** The majority of points cluster around the lower left corner of the plot (low Target Length, low Confidence). Points become more dispersed as Target Length increases.
* **Regression Line Trend:** The regression line slopes upward, indicating a positive correlation.
* **Regression Line Equation (approximate):** Visually, the line appears to intersect the Y-axis around 0.25 and has a relatively small slope.
* **Confidence Interval:** The confidence interval is wider for larger Target Length values, indicating greater uncertainty in the estimated Confidence for longer target lengths.
* **Marginal Histogram (Target Length):** The distribution of Target Length is skewed to the right, with a peak near 0 and a long tail extending to higher values.
* **Marginal Histogram (Confidence):** The distribution of Confidence is roughly symmetrical, with a peak around 0.3.
Approximate Data Points (sampled visually):
* Target Length = 0, Confidence ≈ 0.25
* Target Length = 20, Confidence ≈ 0.30
* Target Length = 50, Confidence ≈ 0.38
* Target Length = 80, Confidence ≈ 0.45
* Target Length = 100, Confidence ≈ 0.50
* Target Length = 120, Confidence ≈ 0.55
### Key Observations
* The relationship between Target Length and Confidence is weak to moderate.
* There is considerable variability in Confidence for a given Target Length.
* The marginal histograms reveal the distributions of the individual variables.
* The confidence interval widens with increasing Target Length, suggesting that the model is less certain about the predicted Confidence for longer target lengths.
### Interpretation
The data suggests that, for the "management" category, there is a slight tendency for Confidence to increase with Target Length. However, this relationship is not strong, and other factors likely influence Confidence. The wide confidence interval indicates that Target Length alone is not a reliable predictor of Confidence. The skewed distribution of Target Length suggests that most targets are relatively short, while a smaller number of targets are much longer. The marginal histograms provide insights into the distributions of the individual variables, which can be useful for understanding the overall data. The scatterplot and associated statistics provide a visual and quantitative summary of the relationship between these two variables within the context of "management".