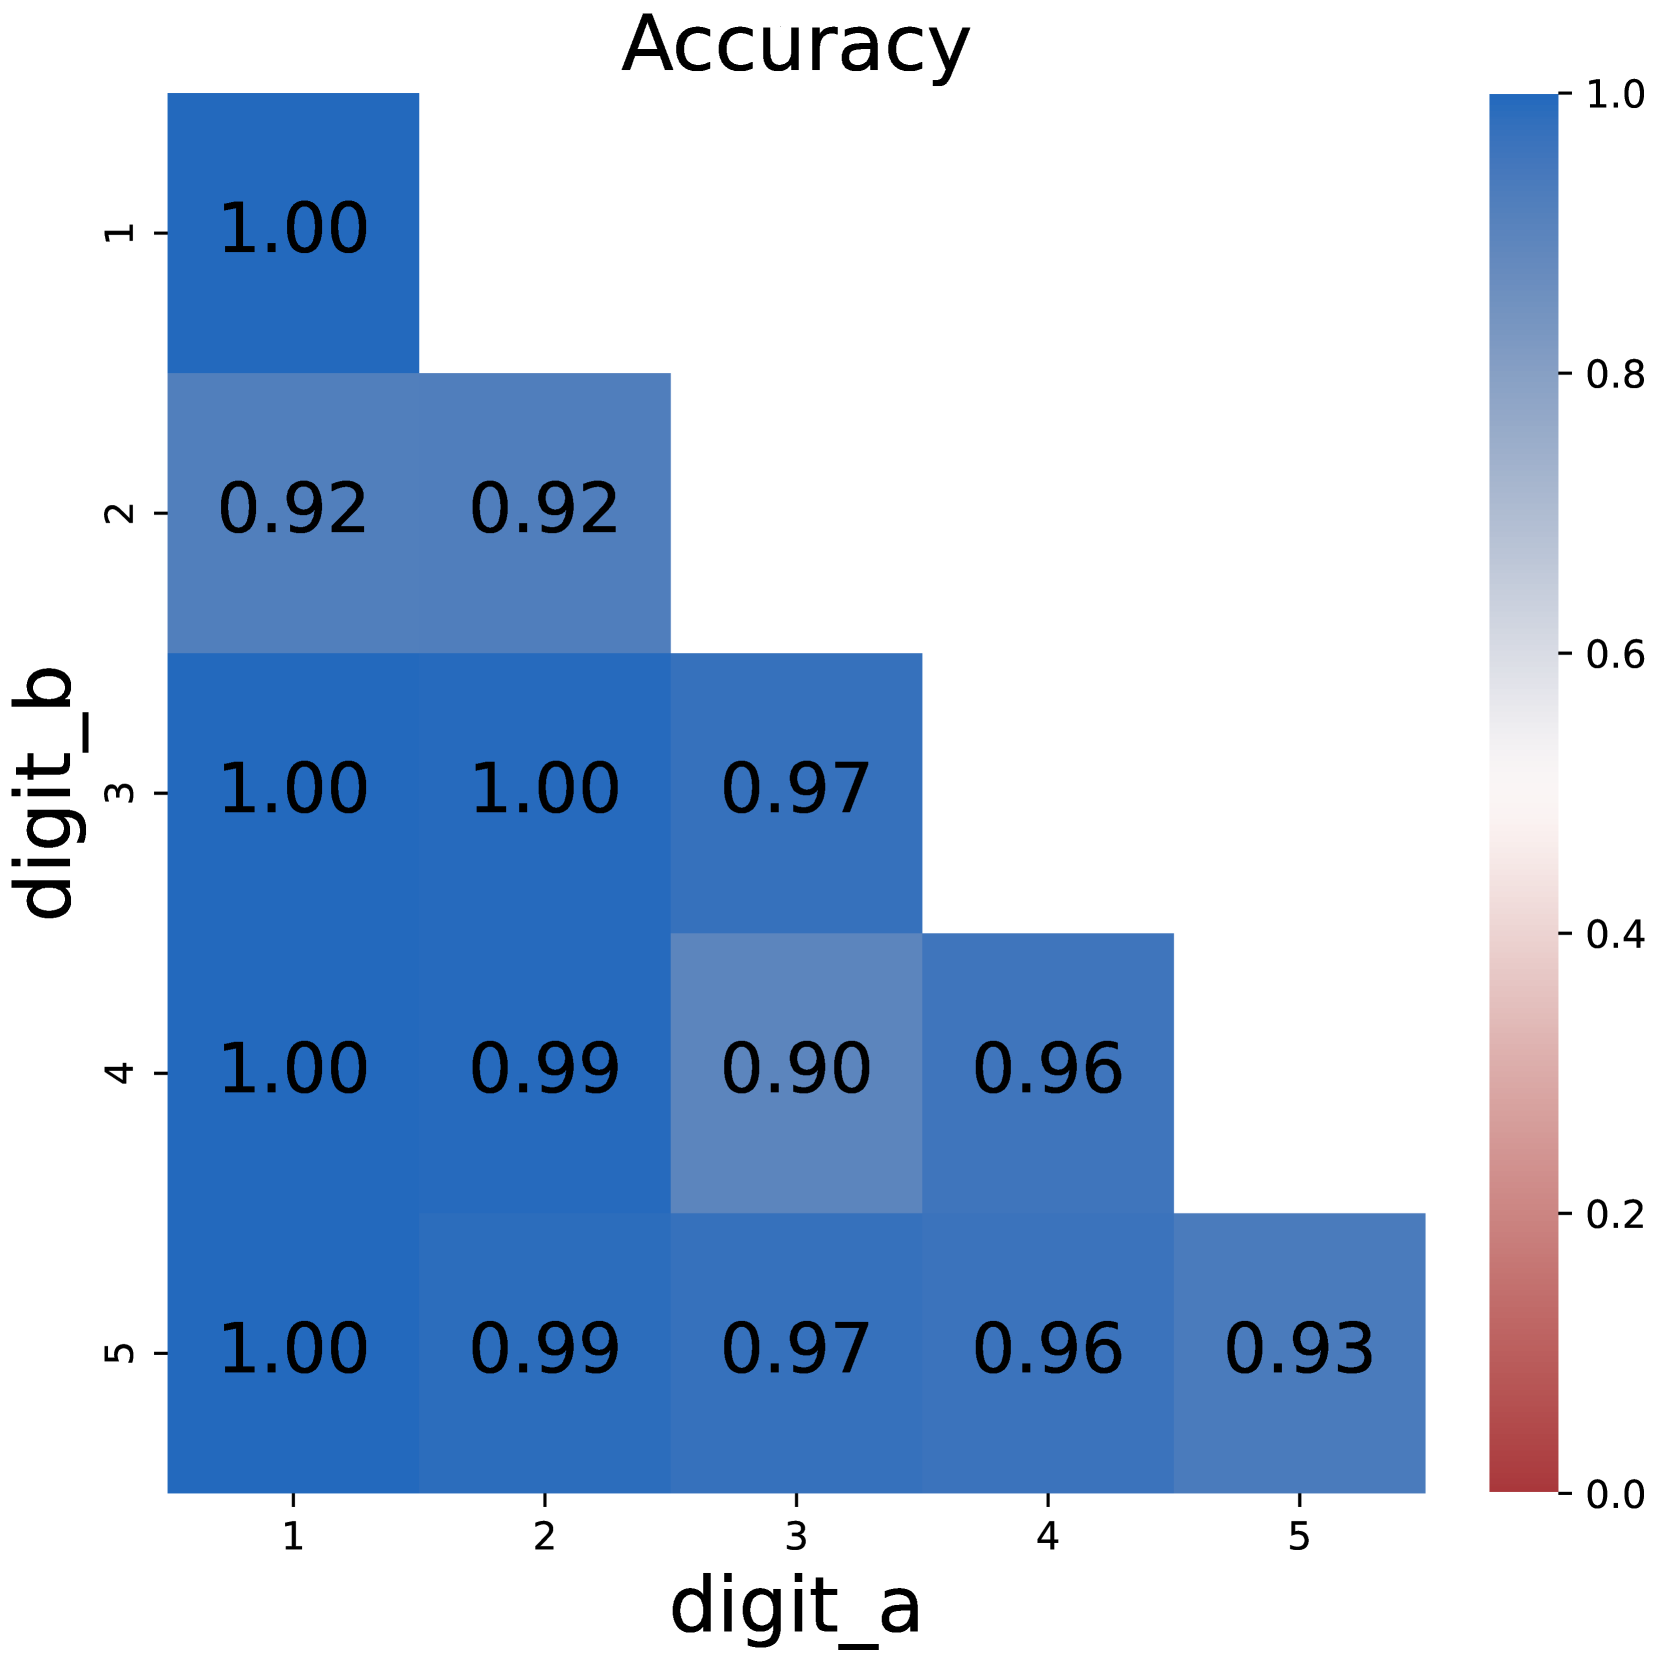
## Heatmap: Accuracy
### Overview
This image presents a heatmap visualizing the accuracy of a system, likely a digit recognition model, based on pairs of digits 'a' and 'b'. The heatmap displays accuracy values ranging from 0.0 to 1.0, with darker blue shades indicating higher accuracy.
### Components/Axes
* **Title:** "Accuracy" - positioned at the top-center of the image.
* **X-axis Label:** "digit\_a" - positioned at the bottom-center of the image. The axis markers are 1, 2, 3, 4, and 5.
* **Y-axis Label:** "digit\_b" - positioned at the left-center of the image. The axis markers are 1, 2, 3, 4, and 5.
* **Colorbar/Legend:** Located on the right side of the heatmap. It represents the accuracy scale, ranging from 0.0 (red) to 1.0 (dark blue). The colorbar has markers at 0.0, 0.2, 0.4, 0.6, 0.8, and 1.0.
### Detailed Analysis
The heatmap is a 5x5 grid, where each cell represents the accuracy for a specific pair of digits (digit\_a, digit\_b). The values are as follows:
* **(1, 1):** 1.00
* **(1, 2):** 0.92
* **(1, 3):** 1.00
* **(1, 4):** 1.00
* **(1, 5):** 1.00
* **(2, 1):** 0.92
* **(2, 2):** 0.92
* **(2, 3):** 0.97
* **(2, 4):** 0.99
* **(2, 5):** 0.97
* **(3, 1):** 1.00
* **(3, 2):** 1.00
* **(3, 3):** 0.97
* **(3, 4):** 0.90
* **(3, 5):** 0.96
* **(4, 1):** 1.00
* **(4, 2):** 0.99
* **(4, 3):** 0.90
* **(4, 4):** 0.96
* **(4, 5):** 0.93
* **(5, 1):** 1.00
* **(5, 2):** 0.99
* **(5, 3):** 0.97
* **(5, 4):** 0.96
* **(5, 5):** 0.93
The heatmap shows a generally high level of accuracy across all digit pairs. The highest accuracy values (1.00) are concentrated along the main diagonal, indicating that the system performs best when recognizing the same digit as both 'a' and 'b'. Accuracy values tend to decrease slightly as the digits 'a' and 'b' become more dissimilar.
### Key Observations
* The highest accuracy is achieved when digit\_a and digit\_b are the same (diagonal elements).
* The lowest accuracy values are around 0.90-0.92, still indicating very good performance.
* There is no significant pattern of confusion between specific digit pairs.
* The accuracy is consistently high, suggesting a robust system.
### Interpretation
This heatmap demonstrates the performance of a digit recognition system when presented with pairs of digits. The high accuracy values across the board suggest that the system is well-trained and capable of accurately identifying digits, even when they are presented in combination. The slight decrease in accuracy when the digits differ could be due to the inherent difficulty of distinguishing between certain digit shapes or the presence of noise in the input data. The consistent performance across different digit pairs indicates that the system does not exhibit a strong bias towards any particular digit. This data could be used to evaluate the effectiveness of the digit recognition model and identify areas for potential improvement. The heatmap provides a clear and concise visualization of the system's performance, making it easy to identify strengths and weaknesses.