## Line Charts: Performance Metrics vs. Number of Actions
### Overview
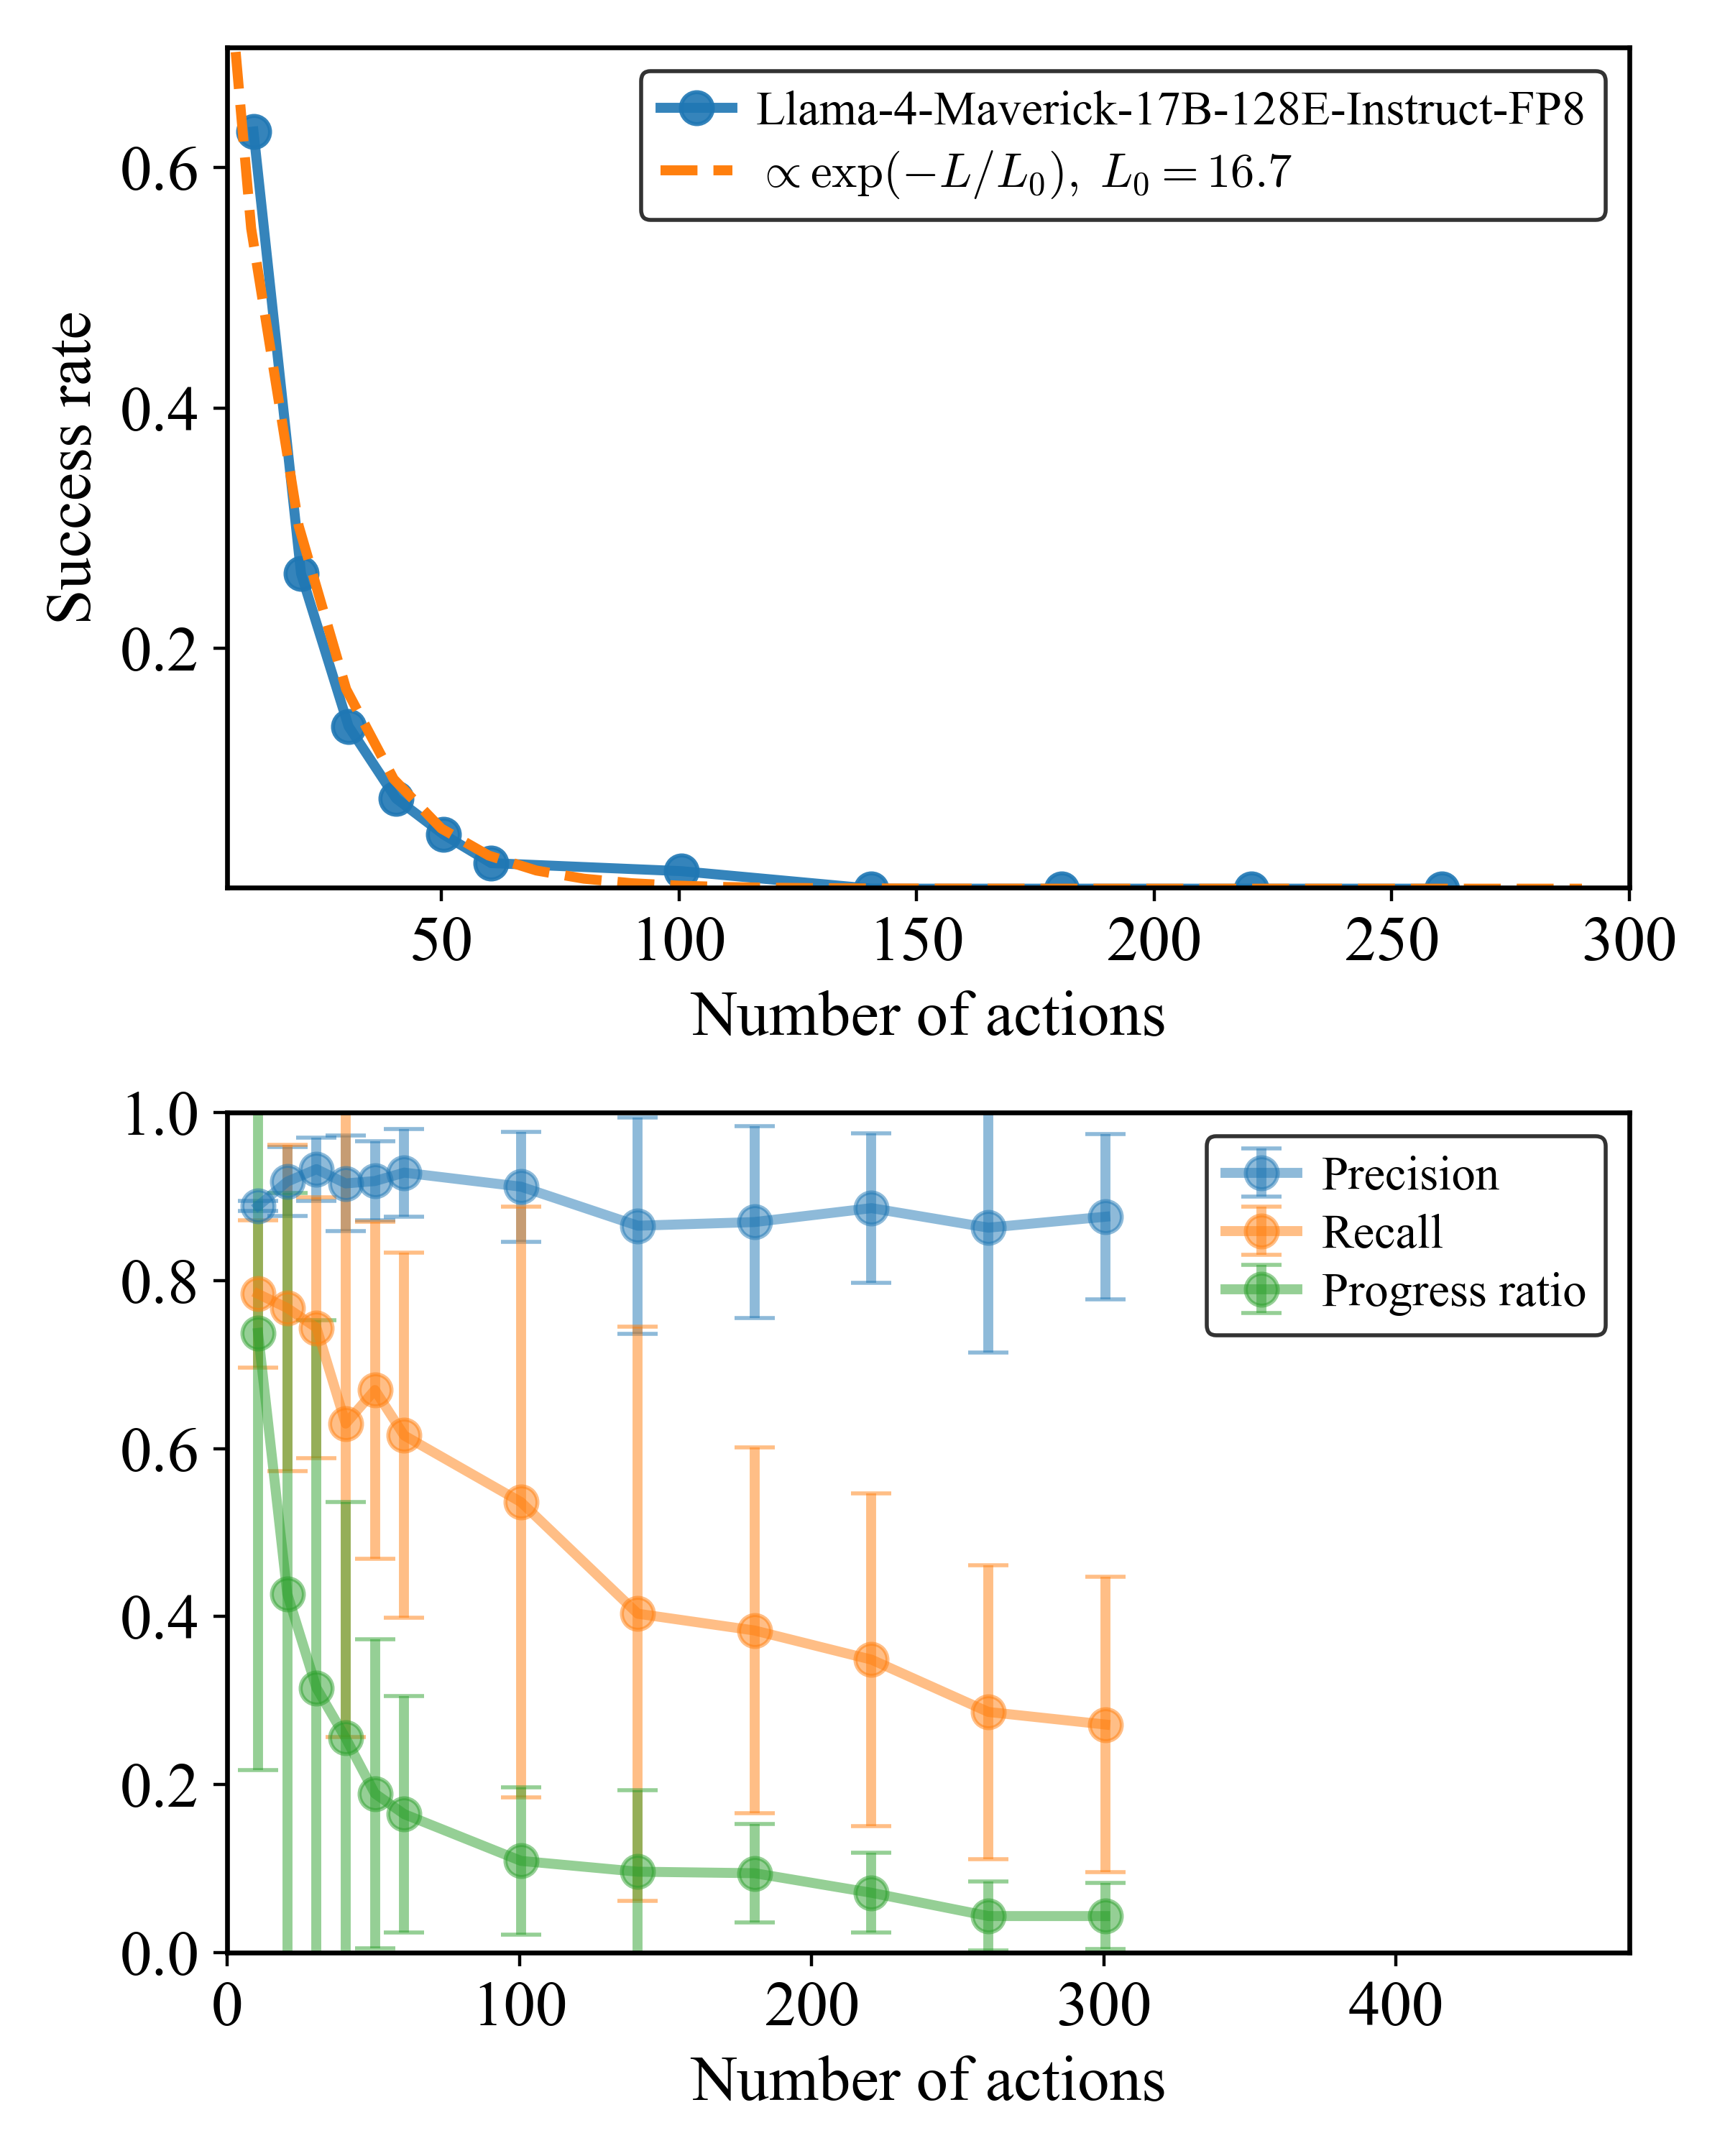
This image contains two stacked line charts illustrating the performance of an AI model (Llama-4-Maverick-17B-128E-Instruct-FP8) as the "Number of actions" increases.
* **Top Chart:** Displays the "Success rate" decay, modeled against an exponential function.
* **Bottom Chart:** Displays three distinct metrics—Precision, Recall, and Progress ratio—with associated error bars, showing how these metrics evolve as the number of actions increases.
---
### Components/Axes
#### Top Chart
* **Y-Axis:** Labeled "Success rate". Scale ranges from 0 to 0.6+.
* **X-Axis:** Labeled "Number of actions". Scale ranges from 0 to 300.
* **Legend (Top-Right):**
* Blue solid line with circular markers: "Llama-4-Maverick-17B-128E-Instruct-FP8"
* Orange dashed line: "$\propto \exp(-L/L_0), L_0 = 16.7$" (This indicates an exponential decay function where $L$ is the number of actions and $L_0$ is the decay constant).
#### Bottom Chart
* **Y-Axis:** Unlabeled (implied range 0.0 to 1.0).
* **X-Axis:** Labeled "Number of actions". Scale ranges from 0 to 400.
* **Legend (Top-Right):**
* Blue line with circular markers: "Precision"
* Orange line with circular markers: "Recall"
* Green line with circular markers: "Progress ratio"
---
### Detailed Analysis
#### Top Chart: Success Rate Decay
* **Trend:** The success rate exhibits a sharp exponential decay. It starts at its peak and drops precipitously within the first 50 actions, then plateaus near zero.
* **Data Points (Approximate):**
* At ~10 actions: Success rate is ~0.65.
* At ~20 actions: Success rate drops to ~0.27.
* At ~30 actions: Success rate is ~0.14.
* At ~40 actions: Success rate is ~0.08.
* At ~50 actions: Success rate is ~0.05.
* At ~100 actions: Success rate is ~0.03.
* At ~150–300 actions: Success rate remains consistently low, near 0.01.
#### Bottom Chart: Metric Performance
* **Precision (Blue):**
* **Trend:** Relatively stable. It starts at ~0.9 and maintains a high level throughout the range (0 to 300 actions), ending at ~0.88.
* **Uncertainty:** Large error bars are present, particularly as the number of actions increases, indicating high variance in the precision measurements.
* **Recall (Orange):**
* **Trend:** Gradual downward slope. It starts at ~0.78 and declines steadily to ~0.28 by 300 actions.
* **Uncertainty:** Significant error bars that widen as the number of actions increases.
* **Progress ratio (Green):**
* **Trend:** Sharp downward slope. It starts at ~0.75 and drops rapidly, reaching ~0.1 by 100 actions, and continues to decline to ~0.05 by 300 actions.
* **Uncertainty:** Large error bars, especially in the early stages (0–100 actions).
---
### Key Observations
1. **Exponential Decay:** The top chart confirms that the model's success rate is highly sensitive to the number of actions, following a mathematical decay curve ($L_0 = 16.7$).
2. **Precision vs. Recall Trade-off:** While the model maintains high "Precision" (it is accurate when it acts), its "Recall" and "Progress ratio" degrade significantly as the number of actions increases. This suggests the model is capable of performing correct individual steps but struggles to complete longer, multi-step sequences.
3. **High Variance:** The large error bars in the bottom chart suggest that the model's performance is inconsistent, particularly for longer sequences of actions.
---
### Interpretation
The data demonstrates a classic "context window" or "sequence length" limitation in the Llama-4-Maverick model.
* **The "Success" Problem:** The top chart shows that the probability of a successful outcome drops exponentially as the task length increases. The model is effectively "forgetting" or losing coherence after a relatively small number of actions ($L_0 = 16.7$).
* **The Nature of Failure:** The bottom chart provides the diagnostic: the model does not necessarily become "wrong" (Precision remains high), but it becomes "incomplete" (Recall and Progress ratio drop).
* **Peircean Investigative Insight:** If we read between the lines, this model is likely a "greedy" agent. It is precise in its immediate actions, but it lacks the long-term planning or state-maintenance required to sustain progress over longer sequences. The high variance (error bars) suggests that for any given task length, the model's performance is highly dependent on the specific nature of the task, rather than just the length itself.