TECHNICAL ASSET FINGERPRINT
01844003b6f5a4d4a529aef7
Click to view fullscreen
Press ESC or click to close
FOUND IN PAPERS
EXPERT: healer-alpha-free VERSION 1
RUNTIME: free/openrouter/healer-alpha
INTEL_VERIFIED
## Line Graphs: Model Performance Metrics vs. Number of Actions
### Overview
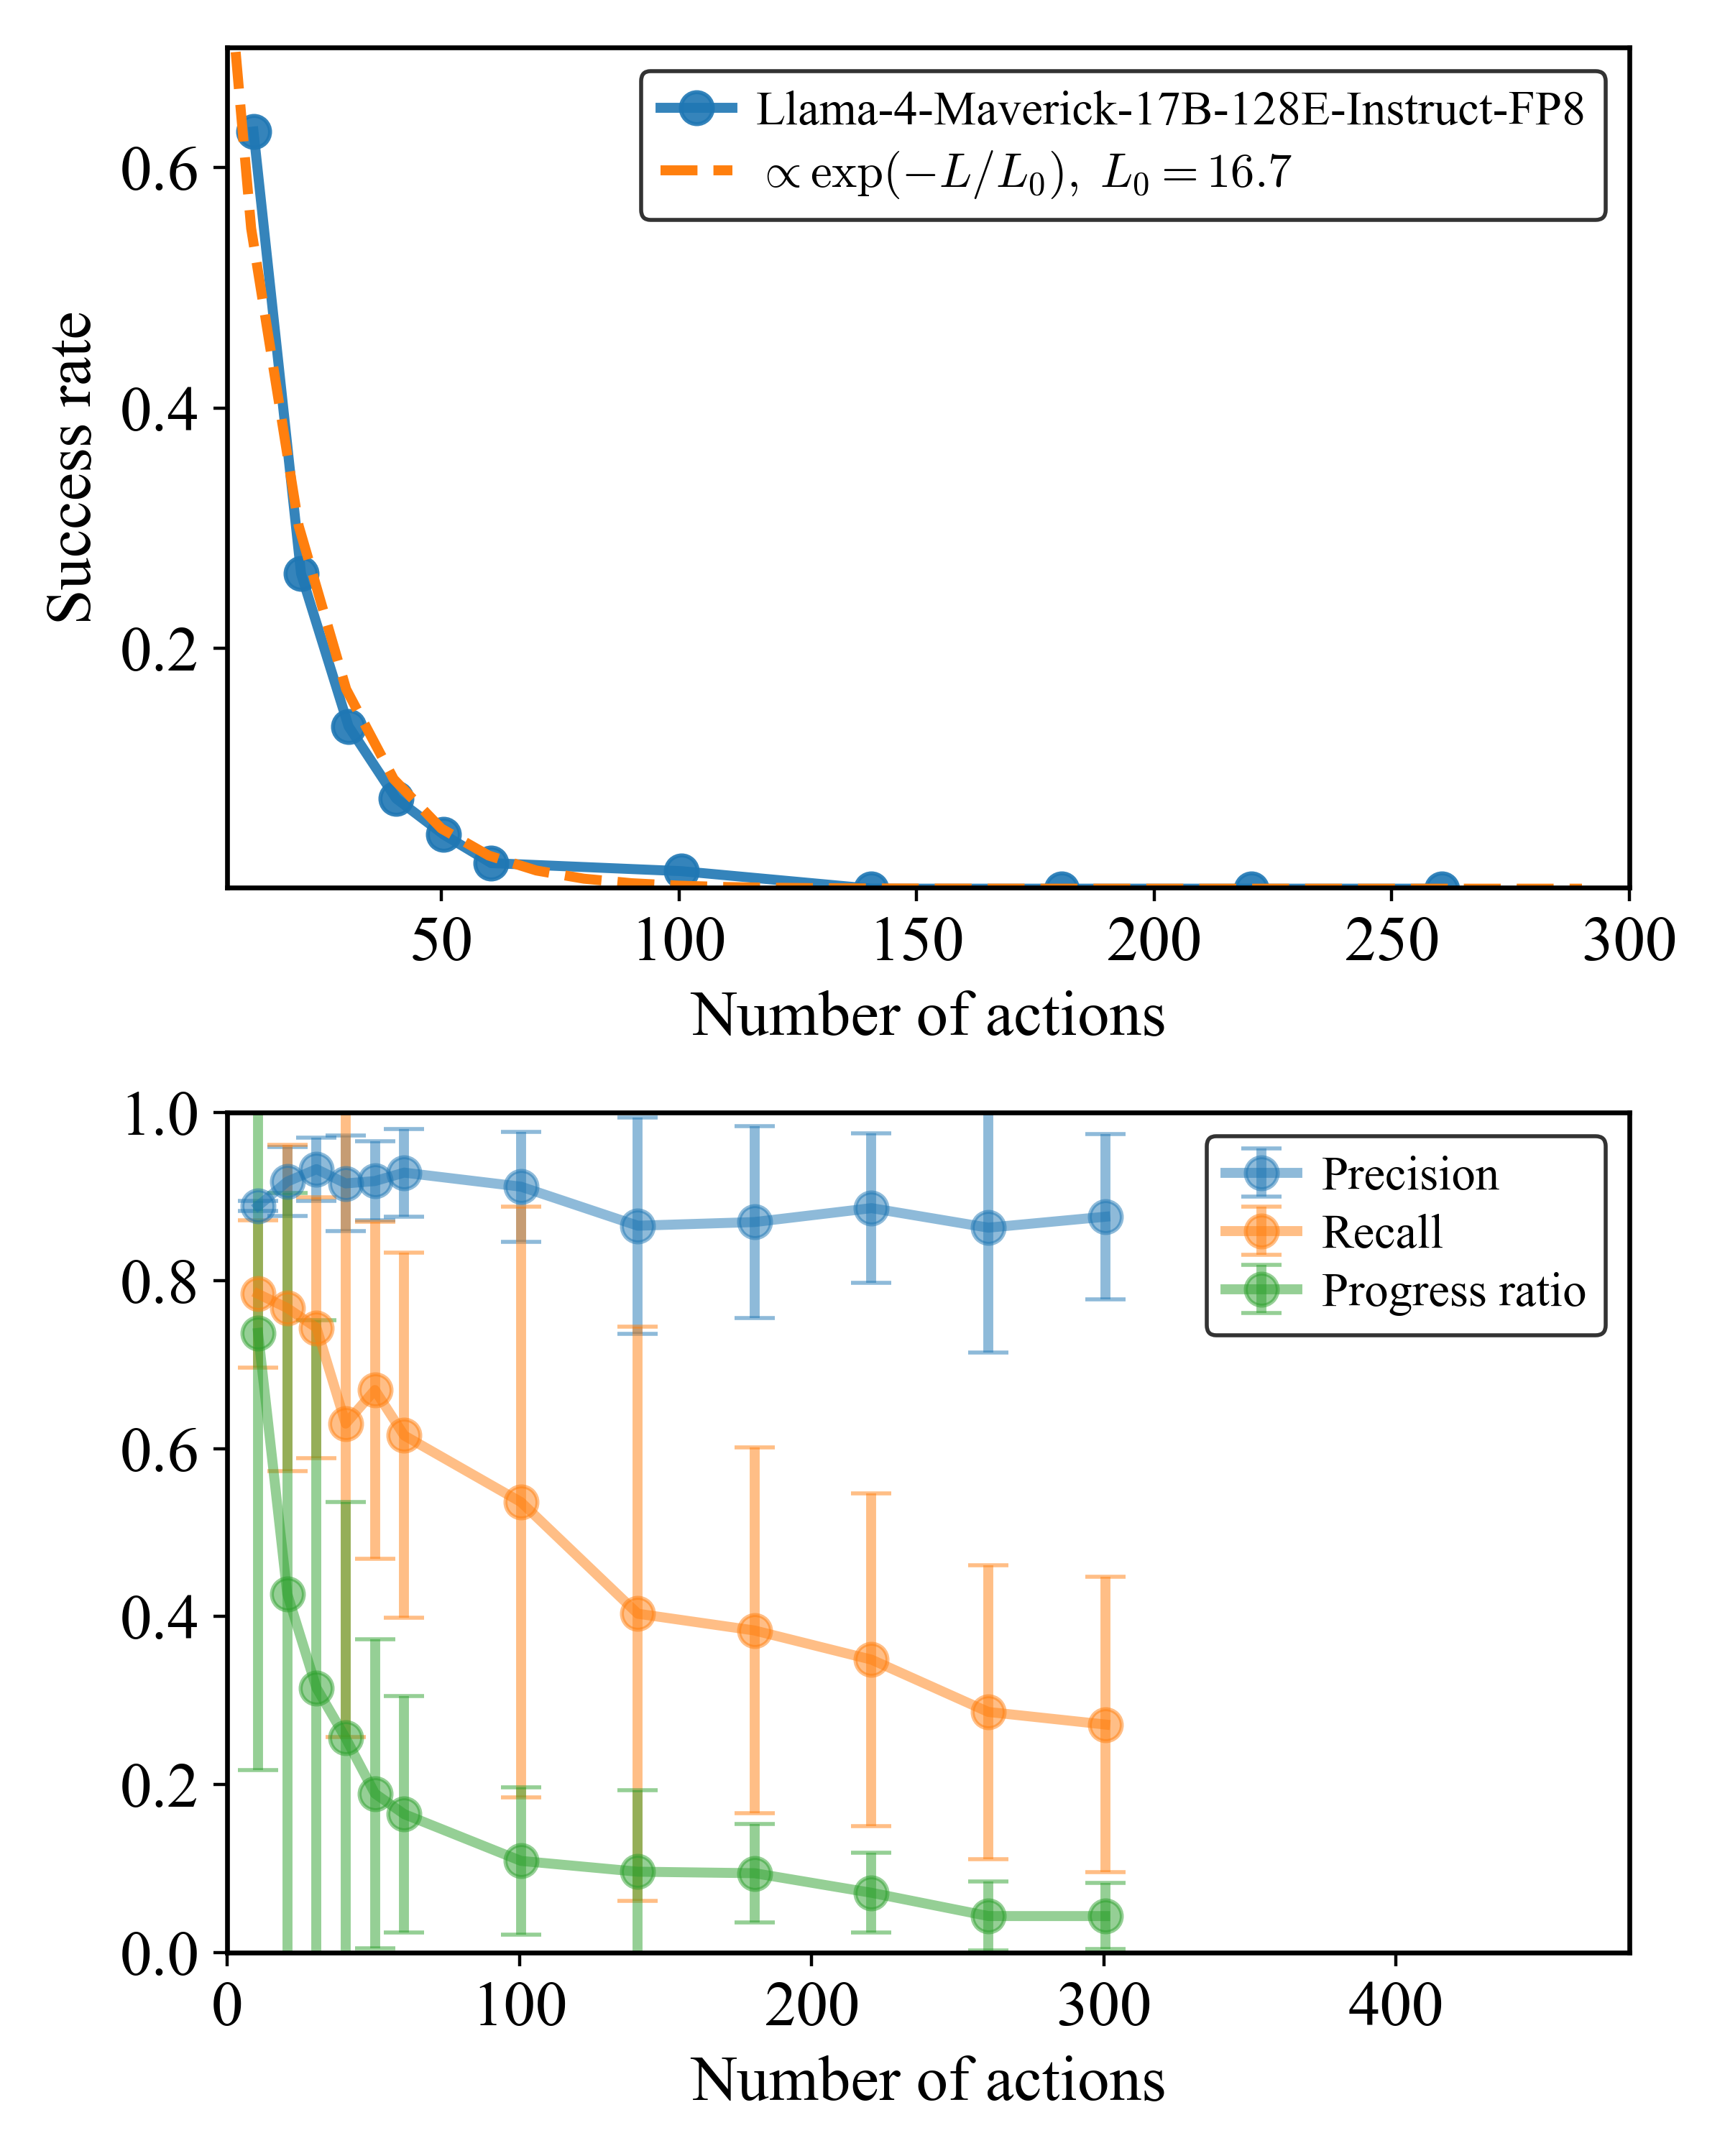
The image contains two vertically stacked line charts sharing the same x-axis ("Number of actions"). The top chart plots the "Success rate" of a specific AI model against the number of actions, accompanied by an exponential decay fit. The bottom chart plots three related performance metrics ("Precision", "Recall", "Progress ratio") against the number of actions, with error bars indicating variability.
### Components/Axes
**Top Chart:**
* **X-axis:** Label: "Number of actions". Scale: Linear, from 0 to 300, with major ticks at 0, 50, 100, 150, 200, 250, 300.
* **Y-axis:** Label: "Success rate". Scale: Linear, from 0.0 to 0.6 (approx. 0.7 at top), with major ticks at 0.0, 0.2, 0.4, 0.6.
* **Legend (Top-right corner):**
* Blue line with circle markers: "Llama-4-Maverick-17B-128E-Instruct-FP8"
* Orange dashed line: "∝ exp(−L/L₀), L₀ = 16.7"
**Bottom Chart:**
* **X-axis:** Label: "Number of actions". Scale: Linear, from 0 to 400, with major ticks at 0, 100, 200, 300, 400.
* **Y-axis:** No explicit label, but values range from 0.0 to 1.0, with major ticks at 0.0, 0.2, 0.4, 0.6, 0.8, 1.0.
* **Legend (Top-right corner):**
* Blue line with circle markers and vertical error bars: "Precision"
* Orange line with circle markers and vertical error bars: "Recall"
* Green line with circle markers and vertical error bars: "Progress ratio"
### Detailed Analysis
**Top Chart - Success Rate:**
* **Trend Verification:** The blue data series ("Llama-4-Maverick...") shows a steep, concave-upward decay. It starts high and decreases rapidly, then asymptotically approaches zero. The orange dashed line (exponential fit) follows this trend very closely.
* **Data Points (Approximate):**
* At ~10 actions: Success rate ≈ 0.63
* At ~20 actions: Success rate ≈ 0.26
* At ~30 actions: Success rate ≈ 0.14
* At ~40 actions: Success rate ≈ 0.09
* At ~50 actions: Success rate ≈ 0.06
* At ~60 actions: Success rate ≈ 0.04
* At ~100 actions: Success rate ≈ 0.02
* From ~150 to 300 actions: Success rate is very close to 0.0, with data points hovering just above the axis.
**Bottom Chart - Precision, Recall, Progress Ratio:**
* **Trend Verification:**
* **Precision (Blue):** Starts high (~0.9) and remains relatively stable, showing a very slight downward trend with large error bars.
* **Recall (Orange):** Starts moderately high (~0.8) and shows a clear, steady downward trend.
* **Progress Ratio (Green):** Starts moderately high (~0.75) and shows the steepest decline of the three metrics.
* **Data Points & Error Bars (Approximate):**
* **Precision (Blue):**
* ~10 actions: Mean ≈ 0.90, Error bar range ≈ 0.85 to 0.95
* ~50 actions: Mean ≈ 0.92, Error bar range ≈ 0.88 to 0.96
* ~100 actions: Mean ≈ 0.91, Error bar range ≈ 0.84 to 0.98
* ~200 actions: Mean ≈ 0.87, Error bar range ≈ 0.76 to 0.98
* ~300 actions: Mean ≈ 0.87, Error bar range ≈ 0.79 to 0.95
* **Recall (Orange):**
* ~10 actions: Mean ≈ 0.79, Error bar range ≈ 0.68 to 0.90
* ~50 actions: Mean ≈ 0.62, Error bar range ≈ 0.40 to 0.84
* ~100 actions: Mean ≈ 0.54, Error bar range ≈ 0.18 to 0.90
* ~200 actions: Mean ≈ 0.38, Error bar range ≈ 0.16 to 0.60
* ~300 actions: Mean ≈ 0.28, Error bar range ≈ 0.10 to 0.46
* **Progress Ratio (Green):**
* ~10 actions: Mean ≈ 0.74, Error bar range ≈ 0.22 to 1.00 (very large)
* ~50 actions: Mean ≈ 0.26, Error bar range ≈ 0.02 to 0.50
* ~100 actions: Mean ≈ 0.11, Error bar range ≈ 0.02 to 0.20
* ~200 actions: Mean ≈ 0.09, Error bar range ≈ 0.02 to 0.16
* ~300 actions: Mean ≈ 0.04, Error bar range ≈ 0.01 to 0.08
### Key Observations
1. **Strong Exponential Decay:** The success rate of the "Llama-4-Maverick" model decays exponentially with the number of actions, with a characteristic length scale (L₀) of 16.7 actions. The fit is excellent.
2. **Divergent Metric Trends:** While the model's **Precision** remains high and stable (though with high variance) as actions increase, its **Recall** and **Progress Ratio** degrade significantly. The Progress Ratio degrades the fastest.
3. **Increasing Variability:** The error bars for all three metrics in the bottom chart are substantial, particularly for Recall and Progress Ratio at lower action counts, indicating high variance in model performance across different trials or tasks.
4. **Performance Plateau:** All metrics, especially Success Rate and Progress Ratio, appear to plateau near zero after approximately 150-200 actions, suggesting a functional limit to the model's effective operational range in this context.
### Interpretation
This data demonstrates a critical limitation in the evaluated AI model's performance on sequential or multi-step tasks. The exponential decay in success rate indicates that the probability of completing a task successfully diminishes rapidly with each additional action required.
The divergence between Precision and Recall is particularly insightful. The model maintains high **Precision** (when it claims to have completed a step or identified something, it is often correct), but its **Recall** plummets (it misses an increasing number of required steps or relevant items as the task length grows). This suggests the model becomes increasingly "conservative" or "forgetful" in longer action sequences—it may avoid making incorrect predictions but at the cost of failing to complete necessary actions.
The **Progress Ratio**, which likely measures the proportion of actions that meaningfully advance the task goal, decays fastest. This implies that in longer sequences, a growing fraction of the model's actions are either redundant, corrective, or non-productive.
**In summary:** The model is reliable for short action sequences but suffers from a severe "horizon problem." Its ability to maintain goal-directed behavior and recall necessary information degrades exponentially with task length, even while the correctness of its individual, isolated predictions remains relatively stable. This highlights a fundamental challenge in scaling such models to complex, long-horizon problems. The provided exponential fit (L₀=16.7) offers a quantitative benchmark for this limitation.
DECODING INTELLIGENCE...