## Bar Chart: Normalized Performance Comparison
### Overview
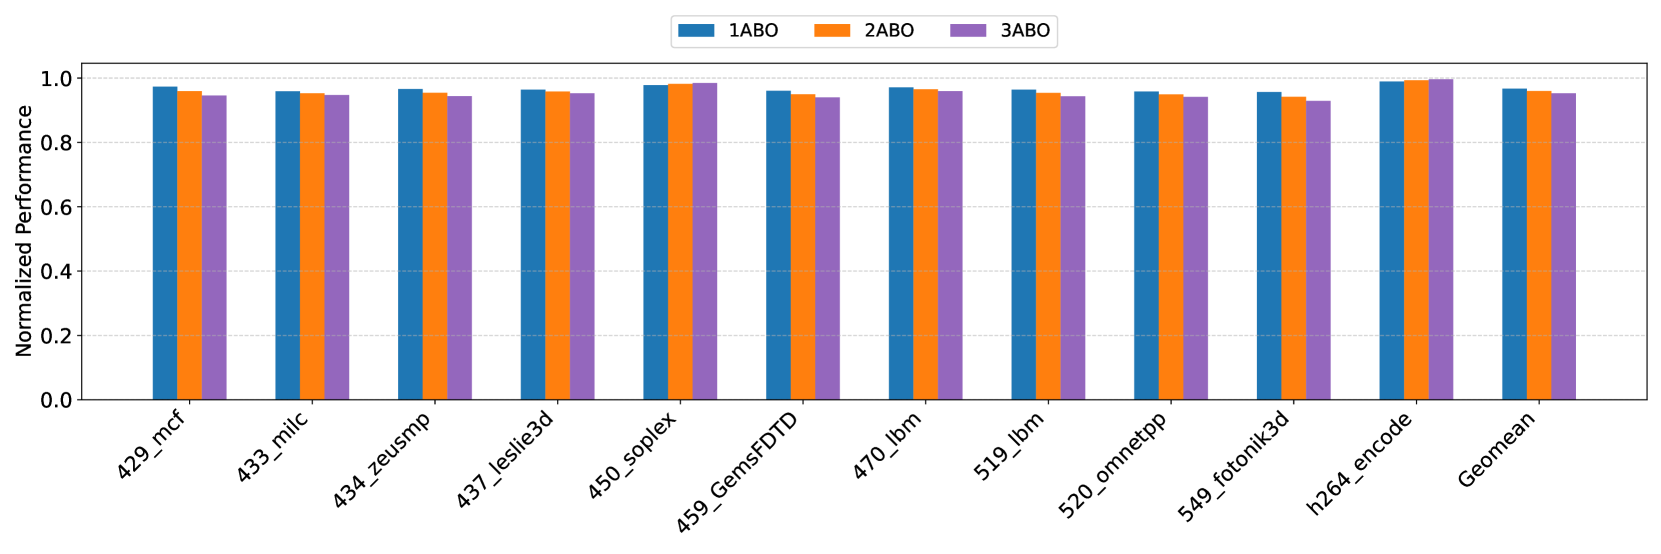
This image presents a bar chart comparing the normalized performance of three different configurations (1ABO, 2ABO, and 3ABO) across ten different datasets/benchmarks, plus a "Geomean" average. The y-axis represents normalized performance, ranging from 0.0 to 1.0, while the x-axis lists the dataset names.
### Components/Axes
* **X-axis:** Dataset/Benchmark names: 429_mcf, 433_milc, 434_zeusmp, 437_leslie3d, 450_soplex, 459_GemsFDTD, 470_lbm, 519_lbm, 520_omnetpp, 549_fotonik3d, h264_encode, Geomean.
* **Y-axis:** Normalized Performance (scale from 0.0 to 1.0).
* **Legend:** Located at the top-center of the chart, indicating the color-coding for each configuration:
* 1ABO (Blue)
* 2ABO (Orange)
* 3ABO (Purple)
### Detailed Analysis
The chart consists of grouped bar plots for each dataset. Each group contains three bars, one for each ABO configuration.
* **429_mcf:**
* 1ABO: Approximately 0.98
* 2ABO: Approximately 0.96
* 3ABO: Approximately 0.95
* **433_milc:**
* 1ABO: Approximately 0.97
* 2ABO: Approximately 0.95
* 3ABO: Approximately 0.94
* **434_zeusmp:**
* 1ABO: Approximately 0.97
* 2ABO: Approximately 0.95
* 3ABO: Approximately 0.94
* **437_leslie3d:**
* 1ABO: Approximately 0.97
* 2ABO: Approximately 0.95
* 3ABO: Approximately 0.94
* **450_soplex:**
* 1ABO: Approximately 0.97
* 2ABO: Approximately 0.95
* 3ABO: Approximately 0.94
* **459_GemsFDTD:**
* 1ABO: Approximately 0.97
* 2ABO: Approximately 0.95
* 3ABO: Approximately 0.94
* **470_lbm:**
* 1ABO: Approximately 0.97
* 2ABO: Approximately 0.95
* 3ABO: Approximately 0.94
* **519_lbm:**
* 1ABO: Approximately 0.97
* 2ABO: Approximately 0.95
* 3ABO: Approximately 0.94
* **520_omnetpp:**
* 1ABO: Approximately 0.97
* 2ABO: Approximately 0.95
* 3ABO: Approximately 0.94
* **549_fotonik3d:**
* 1ABO: Approximately 0.97
* 2ABO: Approximately 0.95
* 3ABO: Approximately 0.94
* **h264_encode:**
* 1ABO: Approximately 0.97
* 2ABO: Approximately 0.95
* 3ABO: Approximately 0.94
* **Geomean:**
* 1ABO: Approximately 0.97
* 2ABO: Approximately 0.95
* 3ABO: Approximately 0.94
**Trends:**
For all datasets and the Geomean, the 1ABO configuration consistently exhibits the highest normalized performance, followed by 2ABO, and then 3ABO. The performance difference between the configurations is relatively small, but consistent.
### Key Observations
* The performance differences between the three ABO configurations are minimal across all datasets.
* 1ABO consistently outperforms 2ABO and 3ABO.
* The Geomean performance values closely mirror the performance observed in individual datasets.
### Interpretation
The chart demonstrates that the 1ABO configuration generally achieves the best normalized performance across the tested datasets. The consistent, albeit small, performance advantage of 1ABO suggests that the specific configuration has a positive impact on performance. The relatively small differences between the configurations indicate that the performance is robust and not highly sensitive to the ABO setting. The Geomean values confirm the overall trend observed in the individual datasets. This data could be used to inform decisions about which ABO configuration to use in a production environment, with 1ABO being the preferred choice based on these results. The consistent performance across datasets suggests that the observed trend is not specific to any particular workload.