## Chart: Gradient Updates vs. Dimension
### Overview
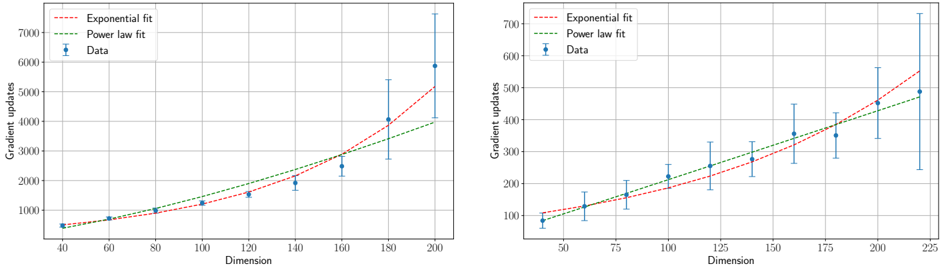
The image presents two scatter plots side-by-side, each depicting the relationship between "Gradient updates" and "Dimension." Both plots show data points with error bars, along with exponential and power-law fit curves. The left plot covers a dimension range from approximately 40 to 200, while the right plot covers a dimension range from approximately 50 to 225.
### Components/Axes
* **Left Plot:**
* X-axis: "Dimension," ranging from 40 to 200 in increments of 20.
* Y-axis: "Gradient updates," ranging from 0 to 7000 in increments of 1000.
* Legend (top-left):
* Red dashed line: "Exponential fit"
* Green dashed line: "Power law fit"
* Blue data points with error bars: "Data"
* **Right Plot:**
* X-axis: "Dimension," ranging from 50 to 225 in increments of 25.
* Y-axis: "Gradient updates," ranging from 0 to 700 in increments of 100.
* Legend (top-left):
* Red dashed line: "Exponential fit"
* Green dashed line: "Power law fit"
* Blue data points with error bars: "Data"
### Detailed Analysis
**Left Plot:**
* **Data Points (Blue):** The data points generally trend upwards as the dimension increases.
* Dimension ~40: Gradient updates ~400 +/- 100
* Dimension ~60: Gradient updates ~700 +/- 100
* Dimension ~80: Gradient updates ~900 +/- 100
* Dimension ~100: Gradient updates ~1200 +/- 100
* Dimension ~120: Gradient updates ~1500 +/- 200
* Dimension ~140: Gradient updates ~1800 +/- 200
* Dimension ~160: Gradient updates ~2000 +/- 200
* Dimension ~180: Gradient updates ~4000 +/- 1000
* Dimension ~200: Gradient updates ~5000 +/- 1000
* **Exponential Fit (Red Dashed):** The exponential fit curve also trends upwards, closely following the initial data points but diverging at higher dimensions.
* **Power Law Fit (Green Dashed):** The power law fit curve trends upwards, appearing to provide a better fit to the data at higher dimensions compared to the exponential fit.
**Right Plot:**
* **Data Points (Blue):** The data points generally trend upwards as the dimension increases.
* Dimension ~50: Gradient updates ~80 +/- 20
* Dimension ~75: Gradient updates ~120 +/- 30
* Dimension ~100: Gradient updates ~220 +/- 40
* Dimension ~125: Gradient updates ~160 +/- 50
* Dimension ~150: Gradient updates ~220 +/- 50
* Dimension ~175: Gradient updates ~360 +/- 80
* Dimension ~200: Gradient updates ~380 +/- 100
* Dimension ~225: Gradient updates ~500 +/- 200
* **Exponential Fit (Red Dashed):** The exponential fit curve trends upwards, similar to the left plot.
* **Power Law Fit (Green Dashed):** The power law fit curve trends upwards, appearing to provide a better fit to the data at higher dimensions compared to the exponential fit.
### Key Observations
* Both plots show an increasing trend in "Gradient updates" as "Dimension" increases.
* The error bars on the data points become larger at higher dimensions, indicating greater variability.
* The power law fit appears to model the data better than the exponential fit, especially at higher dimensions.
* The scale of the Y-axis (Gradient updates) differs significantly between the two plots.
### Interpretation
The plots suggest that the number of gradient updates required increases with the dimension of the problem. The increasing error bars at higher dimensions may indicate that the relationship becomes less predictable or more sensitive to other factors as the dimensionality grows. The power law fit's better performance suggests that the relationship between gradient updates and dimension is non-linear and may be characterized by a power function. The difference in scale between the two plots is not explained by the image, but it may be due to different datasets or experimental conditions.