## Diagram: Knowledge Graph to Description Text
### Overview
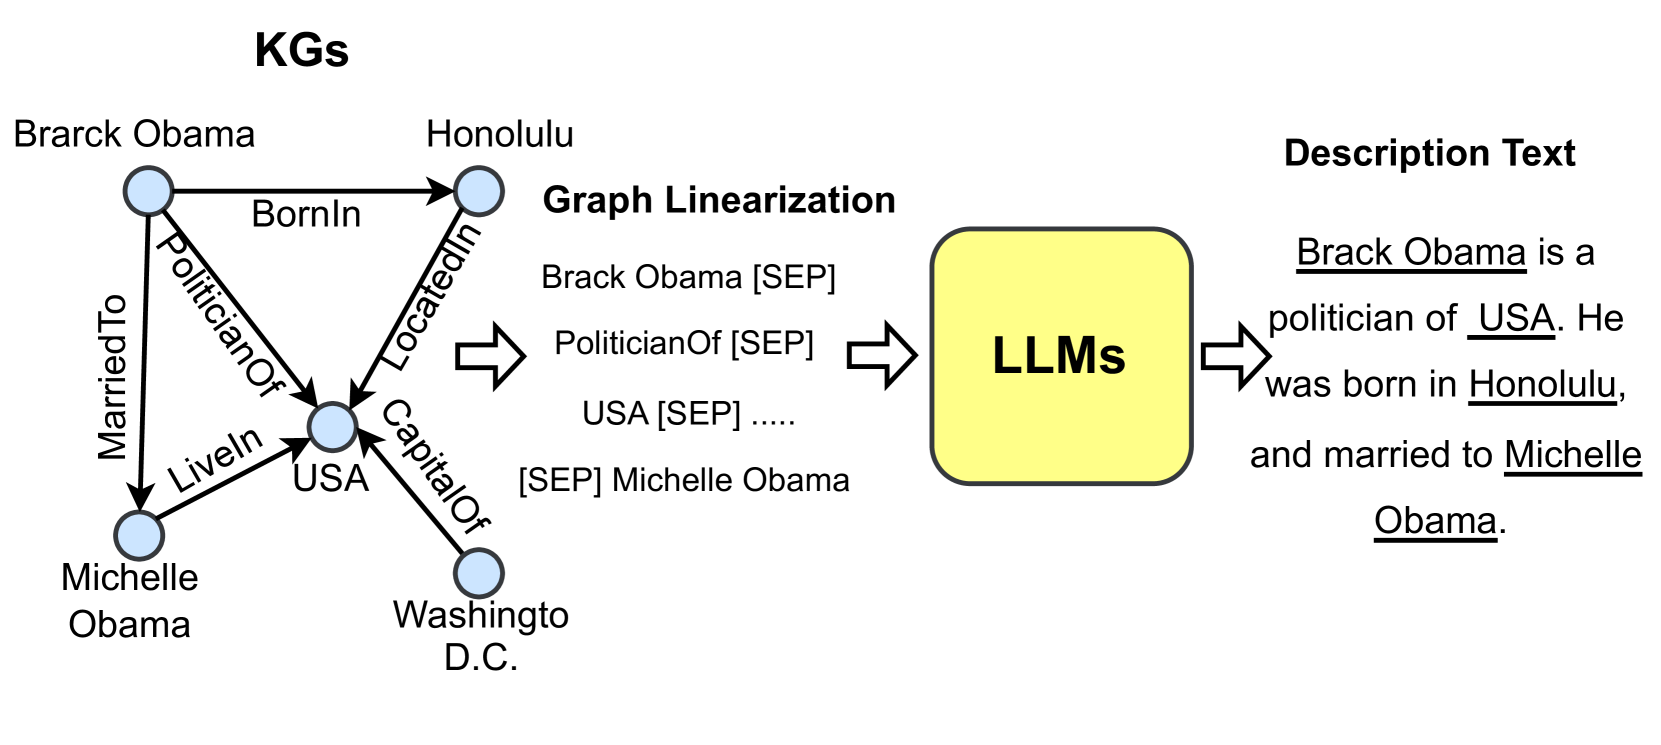
The image illustrates a process of converting a knowledge graph (KG) into a descriptive text using Large Language Models (LLMs). The process involves graph linearization as an intermediate step.
### Components/Axes
* **Title:** KGs (Knowledge Graphs)
* **Nodes in KG:**
* Brarck Obama
* Honolulu
* USA
* Washingto D.C.
* Michelle Obama
* **Edges in KG:**
* BornIn (from Brarck Obama to Honolulu)
* LocatedIn (from Honolulu to USA)
* CapitalOf (from USA to Washingto D.C.)
* MarriedTo (from Brarck Obama to Michelle Obama)
* PoliticianOf (from Brarck Obama to USA)
* LiveIn (from Michelle Obama to USA)
* **Graph Linearization:**
* Brack Obama [SEP]
* PoliticianOf [SEP]
* USA [SEP] .....
* [SEP] Michelle Obama
* **LLMs:** A yellow rounded rectangle containing the text "LLMs".
* **Description Text:**
* Brack Obama is a politician of USA. He was born in Honolulu, and married to Michelle Obama.
### Detailed Analysis or ### Content Details
1. **Knowledge Graph (KG):**
* The KG consists of five nodes: "Brarck Obama", "Honolulu", "USA", "Washingto D.C.", and "Michelle Obama". Each node is represented as a light blue circle.
* The edges represent relationships between the nodes. For example, "BornIn" connects "Brarck Obama" to "Honolulu", indicating that Barack Obama was born in Honolulu.
* The edges are directed, indicated by arrows.
2. **Graph Linearization:**
* The graph linearization step transforms the KG into a sequence of text tokens.
* The "[SEP]" token likely represents a separator or delimiter between different parts of the graph.
* The linearization includes entities and relations from the KG.
3. **LLMs:**
* The linearized graph is fed into LLMs.
* The LLMs process the input and generate a descriptive text.
4. **Description Text:**
* The output is a natural language description of the information contained in the KG.
* The description includes key facts about Barack Obama, such as his profession, place of birth, and spouse.
* Underlined words: Brack Obama, USA, Honolulu, Michelle Obama.
### Key Observations
* The diagram illustrates a pipeline for converting structured knowledge into natural language text.
* Graph linearization serves as an intermediate representation that bridges the gap between the KG and the LLMs.
* The LLMs are used to generate coherent and informative descriptions from the linearized graph.
### Interpretation
The diagram demonstrates how knowledge graphs can be used as a source of information for generating natural language descriptions. The process involves transforming the graph into a linear sequence of tokens, which can then be processed by LLMs to produce human-readable text. This approach can be useful for a variety of applications, such as automatically generating summaries of knowledge base entries or creating personalized content based on user profiles. The use of [SEP] tokens suggests a method for structuring the input to the LLM, potentially guiding the model to generate more accurate and relevant descriptions.