## Neural Network Architectures: A Comparative Diagram
### Overview
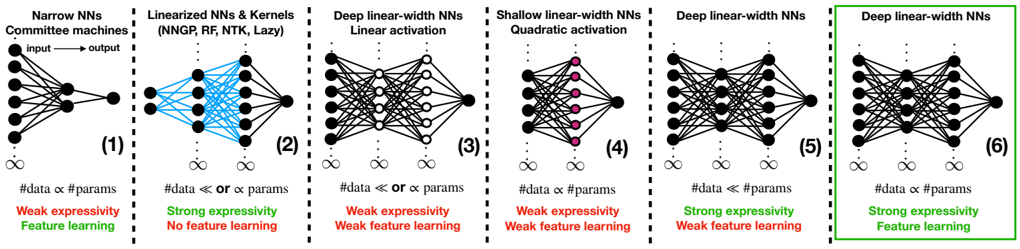
The image presents a comparative diagram of six different neural network architectures, highlighting their structural differences, data-parameter relationships, expressivity, and feature learning capabilities. Each architecture is visually represented with nodes and connections, accompanied by textual descriptions.
### Components/Axes
The diagram is divided into six distinct sections, each representing a different neural network architecture. The sections are numbered (1) through (6).
* **Titles:** Each section has a title describing the network architecture:
* (1) Narrow NNs Committee machines
* (2) Linearized NNs & Kernels (NNGP, RF, NTK, Lazy)
* (3) Deep linear-width NNs Linear activation
* (4) Shallow linear-width NNs Quadratic activation
* (5) Deep linear-width NNs
* (6) Deep linear-width NNs
* **Network Diagrams:** Each section contains a schematic diagram of the neural network, showing nodes (neurons) and connections (synapses).
* **Data-Parameter Relationship:** Each section includes a statement about the relationship between the amount of data and the number of parameters.
* **Expressivity:** Each section indicates whether the network has "Weak expressivity" or "Strong expressivity."
* **Feature Learning:** Each section indicates whether the network exhibits "Feature learning" or "No feature learning" or "Weak feature learning."
* **Infinity Symbol:** An infinity symbol is present below each network diagram.
### Detailed Analysis
**Section 1: Narrow NNs Committee machines**
* **Diagram:** A narrow network with an input layer of approximately 5 nodes, a hidden layer of approximately 5 nodes, and a single output node. Connections are dense between layers. An arrow indicates the flow from "input" to "output".
* **Data-Parameter Relationship:** "#data α #params" (Data is proportional to parameters)
* **Expressivity:** Weak expressivity
* **Feature Learning:** Feature learning
**Section 2: Linearized NNs & Kernels (NNGP, RF, NTK, Lazy)**
* **Diagram:** A network with an input layer of approximately 5 nodes, a hidden layer of approximately 5 nodes, and a single output node. The connections between the input and hidden layers are colored in blue.
* **Data-Parameter Relationship:** "#data << or α params" (Data is much less than or proportional to parameters)
* **Expressivity:** Strong expressivity
* **Feature Learning:** No feature learning
**Section 3: Deep linear-width NNs Linear activation**
* **Diagram:** A deep network with an input layer of approximately 5 nodes, multiple hidden layers (approximately 3), and a single output node. The hidden layers have approximately 5 nodes each. Connections are dense between layers. The nodes in the hidden layers are white.
* **Data-Parameter Relationship:** "#data << or α params" (Data is much less than or proportional to parameters)
* **Expressivity:** Weak expressivity
* **Feature Learning:** Weak feature learning
**Section 4: Shallow linear-width NNs Quadratic activation**
* **Diagram:** A shallow network with an input layer of approximately 5 nodes, a hidden layer of approximately 5 nodes, and a single output node. The nodes in the hidden layer are colored in pink. Connections are dense between layers.
* **Data-Parameter Relationship:** "#data α #params" (Data is proportional to parameters)
* **Expressivity:** Weak expressivity
* **Feature Learning:** Weak feature learning
**Section 5: Deep linear-width NNs**
* **Diagram:** A deep network with an input layer of approximately 5 nodes, multiple hidden layers (approximately 3), and a single output node. The hidden layers have approximately 5 nodes each. Connections are dense between layers.
* **Data-Parameter Relationship:** "#data << #params" (Data is much less than parameters)
* **Expressivity:** Strong expressivity
* **Feature Learning:** Weak feature learning
**Section 6: Deep linear-width NNs**
* **Diagram:** A deep network with an input layer of approximately 5 nodes, multiple hidden layers (approximately 3), and a single output node. The hidden layers have approximately 5 nodes each. Connections are dense between layers. This section is enclosed in a green box.
* **Data-Parameter Relationship:** "#data α #params" (Data is proportional to parameters)
* **Expressivity:** Strong expressivity
* **Feature Learning:** Feature learning
### Key Observations
* The diagram contrasts different neural network architectures based on depth, width, activation functions, and data-parameter relationships.
* Expressivity and feature learning capabilities vary across the architectures.
* The relationship between data and parameters seems to influence expressivity and feature learning.
### Interpretation
The diagram illustrates the trade-offs between different neural network architectures. Narrow networks and deep linear-width networks (Section 6) with a proportional data-parameter relationship exhibit feature learning, while linearized networks prioritize strong expressivity but sacrifice feature learning. The choice of architecture depends on the specific task and the available data. The diagram suggests that the relationship between data size and the number of parameters, along with the network's depth and activation functions, plays a crucial role in determining its expressivity and feature learning capabilities.