## Chart Type: Multiple Scatter Plots and Line Graph
### Overview
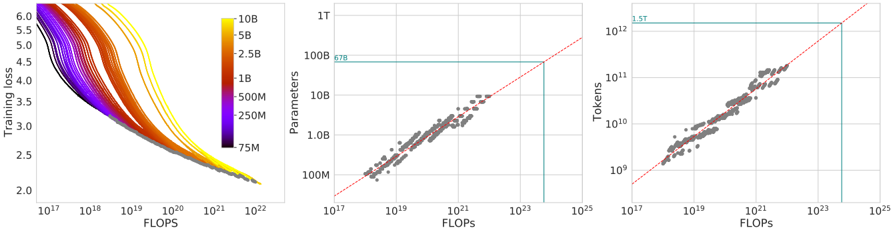
The image consists of three plots. The first plot (left) shows training loss versus FLOPS, with different lines representing different model sizes (number of parameters). The second plot (center) shows the relationship between the number of parameters and FLOPS. The third plot (right) shows the relationship between the number of tokens and FLOPS. All plots use a logarithmic scale for both axes.
### Components/Axes
**Plot 1 (Left): Training Loss vs. FLOPS**
* **X-axis:** FLOPS (Floating Point Operations Per Second), logarithmic scale from approximately 10^17 to 10^22.
* **Y-axis:** Training loss, linear scale from 2.0 to 6.0.
* **Legend:** Located on the top-right of the plot. Represents the number of parameters in the model, with colors ranging from purple (75M) to yellow (10B).
* Purple: 75M
* Dark Blue: 250M
* Blue: 500M
* Green: 1B
* Orange: 2.5B
* Red: 5B
* Yellow: 10B
**Plot 2 (Center): Parameters vs. FLOPS**
* **X-axis:** FLOPS, logarithmic scale from approximately 10^17 to 10^25.
* **Y-axis:** Parameters, logarithmic scale from 100M to 1T (1 Trillion).
* A red dashed line is present, indicating a linear relationship.
* A horizontal teal line is present at approximately 678B parameters.
**Plot 3 (Right): Tokens vs. FLOPS**
* **X-axis:** FLOPS, logarithmic scale from approximately 10^17 to 10^25.
* **Y-axis:** Tokens, logarithmic scale from 10^9 to 10^12 (1 Trillion).
* A red dashed line is present, indicating a linear relationship.
* A horizontal teal line is present at approximately 1.5T tokens.
### Detailed Analysis
**Plot 1 (Left): Training Loss vs. FLOPS**
* **Trend:** All lines show a decreasing trend, indicating that training loss decreases as FLOPS increase.
* **Data Points:**
* The line representing 75M parameters (purple) starts at a training loss of approximately 5.8 at 10^17 FLOPS and decreases to approximately 2.2 at 10^22 FLOPS.
* The line representing 10B parameters (yellow) starts at a training loss of approximately 5.9 at 10^17 FLOPS and decreases to approximately 2.1 at 10^22 FLOPS.
* The lines representing larger models (closer to yellow) tend to have slightly lower training loss for a given number of FLOPS compared to smaller models (closer to purple).
**Plot 2 (Center): Parameters vs. FLOPS**
* **Trend:** The data points show a positive correlation between the number of parameters and FLOPS. The points cluster around the red dashed line, indicating a roughly linear relationship on the log-log scale.
* **Data Points:**
* The data points range from approximately 100M parameters at 10^17 FLOPS to approximately 1T parameters at 10^23 FLOPS.
* The teal line indicates a specific model size of 678B parameters.
**Plot 3 (Right): Tokens vs. FLOPS**
* **Trend:** The data points show a positive correlation between the number of tokens and FLOPS. The points cluster around the red dashed line, indicating a roughly linear relationship on the log-log scale.
* **Data Points:**
* The data points range from approximately 10^9 tokens at 10^17 FLOPS to approximately 10^12 tokens at 10^23 FLOPS.
* The teal line indicates a specific number of tokens, 1.5T.
### Key Observations
* Larger models (more parameters) tend to achieve lower training loss for a given number of FLOPS.
* There is a strong positive correlation between the number of parameters and FLOPS, as well as between the number of tokens and FLOPS.
* The relationships between parameters/tokens and FLOPS appear roughly linear on a log-log scale.
### Interpretation
The plots demonstrate the relationship between model size (number of parameters), training data size (number of tokens), computational resources (FLOPS), and model performance (training loss). The data suggests that increasing model size and training data size, along with more computational resources, leads to improved model performance (lower training loss). The linear relationships on the log-log scale suggest power-law scaling between these variables. The teal lines in the second and third plots highlight specific values for parameters and tokens, potentially representing a target model size or training data size.