## Chart: Radial Visualization of NLP Tasks
### Overview
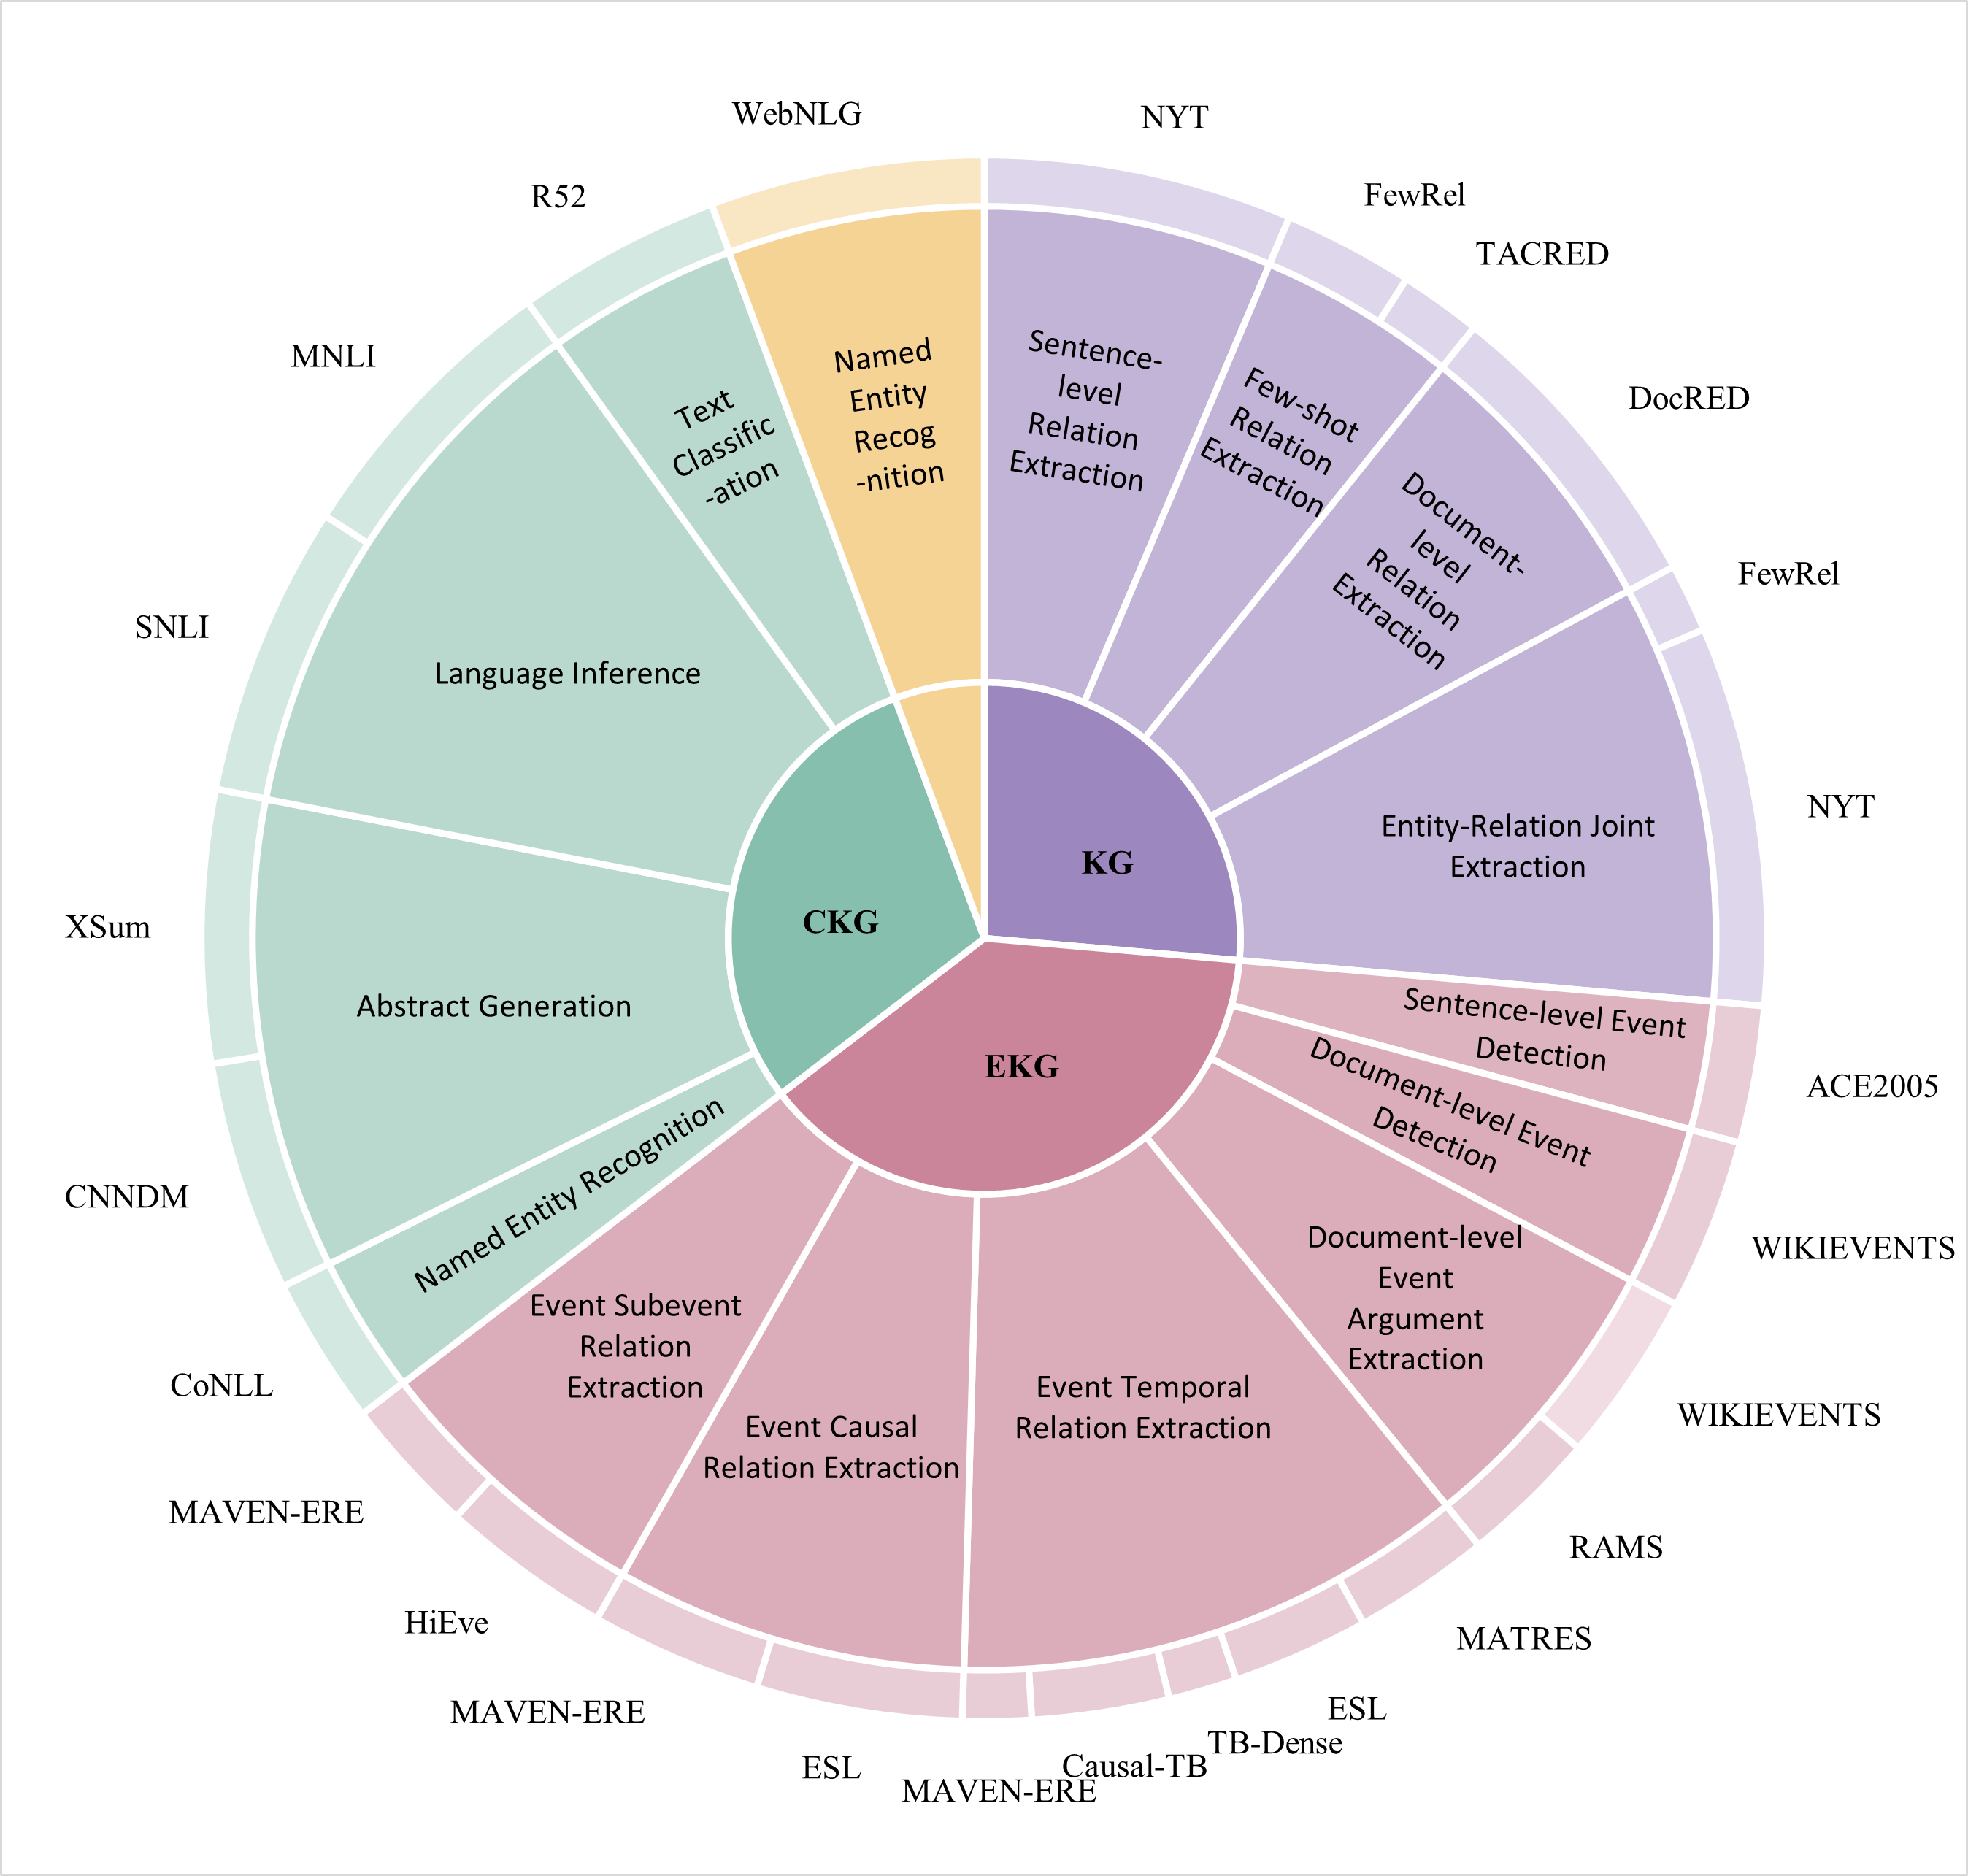
This image presents a radial chart, resembling a sunburst or rose diagram, visualizing relationships between various Natural Language Processing (NLP) tasks. The chart is organized concentrically, with tasks clustered around a central area. The tasks are color-coded, and the chart appears to illustrate the overlap or connections between different areas of NLP research.
### Components/Axes
The chart lacks traditional axes. Instead, it uses concentric rings and angular segments to represent tasks. The central area is labeled with "CKG" and "KG". The outer ring displays the names of specific NLP datasets/tasks. The color scheme is used to categorize tasks. The legend is implicitly defined by the color distribution within the chart.
### Detailed Analysis
The chart is divided into several segments, each representing a category of NLP tasks. Here's a breakdown, moving clockwise from the top:
* **Top-Right Quadrant (Light Blue/Green):**
* **NYT:** Appears twice, suggesting a significant role in multiple tasks.
* **FewRel:** Appears twice, also indicating importance.
* **TACRED:**
* **DocRED:**
* **Sentence-level Relation Extraction:**
* **Few-shot Relation Extraction:**
* **Document-level Relation Extraction:**
* **Entity-Relation Joint Extraction:**
* **Bottom-Right Quadrant (Yellow/Orange):**
* **WIKIEVENTS:** Appears twice.
* **ACE2005:**
* **RAMS:**
* **MATRES:**
* **ESL:**
* **Causal-TB-Dense MAVEN-ERE:**
* **Bottom-Left Quadrant (Green/Teal):**
* **MAVEN-ERE:** Appears twice.
* **HiEve:**
* **ESL:**
* **Event Temporal Relation Extraction:**
* **Event Causal Relation Extraction:**
* **Event Subevent Relation Extraction:**
* **Named Entity Recognition:**
* **Top-Left Quadrant (Purple/Pink):**
* **CNN/DM:**
* **CoNLL:**
* **XSum:**
* **SNLI:**
* **MNLI:**
* **R52:**
* **WebNLG:**
* **Text Classification:**
* **Named Entity Recognition:**
* **Language Inference:**
* **Abstract Generation:**
The central area is divided into two segments:
* **CKG:** (Color: Dark Green)
* **KG:** (Color: Light Green)
The chart shows a clear clustering of tasks. Relation extraction tasks are heavily concentrated in the top-right quadrant. Event-related tasks dominate the bottom-left. Text classification, language inference, and abstract generation are grouped in the top-left.
### Key Observations
* **Repetition of Tasks:** "NYT", "FewRel", "WIKIEVENTS", "MAVEN-ERE", and "ESL" appear multiple times, suggesting they are foundational datasets or tasks used across different areas of NLP.
* **Central Importance of CKG/KG:** The central positioning of "CKG" and "KG" suggests that Knowledge Graphs are a core component or underlying theme connecting these NLP tasks.
* **Task Overlap:** The overlapping segments indicate that many NLP tasks are interconnected and share common methodologies or data sources.
* **Uneven Distribution:** The distribution of tasks is not uniform, with some quadrants being more densely populated than others.
### Interpretation
This chart visually represents the landscape of NLP tasks and their interdependencies. The radial format emphasizes the relationships between tasks, rather than a hierarchical structure. The central placement of "CKG" and "KG" suggests that knowledge graphs play a crucial role in integrating and advancing various NLP applications. The repetition of certain datasets/tasks highlights their importance as benchmarks or foundational resources.
The chart suggests a trend towards increasingly complex NLP tasks that require reasoning about relationships between entities and events. The concentration of relation extraction and event detection tasks in the bottom half of the chart supports this observation. The chart is a high-level overview and doesn't provide specific performance metrics or quantitative data. It serves as a conceptual map of the NLP domain, illustrating the connections and overlaps between different research areas. The chart is a qualitative representation of the field, and does not provide any numerical data.