## Diagram: Common Approach: Whole-Proof Generation Pipeline
### Overview
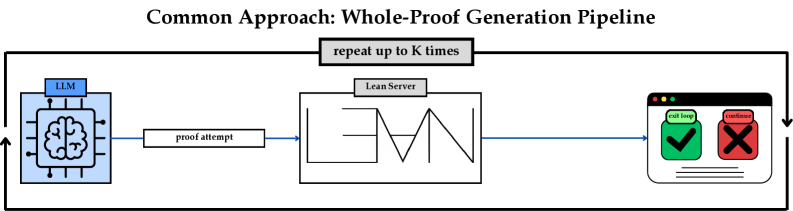
This image is a technical flowchart illustrating a standard iterative process for automated theorem proving. It depicts a system where a Large Language Model (LLM) generates complete mathematical proofs, which are then evaluated by a formal verification environment (Lean Server). The system operates in a feedback loop that continues until a correct proof is found or a maximum number of attempts is reached.
### Components and Spatial Grounding
The diagram is composed of a header, three main sequential nodes arranged horizontally from left to right, connecting arrows, and an overarching feedback loop.
**1. Header (Top Center)**
* **Text:** "Common Approach: Whole-Proof Generation Pipeline"
* **Positioning:** Centered at the very top of the image, acting as the title.
**2. Node 1: Generator (Left)**
* **Visual:** A light blue square containing a stylized icon of a brain integrated into a computer microchip (circuit lines ending in dots).
* **Label:** A small blue rectangular tab rests on the top edge of the square containing the text "**LLM**".
**3. Edge 1: Transmission (Center-Left)**
* **Visual:** A blue arrow pointing from the LLM node to the Lean Server node.
* **Label:** A white rectangle interrupts the arrow line, containing the text "**proof attempt**".
**4. Node 2: Verifier (Center)**
* **Visual:** A large white rectangle. Inside the rectangle is a stylized, geometric line-art graphic that spells out the word "**LEAN**" using continuous, sharp angles.
* **Label:** A grey rectangular tab rests on the top edge of the white box containing the text "**Lean Server**".
**5. Edge 2: Result Output (Center-Right)**
* **Visual:** A simple blue arrow pointing from the Lean Server node to the Evaluation node. It has no text label.
**6. Node 3: Evaluation/State (Right)**
* **Visual:** A stylized computer application window. It features a black top menu bar with three small colored dots (red, yellow, green) typical of macOS window controls. Inside the window are two distinct status indicators:
* **Left Indicator:** A green square with rounded corners containing a thick black checkmark. Above it is a green pill-shaped label reading "**exit loop**".
* **Right Indicator:** A red square with rounded corners containing a thick black 'X'. Above it is a red pill-shaped label reading "**continue**".
**7. Feedback Loop (Perimeter)**
* **Visual:** A thick black line that forms a large rectangular loop around the entire process. It originates from the right side of the Evaluation node, points downward, travels left across the bottom of the image, travels up the left side, and points right, feeding back into the LLM node.
* **Label:** On the top horizontal section of this black loop line, there is a grey rectangle containing the text "**repeat up to K times**".
### Content Details and Flow
The diagram maps a specific logical flow:
1. **Generation:** The cycle begins at the **LLM**, which generates a complete **proof attempt**.
2. **Verification:** This attempt is sent to the **Lean Server**, which acts as the compiler/verifier to check the logical and syntactic validity of the proof.
3. **Evaluation:** The output of the Lean Server results in a binary state:
* If the proof is correct (Green Checkmark), the system triggers an **exit loop** command, successfully ending the process.
* If the proof is incorrect (Red 'X'), the system triggers a **continue** command.
4. **Iteration:** The "continue" state feeds into the outer black feedback loop. This prompts the LLM to generate a new, different proof attempt.
5. **Constraint:** The entire iterative process is bounded by the condition to **repeat up to K times**. If the system fails $K$ times, the loop will terminate without a successful proof.
### Key Observations
* **Binary Feedback:** The diagram implies that the LLM only receives a pass/fail signal (check or X) rather than detailed error messages or step-by-step interactive guidance.
* **"Whole-Proof" Paradigm:** The title explicitly states this is a "Whole-Proof" generation pipeline. This means the LLM attempts to write the entire proof from start to finish in a single inference step, rather than constructing it line-by-line with intermediate checks.
* **Automated Loop:** There is no human-in-the-loop depicted; the process relies entirely on the LLM's generation capabilities and the Lean Server's deterministic verification.
### Interpretation
This diagram illustrates the baseline or "naive" approach to using Large Language Models for formal mathematics (specifically using the Lean theorem prover). Because LLMs are prone to hallucinations or logical errors, a single generation is rarely reliable for complex proofs. Therefore, the standard methodology is to use the LLM as a heuristic guesser and the Lean Server as a rigorous judge.
By wrapping this in a loop ("repeat up to K times"), the system utilizes a "sample-and-filter" or brute-force methodology. It relies on the probability that if the LLM generates enough diverse attempts ($K$ attempts), at least one will be logically sound.
*Peircean/Investigative Note:* The explicit labeling of this as the "Common Approach" strongly suggests that this image serves as a baseline comparison in a broader technical paper or presentation. The author is likely setting up this "Whole-Proof" brute-force loop to contrast it with a novel, more sophisticated method—such as a Tree-of-Thought approach, step-by-step interactive proving, or a system where the Lean Server feeds specific error messages back to the LLM to guide corrections, rather than just a binary "continue" signal.