\n
## Diagram: Region Explorer - Decompose Match Price
### Overview
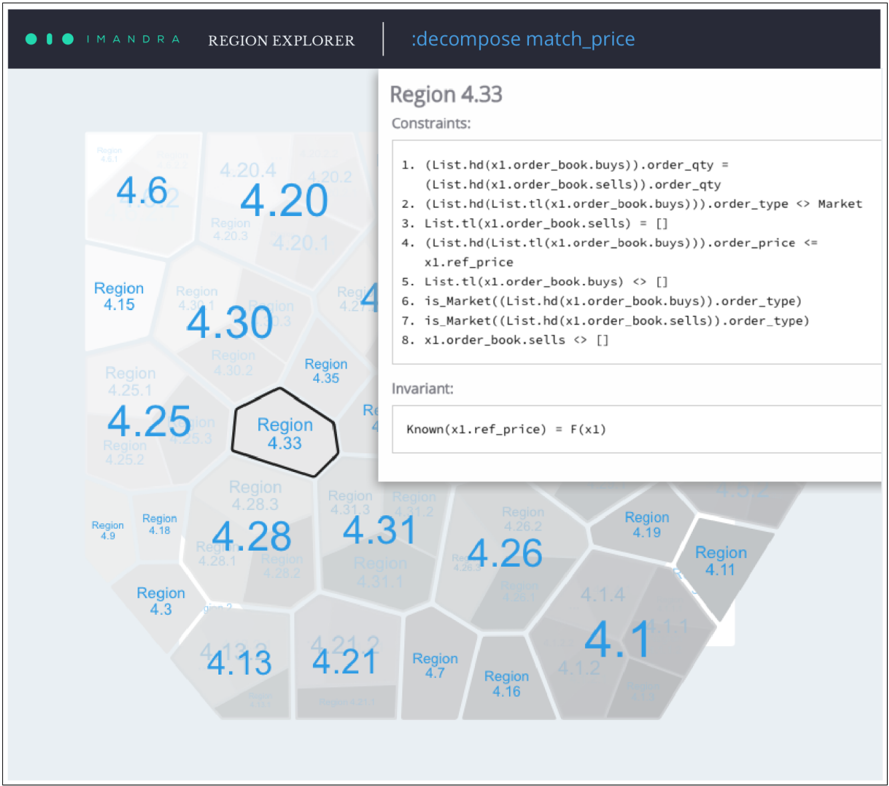
The image displays a diagram titled "Region Explorer" with a sub-title "decompose match_price". It shows a network of interconnected, irregularly shaped regions, each labeled with a numerical value representing a region identifier and a corresponding price. A text block on the right side details constraints and invariants related to "Region 4.33". The overall impression is a visualization of a pricing model or a market segmentation analysis.
### Components/Axes
The diagram consists of:
* **Regions:** Irregularly shaped areas distributed across the image. Each region is labeled with "Region [number]" and a numerical value (e.g., "Region 4.33", "4.33").
* **Numerical Labels:** Each region has a numerical label indicating a price or value.
* **Text Block:** A rectangular block on the right side containing constraints and invariants.
* **Title:** "IMANDRA" at the top-left corner.
* **Subtitle:** "REGION EXPLORER" at the top-center.
* **Decomposition Title:** ":decompose match_price" at the top-right corner.
### Detailed Analysis / Content Details
The diagram shows a network of regions with the following values:
* **4.62** (Top-left)
* **4.204** (Top-center-left)
* **4.20** (Top-center)
* **4.202** (Top-center-right)
* **4.15** (Left-center)
* **4.30** (Center-left)
* **4.21** (Center)
* **4.25** (Center-left-bottom)
* **4.25.1** (Bottom-left)
* **4.26.2** (Bottom-left-center)
* **4.33** (Center-bottom)
* **4.35** (Center-right-bottom)
* **4.28** (Bottom-center)
* **4.31** (Bottom-center-right)
* **4.26** (Bottom-right-center)
* **4.19** (Bottom-right)
* **4.11** (Bottom-right-corner)
* **4.13** (Bottom-left-corner)
* **4.21** (Bottom-center-left)
* **4.7** (Bottom-right-center)
* **4.16** (Bottom-right-corner)
* **4.1** (Bottom-right-corner)
* **4.1.4** (Bottom-right-corner)
* **4.1.2** (Bottom-right-corner)
* **4.18** (Bottom-left-center)
* **4.23** (Top-center-left)
The text block on the right side, associated with "Region 4.33", contains the following constraints and invariants:
1. (List.hd(x1.order\_book.buys)).order\_qty = (List.hd(x1.order\_book.sells)).order\_qty
2. (List.hd(x1.order\_book.buys)).order\_type < Market
3. List.tl(x1.order\_book.sells) = []
4. (List.hd(List.tl(x1.order\_book.buys))).order\_price <= x1.ref\_price
5. List.tl(x1.order\_book.buys) <> []
6. is\_Market((List.hd(x1.order\_book.sells)).order\_type)
7. is\_Market((List.hd(x1.order\_book.sells)).order\_type)
8. x1.order\_book.sells <> []
Invariant:
Known(x1.ref\_price) = F(x1)
### Key Observations
* The numerical values associated with the regions appear to represent prices or some other quantifiable metric.
* The values are clustered around the 4.2 to 4.3 range, with some outliers at 4.62 and 4.1.
* The text block provides a set of constraints and invariants that likely govern the pricing or behavior within "Region 4.33".
* The constraints involve order books, order types, and reference prices, suggesting a trading or market context.
* The use of "List.hd" and "List.tl" suggests a functional programming approach to data manipulation.
### Interpretation
This diagram likely represents a model of a market or trading system, where each region corresponds to a specific state or condition. The numerical values represent a key metric, potentially the price of an asset or the cost of a transaction. The constraints and invariants associated with "Region 4.33" define the rules and conditions that apply within that specific state.
The constraints suggest a matching engine where buy and sell orders are being processed. The invariants indicate that the reference price is a function of some input (x1), and that certain conditions must be met for the system to operate correctly.
The outliers (4.62 and 4.1) could represent regions with significantly different pricing dynamics or market conditions. The overall structure suggests a complex system with interconnected regions and a set of rules governing their behavior. The diagram is a visual representation of a mathematical or algorithmic model used for price decomposition or market analysis. The use of functional programming constructs (List.hd, List.tl) indicates a sophisticated analytical approach.