## Bar Chart: Cognitive Bias Performance Comparison
### Overview
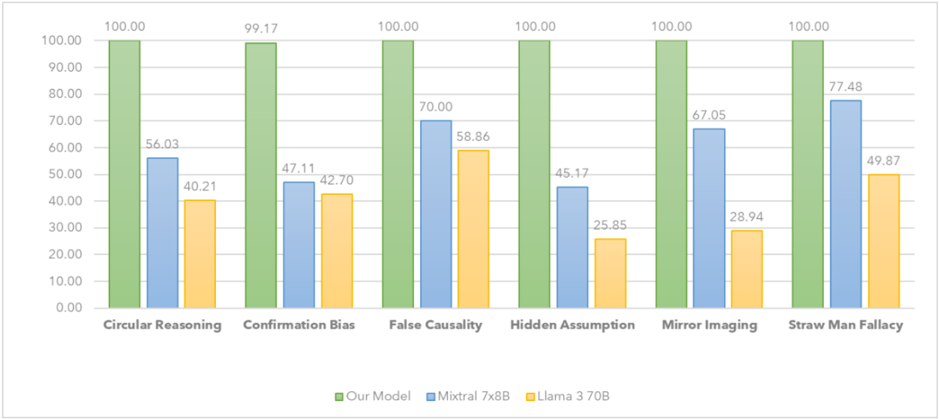
The chart compares the performance of three AI models ("Our Model," "Mixtural 7x8B," and "Llama 3 70B") across six cognitive biases. Performance is measured as a percentage, with "Our Model" consistently achieving 100% across all categories except "Confirmation Bias" (99.17%). "Mixtural 7x8B" and "Llama 3 70B" show variable performance, with "Mixtural" generally outperforming "Llama" in most categories.
### Components/Axes
- **X-axis (Categories)**: Six cognitive biases:
1. Circular Reasoning
2. Confirmation Bias
3. False Causality
4. Hidden Assumption
5. Mirror Imaging
6. Straw Man Fallacy
- **Y-axis (Values)**: Percentage scale (0.00–100.00).
- **Legend**:
- Green: "Our Model"
- Blue: "Mixtural 7x8B"
- Orange: "Llama 3 70B"
- **Bar Colors**:
- Green bars (Our Model) are tallest in all categories.
- Blue bars (Mixtural) are intermediate.
- Orange bars (Llama) are shortest in most categories.
### Detailed Analysis
1. **Circular Reasoning**:
- Our Model: 100.00%
- Mixtural 7x8B: 56.03%
- Llama 3 70B: 40.21%
2. **Confirmation Bias**:
- Our Model: 99.17%
- Mixtural 7x8B: 47.11%
- Llama 3 70B: 42.70%
3. **False Causality**:
- Our Model: 100.00%
- Mixtural 7x8B: 70.00%
- Llama 3 70B: 58.86%
4. **Hidden Assumption**:
- Our Model: 100.00%
- Mixtural 7x8B: 45.17%
- Llama 3 70B: 25.85%
5. **Mirror Imaging**:
- Our Model: 100.00%
- Mixtural 7x8B: 67.05%
- Llama 3 70B: 28.94%
6. **Straw Man Fallacy**:
- Our Model: 100.00%
- Mixtural 7x8B: 77.48%
- Llama 3 70B: 49.87%
### Key Observations
- **Our Model Dominance**: Achieves 100% in 5/6 categories, with only a minor dip in "Confirmation Bias" (99.17%).
- **Mixtural vs. Llama**:
- Mixtural outperforms Llama in all categories except "False Causality" (70.00% vs. 58.86%).
- Llama’s lowest performance is in "Hidden Assumption" (25.85%).
- **Straw Man Fallacy**: Mixtural achieves the highest non-100% score (77.48%), while Llama scores 49.87%.
### Interpretation
The data suggests "Our Model" is optimized to avoid cognitive biases, performing flawlessly in most cases. "Mixtural 7x8B" demonstrates moderate capability, with strengths in "Straw Man Fallacy" and "False Causality." "Llama 3 70B" struggles significantly, particularly with "Hidden Assumption" (25.85%) and "Mirror Imaging" (28.94%). The stark contrast between "Our Model" and the other two models highlights potential architectural or training differences. The consistent 100% scores for "Our Model" may indicate specialized bias mitigation strategies, while Llama’s lower scores suggest limitations in handling abstract reasoning tasks.