## Bar Chart: Prediction Flip Rate Comparison for Llama Models
### Overview
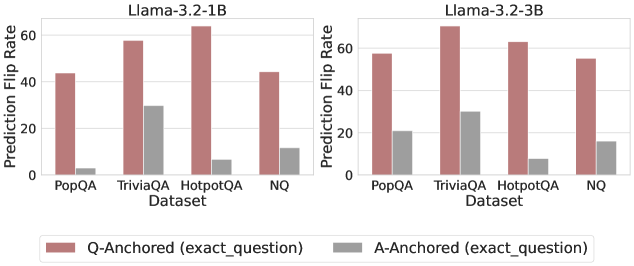
The image presents two bar charts comparing the prediction flip rates of two Llama models (Llama-3.2-1B and Llama-3.2-3B) across four different datasets: PopQA, TriviaQA, HotpotQA, and NQ. The charts compare the flip rates when anchoring on the question (Q-Anchored) versus anchoring on the answer (A-Anchored).
### Components/Axes
* **Titles:**
* Left Chart: Llama-3.2-1B
* Right Chart: Llama-3.2-3B
* **X-Axis:** Dataset (categorical)
* Categories: PopQA, TriviaQA, HotpotQA, NQ
* **Y-Axis:** Prediction Flip Rate (numerical)
* Scale: 0 to 60, with tick marks at 0, 20, 40, and 60.
* **Legend:** Located at the bottom of the image.
* Rose/Brown: Q-Anchored (exact\_question)
* Gray: A-Anchored (exact\_question)
### Detailed Analysis
**Left Chart: Llama-3.2-1B**
* **Q-Anchored (exact\_question) - Rose/Brown Bars:**
* PopQA: Approximately 43%
* TriviaQA: Approximately 58%
* HotpotQA: Approximately 64%
* NQ: Approximately 44%
* **A-Anchored (exact\_question) - Gray Bars:**
* PopQA: Approximately 3%
* TriviaQA: Approximately 30%
* HotpotQA: Approximately 7%
* NQ: Approximately 12%
**Right Chart: Llama-3.2-3B**
* **Q-Anchored (exact\_question) - Rose/Brown Bars:**
* PopQA: Approximately 58%
* TriviaQA: Approximately 70%
* HotpotQA: Approximately 55%
* NQ: Approximately 55%
* **A-Anchored (exact\_question) - Gray Bars:**
* PopQA: Approximately 21%
* TriviaQA: Approximately 30%
* HotpotQA: Approximately 7%
* NQ: Approximately 16%
### Key Observations
* For both models and across all datasets, the Q-Anchored flip rate is significantly higher than the A-Anchored flip rate.
* TriviaQA and HotpotQA datasets show the highest Q-Anchored flip rates for Llama-3.2-1B.
* TriviaQA shows the highest Q-Anchored flip rate for Llama-3.2-3B.
* PopQA shows the lowest Q-Anchored flip rate for Llama-3.2-1B.
* HotpotQA and NQ show the lowest Q-Anchored flip rates for Llama-3.2-3B.
* The A-Anchored flip rates are generally low across all datasets for both models, with TriviaQA showing the highest A-Anchored flip rate for Llama-3.2-1B and PopQA showing the highest A-Anchored flip rate for Llama-3.2-3B.
### Interpretation
The data suggests that the prediction flip rate is highly dependent on whether the anchoring is done on the question or the answer. Anchoring on the question (Q-Anchored) leads to a much higher flip rate compared to anchoring on the answer (A-Anchored). This could indicate that the models are more sensitive to variations or perturbations in the question compared to the answer. The differences in flip rates across datasets may reflect the varying complexity and structure of the questions and answers within each dataset. The Llama-3.2-3B model generally exhibits higher Q-Anchored flip rates compared to Llama-3.2-1B, suggesting that the 3B model might be more sensitive to question variations. The low A-Anchored flip rates suggest that the models are relatively stable when the answer is the anchor.