## Flowchart: Causal Relationship Diagram
### Overview
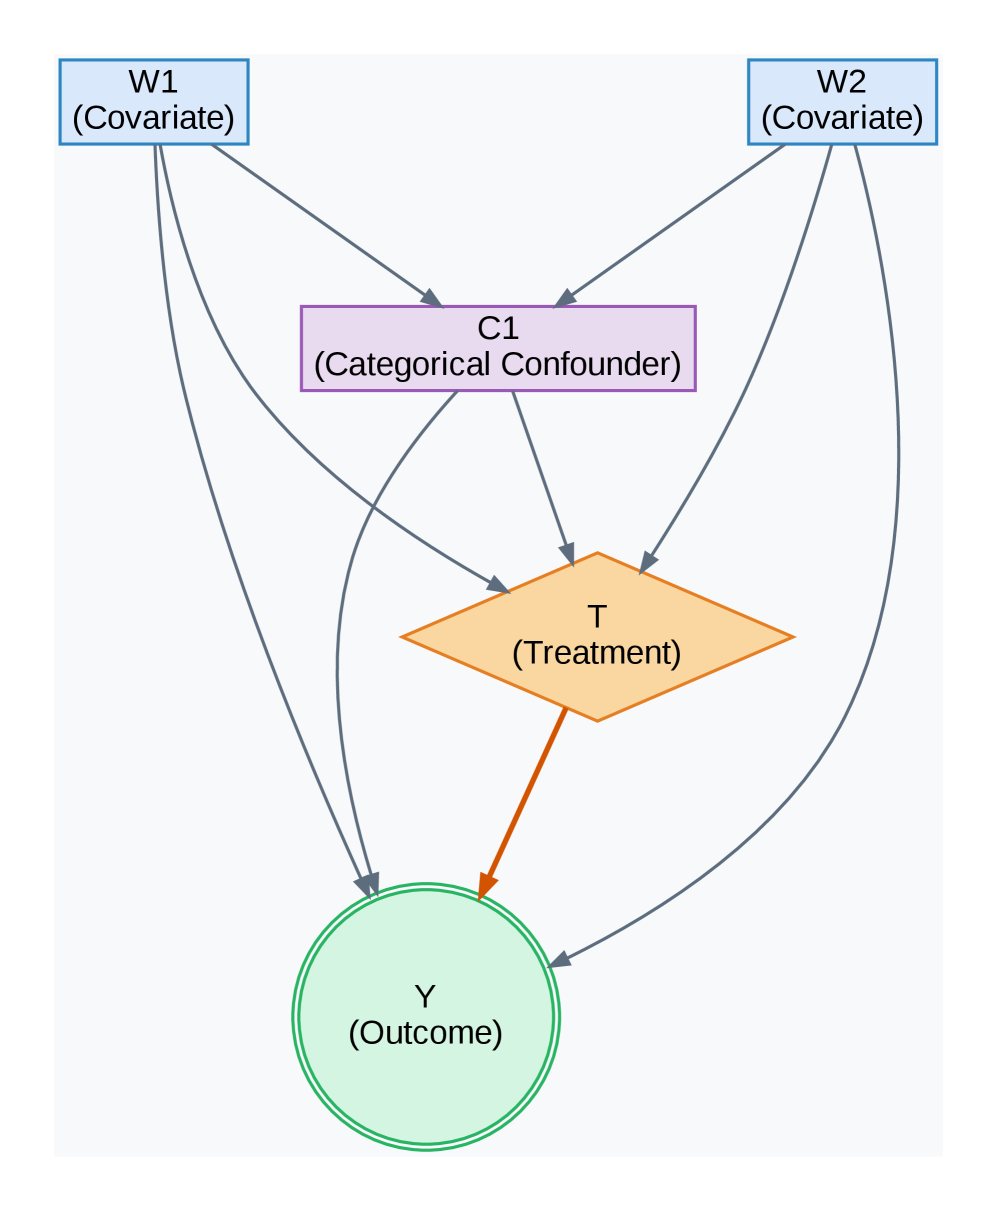
The image depicts a causal relationship diagram with five nodes connected by directional arrows. The diagram uses color-coded shapes to represent different variable types: covariates, confounders, treatments, and outcomes. Arrows indicate directional influence or dependency between components.
### Components/Axes
1. **Nodes**:
- **W1 (Covariate)**: Top-left, blue rectangle.
- **W2 (Covariate)**: Top-right, blue rectangle.
- **C1 (Categorical Confounder)**: Center, purple rectangle.
- **T (Treatment)**: Orange diamond, below C1.
- **Y (Outcome)**: Green circle, bottom-center.
2. **Arrows**:
- Gray arrows connect all nodes, indicating bidirectional or unidirectional relationships.
- Key connections:
- W1 → C1, W2 → C1 (covariates influence confounder).
- C1 → T (confounder affects treatment).
- T → Y (treatment affects outcome).
- W2 → Y (direct effect of covariate on outcome).
3. **Color Coding**:
- Blue: Covariates (W1, W2).
- Purple: Categorical confounder (C1).
- Orange: Treatment (T).
- Green: Outcome (Y).
### Detailed Analysis
- **Covariates (W1, W2)**: Positioned at the top, suggesting they are external factors influencing downstream variables.
- **Categorical Confounder (C1)**: Acts as a mediator between covariates and treatment, highlighting its role in confounding the relationship.
- **Treatment (T)**: Central node influencing the outcome, with a direct arrow from C1.
- **Outcome (Y)**: Final node with two incoming arrows (from T and W2), indicating multiple pathways to the outcome.
### Key Observations
1. **Confounder Influence**: C1 is influenced by both covariates (W1, W2) and subsequently affects the treatment (T), suggesting potential bias in causal inference if unadjusted.
2. **Direct Pathway**: W2 has a direct arrow to Y, implying a relationship independent of the confounder or treatment.
3. **Treatment-Outcome Link**: T directly impacts Y, consistent with standard causal models.
### Interpretation
This diagram illustrates a causal pathway where covariates (W1, W2) influence a categorical confounder (C1), which in turn affects treatment (T) and the outcome (Y). The direct arrow from W2 to Y suggests that W2 may have an unmediated effect on the outcome, even after accounting for C1. The structure emphasizes the importance of controlling for confounders (C1) to isolate the true effect of treatment (T) on the outcome (Y). The presence of bidirectional arrows (e.g., W2 → C1 and C1 → W2) implies potential feedback loops, though the diagram does not explicitly clarify causality directionality.
**Note**: No numerical data or trends are present; the diagram focuses on structural relationships.