## Diagram: Context-based and Confidence-aware Optimization
### Overview
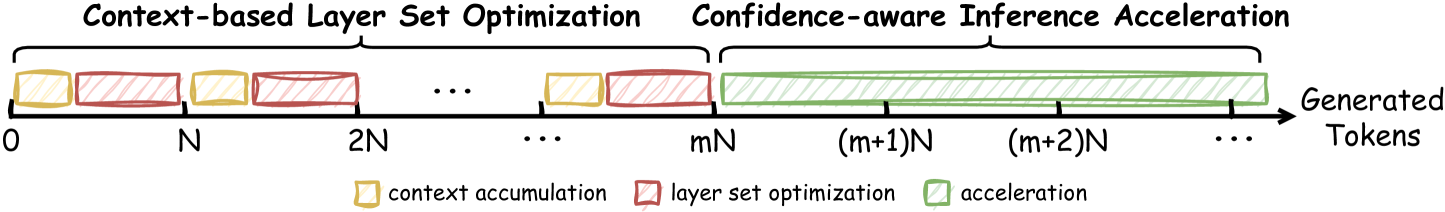
The image is a diagram illustrating the process of context-based layer set optimization and confidence-aware inference acceleration in relation to generated tokens. It shows a timeline divided into sections representing context accumulation, layer set optimization, and acceleration.
### Components/Axes
* **Horizontal Axis:** Represents "Generated Tokens" with markers at 0, N, 2N, ..., mN, (m+1)N, (m+2)N, and so on. The arrow indicates the direction of token generation.
* **Legend (bottom-left):**
* Yellow box: "context accumulation"
* Red box: "layer set optimization"
* Green box: "acceleration"
* **Top Labels:**
* "Context-based Layer Set Optimization" spans from 0 to mN.
* "Confidence-aware Inference Acceleration" spans from mN to the end of the timeline.
### Detailed Analysis
* **Context-based Layer Set Optimization (0 to mN):**
* Alternating yellow (context accumulation) and red (layer set optimization) blocks.
* The blocks appear to be of roughly equal size.
* The pattern repeats several times, indicated by the ellipsis (...).
* **Confidence-aware Inference Acceleration (mN onwards):**
* Begins with a red (layer set optimization) block.
* Followed by a long series of green (acceleration) blocks, indicated by the ellipsis (...).
* The green blocks appear to increase in length as the number of generated tokens increases.
### Key Observations
* The process starts with context accumulation and layer set optimization.
* After 'mN' tokens, the process transitions to confidence-aware inference acceleration, primarily involving acceleration blocks.
* The acceleration blocks seem to grow in size as more tokens are generated.
### Interpretation
The diagram illustrates a multi-stage process for token generation, likely within a neural network or similar system. Initially, context is accumulated, and the layer set is optimized. As the system gains confidence (after 'mN' tokens), the focus shifts to acceleration, which becomes increasingly dominant as more tokens are generated. The increasing size of the acceleration blocks suggests that the system becomes more efficient or faster at generating tokens as it progresses. The diagram highlights the transition from initial setup and optimization to a phase of accelerated inference.