TECHNICAL ASSET FINGERPRINT
03022fae787c8915d2e58703
Click to view fullscreen
Press ESC or click to close
FOUND IN PAPERS
EXPERT: gemma-3-27b-it-free VERSION 1
RUNTIME: google-free/gemma-3-27b-it
INTEL_VERIFIED
\n
## Heatmap: Outlier Station Occurrences
### Overview
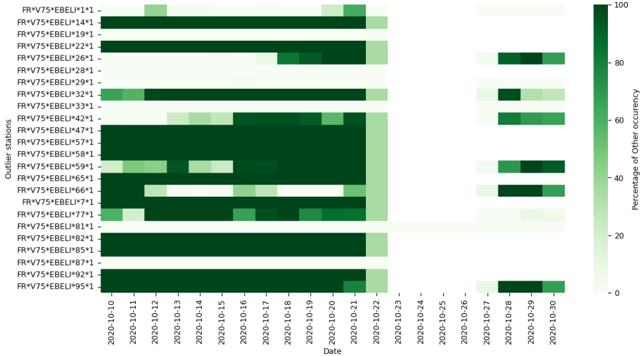
This image presents a heatmap visualizing the percentage of co-occurrence of outlier stations over time, specifically during the period from 2020-10-10 to 2020-10-30. The heatmap displays the relationship between 20 different outlier stations listed on the y-axis and dates on the x-axis. The color intensity represents the percentage of other occurrences, ranging from 0% (white) to 100% (dark green).
### Components/Axes
* **X-axis:** Date, ranging from 2020-10-10 to 2020-10-30, with increments of approximately one day.
* **Y-axis:** Outlier Stations. The following stations are listed:
* FR\*V75\*EBEL\*1\*1
* FR\*V75\*EBEL\*14\*1
* FR\*V75\*EBEL\*19\*1
* FR\*V75\*EBEL\*22\*1
* FR\*V75\*EBEL\*26\*1
* FR\*V75\*EBEL\*28\*1
* FR\*V75\*EBEL\*29\*1
* FR\*V75\*EBEL\*32\*1
* FR\*V75\*EBEL\*33\*1
* FR\*V75\*EBEL\*42\*1
* FR\*V75\*EBEL\*47\*1
* FR\*V75\*EBEL\*57\*1
* FR\*V75\*EBEL\*58\*1
* FR\*V75\*EBEL\*59\*1
* FR\*V75\*EBEL\*65\*1
* FR\*V75\*EBEL\*66\*1
* FR\*V75\*EBEL\*77\*1
* FR\*V75\*EBEL\*81\*1
* FR\*V75\*EBEL\*82\*1
* FR\*V75\*EBEL\*85\*1
* FR\*V75\*EBEL\*87\*1
* FR\*V75\*EBEL\*92\*1
* FR\*V75\*EBEL\*95\*1
* **Color Scale (Right):** Percentage of Other Occurency, ranging from 0% (white) to 100% (dark green). The scale is divided into increments of approximately 20%.
### Detailed Analysis
The heatmap shows varying degrees of co-occurrence between the outlier stations. Here's a breakdown of observations, noting approximate values due to the visual nature of the data:
* **FR\*V75\*EBEL\*1\*1:** Shows a strong co-occurrence (approximately 80-100%) around 2020-10-29 and 2020-10-30. Very low co-occurrence (0-20%) for most other dates.
* **FR\*V75\*EBEL\*14\*1:** Displays a moderate co-occurrence (approximately 40-60%) around 2020-10-29. Low co-occurrence for other dates.
* **FR\*V75\*EBEL\*19\*1:** Shows a moderate co-occurrence (approximately 40-60%) around 2020-10-29. Low co-occurrence for other dates.
* **FR\*V75\*EBEL\*22\*1:** Displays a moderate co-occurrence (approximately 40-60%) around 2020-10-29. Low co-occurrence for other dates.
* **FR\*V75\*EBEL\*26\*1:** Shows a moderate co-occurrence (approximately 40-60%) around 2020-10-29. Low co-occurrence for other dates.
* **FR\*V75\*EBEL\*28\*1:** Displays a moderate co-occurrence (approximately 40-60%) around 2020-10-29. Low co-occurrence for other dates.
* **FR\*V75\*EBEL\*29\*1:** Shows a moderate co-occurrence (approximately 40-60%) around 2020-10-29. Low co-occurrence for other dates.
* **FR\*V75\*EBEL\*32\*1:** Displays a moderate co-occurrence (approximately 40-60%) around 2020-10-29. Low co-occurrence for other dates.
* **FR\*V75\*EBEL\*33\*1:** Shows a strong co-occurrence (approximately 60-80%) around 2020-10-11 to 2020-10-13. Low co-occurrence for other dates.
* **FR\*V75\*EBEL\*42\*1:** Displays a moderate co-occurrence (approximately 40-60%) around 2020-10-21. Low co-occurrence for other dates.
* **FR\*V75\*EBEL\*47\*1:** Shows a moderate co-occurrence (approximately 40-60%) around 2020-10-21. Low co-occurrence for other dates.
* **FR\*V75\*EBEL\*57\*1:** Displays a moderate co-occurrence (approximately 40-60%) around 2020-10-21. Low co-occurrence for other dates.
* **FR\*V75\*EBEL\*58\*1:** Shows a moderate co-occurrence (approximately 40-60%) around 2020-10-21. Low co-occurrence for other dates.
* **FR\*V75\*EBEL\*59\*1:** Displays a moderate co-occurrence (approximately 40-60%) around 2020-10-21. Low co-occurrence for other dates.
* **FR\*V75\*EBEL\*65\*1:** Shows a moderate co-occurrence (approximately 40-60%) around 2020-10-21. Low co-occurrence for other dates.
* **FR\*V75\*EBEL\*66\*1:** Displays a moderate co-occurrence (approximately 40-60%) around 2020-10-21. Low co-occurrence for other dates.
* **FR\*V75\*EBEL\*77\*1:** Shows a moderate co-occurrence (approximately 40-60%) around 2020-10-19. Low co-occurrence for other dates.
* **FR\*V75\*EBEL\*81\*1:** Displays a strong co-occurrence (approximately 60-80%) around 2020-10-11 to 2020-10-13. Low co-occurrence for other dates.
* **FR\*V75\*EBEL\*82\*1:** Shows a moderate co-occurrence (approximately 40-60%) around 2020-10-29. Low co-occurrence for other dates.
* **FR\*V75\*EBEL\*85\*1:** Displays a moderate co-occurrence (approximately 40-60%) around 2020-10-29. Low co-occurrence for other dates.
* **FR\*V75\*EBEL\*87\*1:** Shows a moderate co-occurrence (approximately 40-60%) around 2020-10-29. Low co-occurrence for other dates.
* **FR\*V75\*EBEL\*92\*1:** Displays a moderate co-occurrence (approximately 40-60%) around 2020-10-29. Low co-occurrence for other dates.
* **FR\*V75\*EBEL\*95\*1:** Shows a moderate co-occurrence (approximately 40-60%) around 2020-10-27 to 2020-10-30. Low co-occurrence for other dates.
### Key Observations
* There's a noticeable cluster of high co-occurrence around 2020-10-29 and 2020-10-30 for several stations (FR\*V75\*EBEL\*1\*1, FR\*V75\*EBEL\*14\*1, FR\*V75\*EBEL\*19\*1, FR\*V75\*EBEL\*22\*1, FR\*V75\*EBEL\*26\*1, FR\*V75\*EBEL\*28\*1, FR\*V75\*EBEL\*29\*1, FR\*V75\*EBEL\*32\*1, FR\*V75\*EBEL\*82\*1, FR\*V75\*EBEL\*85\*1, FR\*V75\*EBEL\*87\*1, FR\*V75\*EBEL\*92\*1).
* Stations FR\*V75\*EBEL\*33\*1 and FR\*V75\*EBEL\*81\*1 exhibit high co-occurrence between 2020-10-11 and 2020-10-13.
* Stations FR\*V75\*EBEL\*42\*1, FR\*V75\*EBEL\*47\*1, FR\*V75\*EBEL\*57\*1, FR\*V75\*EBEL\*58\*1, FR\*V75\*EBEL\*59\*1, and FR\*V75\*EBEL\*66\*1 show moderate co-occurrence around 2020-10-21.
* Most stations show very low co-occurrence for the majority of the observed period.
### Interpretation
The heatmap suggests that the outlier stations do not generally co-occur frequently. However, there are specific periods where certain stations exhibit a strong tendency to occur together. The high co-occurrence around 2020-10-29 and 2020-10-30 indicates a potential shared event or condition affecting those stations. The earlier peak between 2020-10-11 and 2020-10-13 for stations FR\*V75\*EBEL\*33\*1 and FR\*V75\*EBEL\*81\*1 suggests a separate, earlier event. The moderate co-occurrence around 2020-10-21 for a different set of stations suggests yet another distinct event.
This data could be used to investigate the underlying causes of these co-occurrences. For example, are these stations geographically close? Do they share similar environmental conditions? Are they subject to the same operational procedures? Further investigation is needed to understand the relationships between these outlier stations and the events that trigger their simultaneous occurrence. The heatmap provides a valuable starting point for identifying patterns and prioritizing further analysis.
DECODING INTELLIGENCE...