## Line Charts: Performance Metrics vs. Number of Backtracking Steps
### Overview
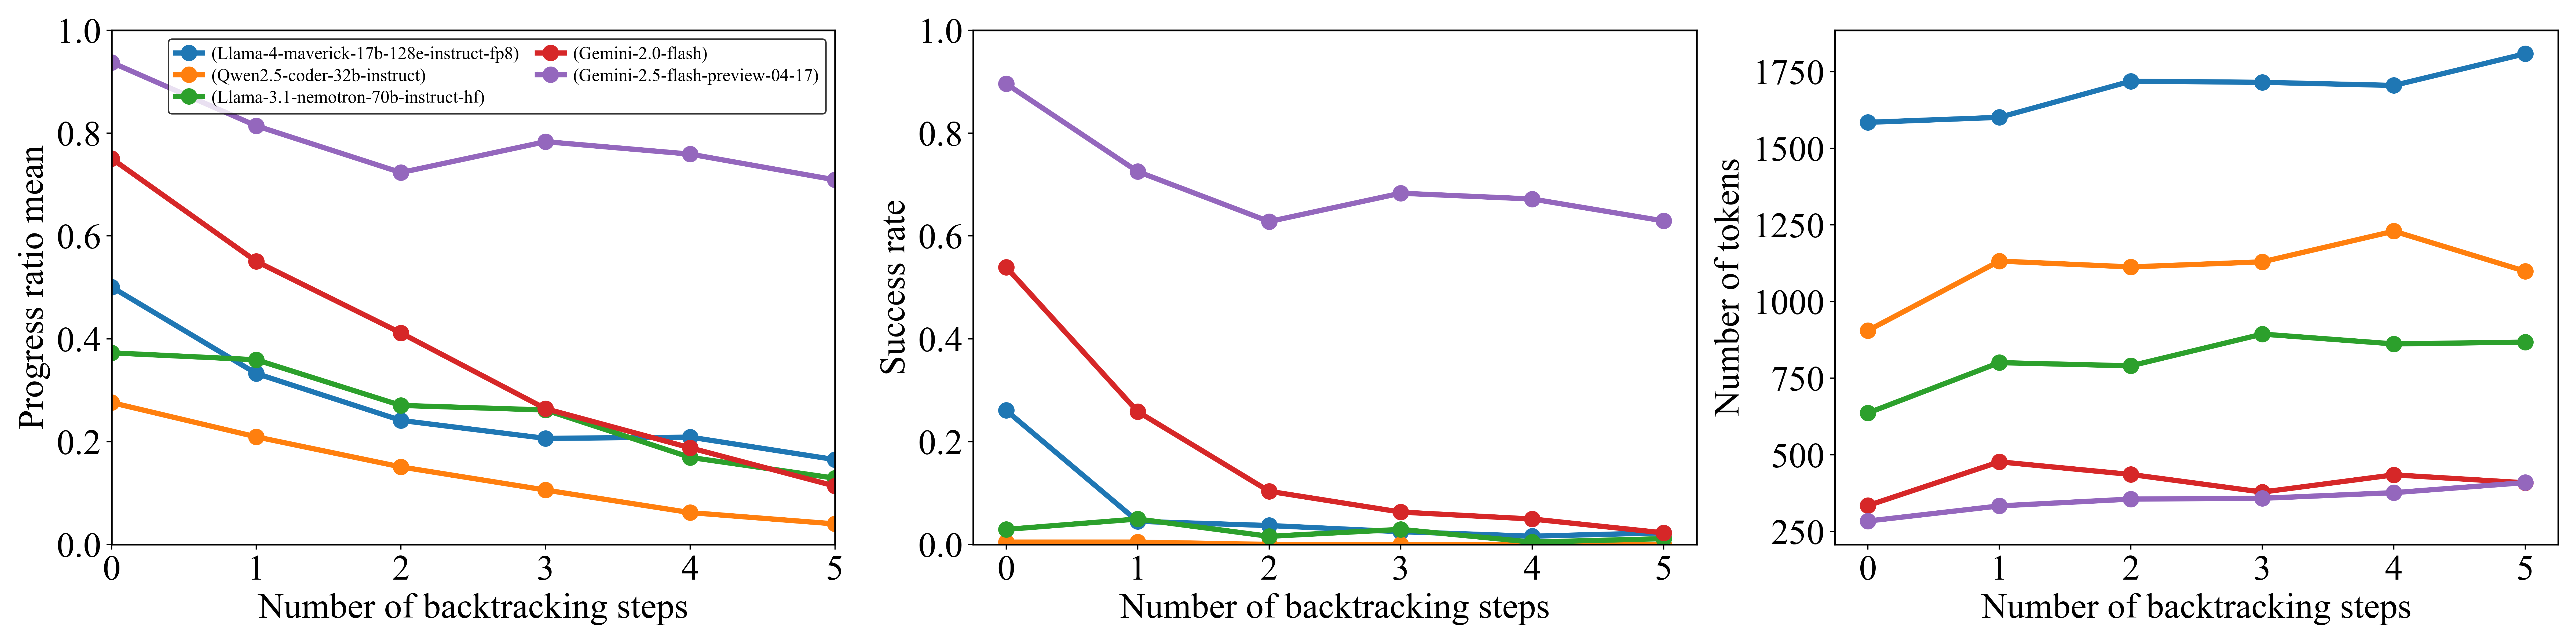
This image displays three side-by-side line charts comparing the performance of five different Large Language Models (LLMs) across three metrics: "Progress ratio mean," "Success rate," and "Number of tokens." The x-axis for all three charts represents the "Number of backtracking steps," ranging from 0 to 5.
### Components/Axes
* **Shared X-Axis:** "Number of backtracking steps" (0, 1, 2, 3, 4, 5).
* **Legend (Located in the top-left chart):**
* **Blue:** Llama-4-maverick-17b-128e-instruct-fp8
* **Orange:** Qwen2.5-coder-32b-instruct
* **Green:** Llama-3.1-nemotron-70b-instruct-hf
* **Red:** Gemini-2.0-flash
* **Purple:** Gemini-2.5-flash-preview-04-17
* **Chart 1 (Left):** Y-axis "Progress ratio mean" (Scale: 0.0 to 1.0).
* **Chart 2 (Center):** Y-axis "Success rate" (Scale: 0.0 to 1.0).
* **Chart 3 (Right):** Y-axis "Number of tokens" (Scale: 250 to 1750).
---
### Detailed Analysis
#### 1. Progress Ratio Mean (Left Chart)
* **Trend:** All models show a downward trend as backtracking steps increase.
* **Data Points (Approximate):**
* **Purple (Gemini-2.5):** Starts at ~0.95, dips to ~0.72 at step 2, recovers slightly to ~0.78 at step 3, then trends down to ~0.70 at step 5.
* **Red (Gemini-2.0):** Starts at ~0.75, drops consistently to ~0.12 at step 5.
* **Blue (Llama-4):** Starts at ~0.50, drops to ~0.18 at step 5.
* **Green (Llama-3.1):** Starts at ~0.38, drops to ~0.13 at step 5.
* **Orange (Qwen2.5):** Starts at ~0.28, drops to ~0.05 at step 5.
#### 2. Success Rate (Center Chart)
* **Trend:** Most models show a sharp decline in success rate as backtracking steps increase, with the exception of the Purple line, which remains significantly higher than the others.
* **Data Points (Approximate):**
* **Purple (Gemini-2.5):** Starts at ~0.90, drops to ~0.63 at step 2, fluctuates slightly, ending at ~0.63 at step 5.
* **Red (Gemini-2.0):** Starts at ~0.55, drops sharply to ~0.25 at step 1, and continues to near 0.0 by step 5.
* **Blue (Llama-4):** Starts at ~0.25, drops to near 0.0 by step 1.
* **Green (Llama-3.1):** Starts near 0.03, remains very low throughout, ending near 0.0.
* **Orange (Qwen2.5):** Remains at ~0.0 throughout all steps.
#### 3. Number of Tokens (Right Chart)
* **Trend:** All models show an upward trend or stability in token usage as backtracking steps increase, indicating higher computational cost.
* **Data Points (Approximate):**
* **Blue (Llama-4):** Highest usage, starting at ~1580, rising to ~1800 at step 5.
* **Orange (Qwen2.5):** Starts at ~900, rises to ~1100 at step 5.
* **Green (Llama-3.1):** Starts at ~630, rises to ~870 at step 5.
* **Red (Gemini-2.0):** Starts at ~330, rises to ~410 at step 5.
* **Purple (Gemini-2.5):** Lowest usage, starting at ~280, rising to ~410 at step 5.
---
### Key Observations
* **Performance Outlier:** The **Gemini-2.5-flash-preview-04-17 (Purple)** model is the clear outlier, maintaining a significantly higher "Progress ratio mean" and "Success rate" compared to all other models, despite having the lowest token usage.
* **Inverse Correlation:** There is a general inverse correlation between "Number of backtracking steps" and performance metrics (Progress/Success). As the models are forced to backtrack more, their success and progress rates decline.
* **Cost Inefficiency:** The "Number of tokens" chart shows that increasing backtracking steps increases the computational cost (tokens) for all models, yet the performance metrics (Progress/Success) decrease. This suggests that for these models, the backtracking mechanism is inefficient.
* **Model Failure:** The **Qwen2.5-coder-32b-instruct (Orange)** model shows a near-zero success rate across all backtracking steps, suggesting it is not suited for this specific task or backtracking configuration.
### Interpretation
The data demonstrates that increasing the number of backtracking steps is generally detrimental to the performance of these LLMs in the tested task. Despite the increased computational cost (evidenced by the rising number of tokens), the models fail to achieve higher success rates or progress ratios.
The **Gemini-2.5-flash-preview-04-17** model demonstrates superior robustness, maintaining high performance even as backtracking steps increase, whereas other models see their success rates collapse almost immediately (e.g., Llama-4 and Gemini-2.0). This suggests that the backtracking mechanism implemented here may be causing "hallucination loops" or confusion in the models, where they spend more tokens to achieve worse results, with the exception of the Gemini-2.5 model which handles the process more effectively.