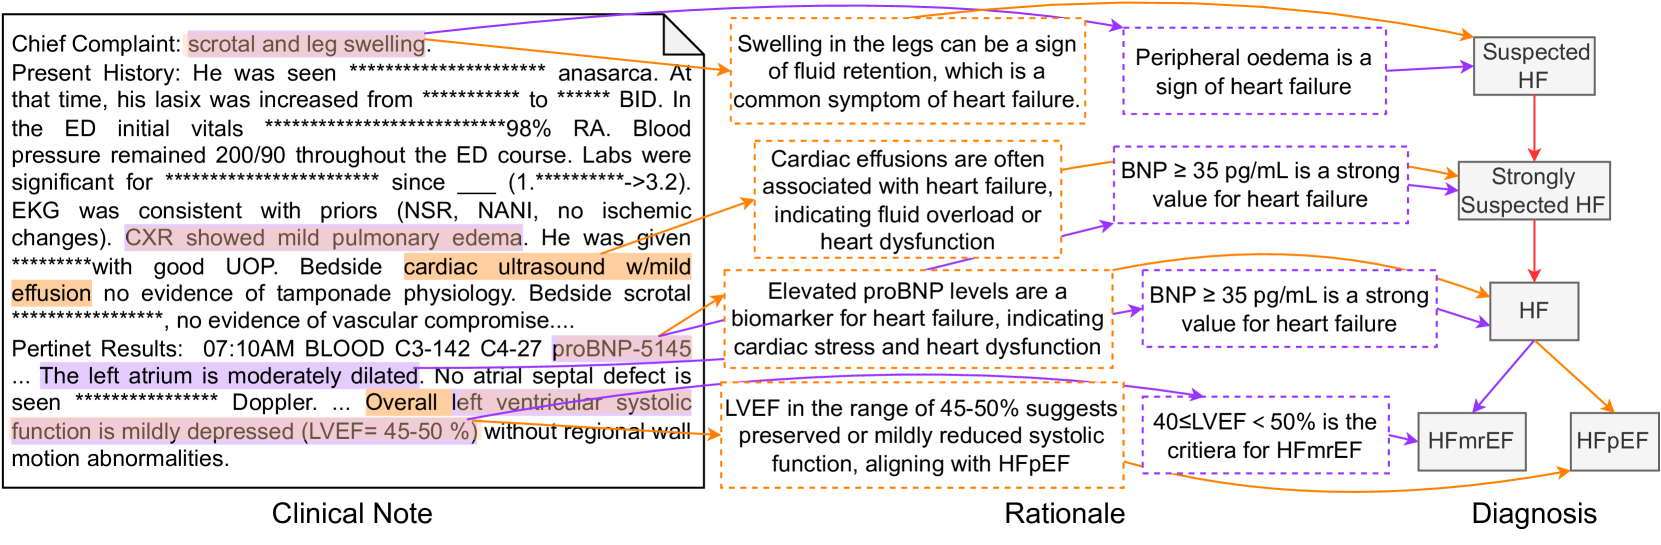
\n
## Diagram: Heart Failure Diagnostic Pathway
### Overview
This diagram illustrates a diagnostic pathway for heart failure (HF), linking clinical notes, rationale, and potential diagnoses. It presents a flow of information from patient presentation to suspected or confirmed HF, categorized into three sections: Clinical Note, Rationale, and Diagnosis. The diagram uses arrows to indicate the progression of assessment and potential outcomes.
### Components/Axes
The diagram is divided into three main columns:
* **Clinical Note (Left):** Contains a block of text representing patient history and examination findings.
* **Rationale (Center):** Provides medical reasoning connecting clinical findings to potential diagnoses.
* **Diagnosis (Right):** Presents possible diagnoses based on the rationale, categorized into Suspected HF, Strongly Suspected HF, HF, HFmrEF, and HFpEF.
The diagram also includes connecting arrows with associated conditions or thresholds.
### Detailed Analysis or Content Details
**Clinical Note:**
The clinical note contains the following information:
* **Chief Complaint:** scrotal and leg swelling.
* **Present History:** Patient was seen with anasarca. His lasix was increased from ******* to ******* BID. In the ED initial vitals ******* 99% RA. Blood pressure remained 200/90 throughout the ED course. Labs were significant for ******* since (1.******->3.2). EKG was consistent with priors (NSR, NANI, no ischemic changes). CXR showed mild pulmonary edema. He was given ******* with UOP. Bedside cardiac ultrasound w/mild effusion no evidence of tamponade physiology. Bedside scrotal *******, no evidence of vascular compromise.
* **Pertinent Results:** 07:10AM BLOOD C3-142 C4-27 proBNP-5145. The left atrium is moderately dilated. No atrial septal defect is seen. Doppler. Overall left ventricular systolic function is mildly depressed (LVEF= 45-50 %) without regional wall motion abnormalities.
**Rationale:**
* Swelling in the legs can be a sign of fluid retention, which is a common symptom of heart failure.
* Cardiac effusions are often associated with heart failure, indicating fluid overload or heart dysfunction.
* Elevated proBNP levels are a biomarker for heart failure, indicating cardiac stress and heart dysfunction.
* LVEF in the range of 45-50% suggests preserved or mildly reduced systolic function, aligning with HFmrEF.
**Diagnosis:**
* **Peripheral edema is a sign of heart failure:** Leads to "Suspected HF" (represented by a light blue rectangle).
* **BNP ≥ 35 pg/mL is a strong value for heart failure:** Leads to "Strongly Suspected HF" (represented by a medium blue rectangle).
* **BNP ≥ 35 pg/mL is a strong value for heart failure:** Leads to "HF" (represented by a dark blue rectangle).
* **40≤LVEF <50% is the criteria for HFmrEF:** Leads to "HFmrEF" (represented by a purple rectangle).
* **LVEF <40%:** Leads to "HFpEF" (represented by a pink rectangle).
**Arrows and Connections:**
* An arrow connects "Peripheral edema is a sign of heart failure" to "Suspected HF".
* An arrow connects "BNP ≥ 35 pg/mL is a strong value for heart failure" to "Strongly Suspected HF".
* An arrow connects "BNP ≥ 35 pg/mL is a strong value for heart failure" to "HF".
* An arrow connects "40≤LVEF <50% is the criteria for HFmrEF" to "HFmrEF".
* An arrow connects "LVEF <40%" to "HFpEF".
### Key Observations
* The diagram presents a sequential diagnostic process, starting with clinical observations and progressing to potential diagnoses.
* BNP levels are highlighted as a key diagnostic indicator.
* LVEF is used to differentiate between HFmrEF and HFpEF.
* The clinical note contains redacted information (represented by *******), obscuring specific details.
* The proBNP level is reported as 5145.
* The LVEF is reported as 45-50%.
### Interpretation
The diagram illustrates a clinical decision-making process for diagnosing heart failure. It emphasizes the importance of clinical findings (edema), biomarkers (BNP), and echocardiographic measurements (LVEF) in guiding diagnosis. The flow suggests that the presence of edema initially leads to a suspicion of HF, which is strengthened by elevated BNP levels. Further assessment with LVEF helps to categorize the type of HF (HFmrEF or HFpEF). The redacted information in the clinical note limits a complete understanding of the patient's presentation, but the diagram provides a clear framework for the diagnostic approach. The diagram is a simplified representation of a complex clinical scenario, and clinical judgment is essential in interpreting the results and making a final diagnosis. The diagram suggests a tiered approach to diagnosis, with increasing certainty as more data becomes available. The use of color-coding (blue shades for increasing suspicion, purple and pink for specific HF types) aids in visual understanding of the diagnostic pathway.