## Clinical Diagnostic Flowchart: Heart Failure Pathway
### Overview
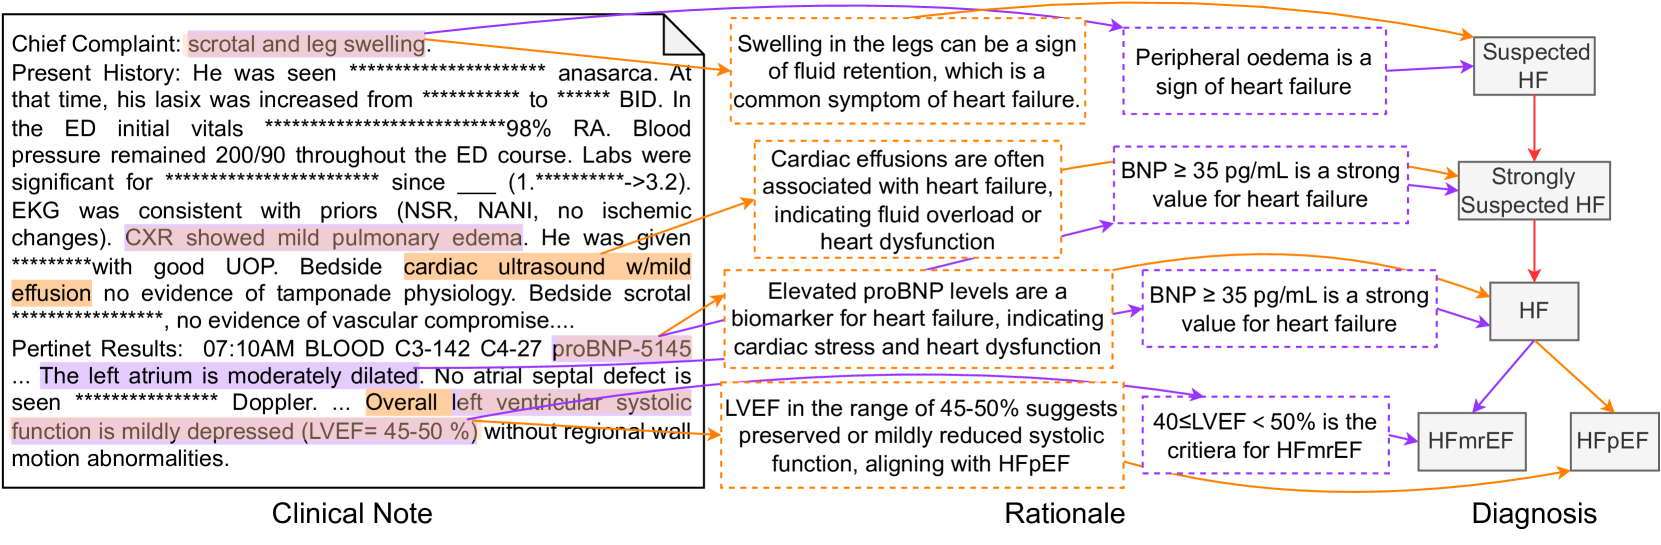
This image is a technical medical diagram illustrating the diagnostic reasoning pathway from a patient's clinical presentation to a final diagnosis of heart failure (HF) and its subtypes. It visually maps specific findings from a clinical note to medical rationales, which then lead to diagnostic conclusions. The diagram is structured into three distinct vertical sections: **Clinical Note** (left), **Rationale** (center), and **Diagnosis** (right), connected by color-coded arrows.
### Components/Axes
The diagram is organized into three primary regions:
1. **Clinical Note (Left Section):** A text block containing a de-identified patient history and findings. Key text is highlighted in pink and orange.
2. **Rationale (Center Section):** A series of six rectangular boxes with dashed borders (orange and purple) containing explanatory medical statements that interpret the clinical findings.
3. **Diagnosis (Right Section):** A flowchart of five solid-bordered gray boxes representing diagnostic conclusions, connected by directional arrows.
**Connecting Elements:**
* **Orange Arrows:** Originate from highlighted text in the Clinical Note and point to corresponding Rationale boxes.
* **Purple Arrows:** Originate from Rationale boxes and point to the relevant Diagnostic conclusion boxes.
* **Red Arrow:** Connects "Suspected HF" to "Strongly Suspected HF" within the Diagnosis flowchart.
### Detailed Analysis
#### **Clinical Note Content (Transcribed)**
* **Chief Complaint:** scrotal and leg swelling.
* **Present History:** He was seen *********************** anasarca. At that time, his lasix was increased from ************ to ***** BID. In the ED initial vitals ***********************98% RA. Blood pressure remained 200/90 throughout the ED course. Labs were significant for *********************** since ___ (1.**********->3.2). EKG was consistent with priors (NSR, NANI, no ischemic changes). **CXR showed mild pulmonary edema.** He was given ************with good UOP. Bedside **cardiac ultrasound w/mild effusion** no evidence of tamponade physiology. Bedside scrotal ***********************, no evidence of vascular compromise....
* **Pertinent Results:** 07:10AM BLOOD C3-142 C4-27 **proBNP-5145** ... **The left atrium is moderately dilated.** No atrial septal defect is seen *************** Doppler. ... **Overall left ventricular systolic function is mildly depressed (LVEF= 45-50 %)** without regional wall motion abnormalities.
#### **Rationale Boxes (Transcribed)**
1. (Top, Orange Border) Swelling in the legs can be a sign of fluid retention, which is a common symptom of heart failure.
2. (Top, Purple Border) Peripheral oedema is a sign of heart failure.
3. (Middle, Orange Border) Cardiac effusions are often associated with heart failure, indicating fluid overload or heart dysfunction.
4. (Middle, Purple Border) BNP ≥ 35 pg/mL is a strong value for heart failure.
5. (Bottom, Orange Border) Elevated proBNP levels are a biomarker for heart failure, indicating cardiac stress and heart dysfunction.
6. (Bottom, Purple Border) LVEF in the range of 45-50% suggests preserved or mildly reduced systolic function, aligning with HFpEF.
7. (Bottom, Purple Border) 40≤LVEF < 50% is the criteria for HFmrEF.
#### **Diagnosis Flowchart Structure**
* **Suspected HF** (Top) → (Red Arrow) → **Strongly Suspected HF**
* **Strongly Suspected HF** → (Purple Arrow) → **HF**
* **HF** branches into two subtypes:
* (Orange Arrow) → **HFmrEF** (Heart Failure with mildly Reduced Ejection Fraction)
* (Purple Arrow) → **HFpEF** (Heart Failure with preserved Ejection Fraction)
### Key Observations
1. **Direct Evidence Mapping:** Each highlighted clinical finding (e.g., leg swelling, pulmonary edema, mild effusion, proBNP-5145, LVEF 45-50%) has a direct orange arrow linking it to a specific medical rationale.
2. **Diagnostic Thresholds:** The rationales explicitly state diagnostic thresholds: BNP ≥ 35 pg/mL is "strong," and LVEF between 40-50% defines HFmrEF.
3. **Patient-Specific Data:** The patient's proBNP is **5145**, which is vastly higher than the 35 pg/mL threshold mentioned, strongly supporting the diagnosis. The LVEF of **45-50%** falls precisely within the cited range for HFmrEF (40≤LVEF<50%).
4. **Visual Logic Flow:** The diagram creates a clear, left-to-right logical chain: **Clinical Finding → Pathophysiological Rationale → Diagnostic Conclusion**.
### Interpretation
This diagram serves as a visual case study in clinical reasoning for heart failure. It demonstrates how a clinician synthesizes disparate data points—symptoms (edema), imaging (CXR, ultrasound), and lab values (proBNP, LVEF)—into a coherent diagnostic narrative.
The data suggests a patient with clear signs of fluid overload (anasarca, pulmonary edema, effusion) and objective biomarker evidence of cardiac stress (extremely elevated proBNP). The preserved but mildly reduced ejection fraction (LVEF 45-50%) is the key differentiator, leading the diagnosis specifically to **HFmrEF** rather than HFpEF (which typically requires LVEF ≥50%) or HFrEF (LVEF <40%).
The diagram's structure emphasizes that diagnosis is not based on a single finding but on the convergence of multiple lines of evidence. The use of color-coded arrows explicitly shows which clinical facts support which medical principles, and how those principles collectively justify the final diagnostic labels. It effectively translates a complex clinical note into an auditable, logical pathway.