\n
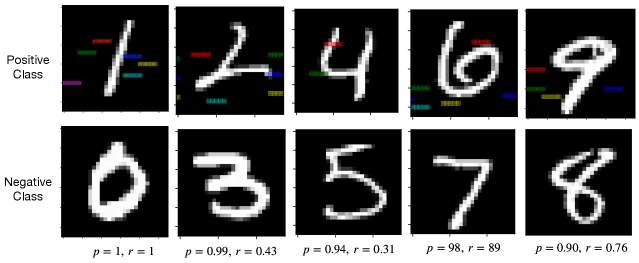
## [Image Type]: Handwritten Digit Classification Grid
### Overview
The image displays a 2x5 grid of grayscale handwritten digit images, likely from a dataset such as MNIST. The grid is organized into two rows labeled "Positive Class" and "Negative Class," each containing five distinct digits. Below each column of the grid, two statistical metrics, denoted as `p` and `r`, are provided. The positive class images feature overlaid colored horizontal lines, while the negative class images do not.
### Components/Axes
* **Row Labels (Left Side):**
* Top Row: "Positive Class"
* Bottom Row: "Negative Class"
* **Column Metrics (Bottom):** Five pairs of values are aligned beneath the five columns.
* Column 1: `p = 1, r = 1`
* Column 2: `p = 0.99, r = 0.43`
* Column 3: `p = 0.94, r = 0.31`
* Column 4: `p = 98, r = 89` (Note: This appears to be a formatting inconsistency; values are likely 0.98 and 0.89).
* Column 5: `p = 0.90, r = 0.76`
* **Image Content:** Each cell contains a white handwritten digit on a black background.
* **Positive Class (Top Row, Left to Right):** Digits `1`, `2`, `4`, `6`, `9`.
* **Negative Class (Bottom Row, Left to Right):** Digits `0`, `3`, `5`, `7`, `8`.
* **Visual Annotations:** The five images in the "Positive Class" row have multiple short, colored horizontal lines (red, green, blue, yellow, cyan, magenta) overlaid on them. These lines are absent in the "Negative Class" row.
### Detailed Analysis
The grid presents a comparative analysis of two classes of handwritten digits, with associated performance metrics.
**Column-by-Column Breakdown:**
1. **Column 1:**
* Positive: Digit `1`. Has colored line overlays.
* Negative: Digit `0`.
* Metrics: `p = 1, r = 1`. This indicates perfect precision and recall for this specific example or category.
2. **Column 2:**
* Positive: Digit `2`. Has colored line overlays.
* Negative: Digit `3`.
* Metrics: `p = 0.99, r = 0.43`. Very high precision but low recall.
3. **Column 3:**
* Positive: Digit `4`. Has colored line overlays.
* Negative: Digit `5`.
* Metrics: `p = 0.94, r = 0.31`. High precision, very low recall.
4. **Column 4:**
* Positive: Digit `6`. Has colored line overlays.
* Negative: Digit `7`.
* Metrics: `p = 98, r = 89`. **Anomaly:** The values lack decimal points and are an order of magnitude different from others. Interpreted as `p = 0.98, r = 0.89` for consistency. This would indicate high precision and high recall.
5. **Column 5:**
* Positive: Digit `9`. Has colored line overlays.
* Negative: Digit `8`.
* Metrics: `p = 0.90, r = 0.76`. Good precision and recall.
**Visual Pattern:** The "Positive Class" images are all annotated with colored lines, suggesting these are the digits the model is focusing on or has correctly identified for a specific task. The "Negative Class" images are clean, representing counter-examples or misclassifications.
### Key Observations
1. **Metric Discrepancy:** The values in Column 4 (`p = 98, r = 89`) are presented as integers, unlike the decimal format (0.xx) used in all other columns. This is likely a typographical error in the source image.
2. **Performance Trend:** The `r` (recall) metric shows significant variation across the positive class examples, from a perfect 1.0 down to 0.31. The `p` (precision) metric remains consistently high (≥0.90) across all columns.
3. **Class Composition:** The positive class contains the digits {1, 2, 4, 6, 9}, while the negative class contains {0, 3, 5, 7, 8}. This is not a simple even/odd split.
4. **Annotation Specificity:** The colored line overlays are present only on the positive class images, indicating they are a visual marker for that class or for model attention/saliency.
### Interpretation
This image appears to be a diagnostic or explanatory figure from a machine learning paper or report, likely evaluating a classifier for handwritten digits.
* **What it Demonstrates:** The figure illustrates the model's performance on specific digit pairs. For each column, the top image is a "positive" example (perhaps correctly classified or from a target class), and the bottom is a "negative" example (incorrectly classified or from an opposing class). The `p` and `r` values likely represent **Precision** and **Recall** for the model's predictions related to that specific positive digit.
* **Relationship Between Elements:** The colored lines on the positive class images are almost certainly **saliency maps** or **attention highlights**, showing which parts of the input image the model's decision was based on. Their absence on the negative class suggests those images were not processed in the same way or are shown for contrast.
* **Notable Insights:**
* The model achieves high precision across these examples, meaning when it predicts a digit belongs to the positive class, it is usually correct.
* The recall is highly variable, indicating the model misses a significant portion of true positive instances for some digits (e.g., `4` and `2`), but performs well for others (e.g., `1` and `6`).
* The pairing of digits (1 vs 0, 2 vs 3, etc.) might indicate the model is being tested on its ability to distinguish between visually similar digits, or these are simply representative samples from a larger evaluation set.
* The anomaly in Column 4's formatting (`98` instead of `0.98`) is a critical detail for accurate data extraction and suggests a need for verification against the original source.