## Counterfactual Fairness Audit for Attribute: "black"
### Overview
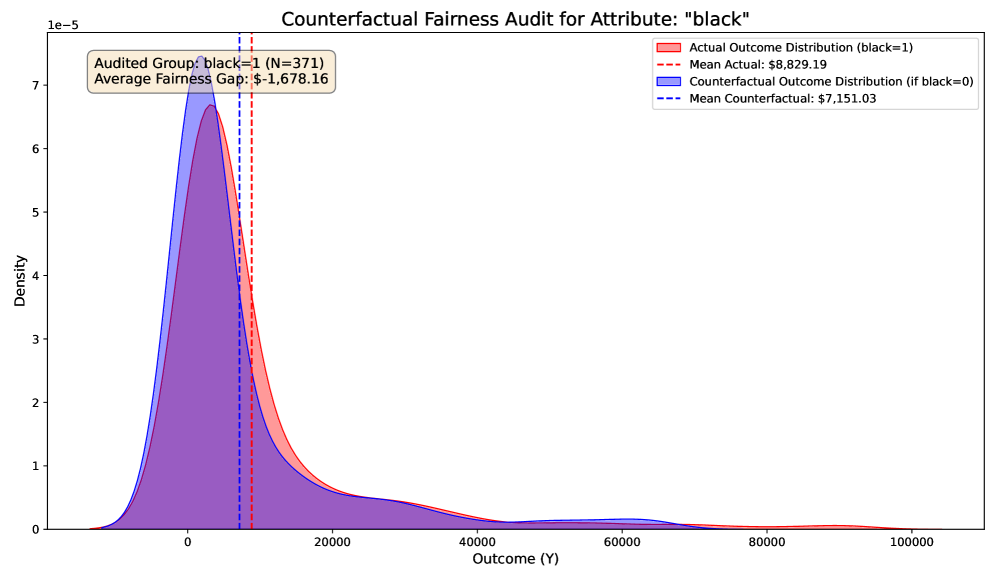
The image presents a comparative analysis of outcome distributions for a fairness audit focused on the attribute "black". It visualizes two probability density functions (PDFs) representing actual outcomes (black=1) and counterfactual outcomes (if black=0), with mean values and a calculated fairness gap.
### Components/Axes
- **X-axis**: "Outcome (Y)" (range: 0–100,000)
- **Y-axis**: "Density" (scale: 0–1e-5)
- **Legend**:
- Red solid line: Actual Outcome Distribution (black=1)
- Blue solid line: Counterfactual Outcome Distribution (if black=0)
- Red dashed line: Mean Actual ($8,829.19)
- Blue dashed line: Mean Counterfactual ($7,151.03)
- **Text Box**:
- "Audited Group: black=1 (N=371)"
- "Average Fairness Gap: $-1,678.16"
### Detailed Analysis
1. **Distributions**:
- The **Actual Outcome Distribution (red)** peaks sharply near $10,000, with a long right tail extending to ~$20,000.
- The **Counterfactual Outcome Distribution (blue)** peaks at ~$7,000, with a broader spread and a slower decay.
- Both distributions overlap significantly in the $0–$20,000 range but diverge at higher values.
2. **Mean Values**:
- The mean of the Actual Outcome ($8,829.19) is higher than the Counterfactual Outcome ($7,151.03), as indicated by the dashed lines.
- The **Average Fairness Gap** ($-1,678.16) quantifies the disparity between the two means.
3. **Spatial Elements**:
- The legend is positioned in the **top-right corner**, clearly associating colors with distributions.
- The text box is anchored in the **top-left corner**, providing contextual metadata.
### Key Observations
- The Actual Outcome Distribution (black=1) is skewed toward higher values compared to the Counterfactual (black=0).
- The fairness gap suggests a systematic bias: outcomes for the audited group (black=1) are consistently higher than the counterfactual scenario.
- The overlap in lower-value ranges indicates variability in outcomes, but the mean difference highlights a structural disparity.
### Interpretation
The chart demonstrates that the attribute "black" significantly influences outcomes, with the audited group (black=1) experiencing a **$1,678.16 higher mean outcome** than the counterfactual group (black=0). This disparity suggests potential unfairness in the model’s predictions, as outcomes are not invariant to the "black" attribute. The distributions’ shapes imply that while individual outcomes vary, the systemic gap persists, warranting further investigation into the root causes of this bias. The fairness gap’s negative sign indicates the direction of the disparity, emphasizing the need for corrective measures to ensure equitable outcomes across groups.