## Line Graph: Optimal Panning Gains for Varying Acoustic Power Targets
### Overview
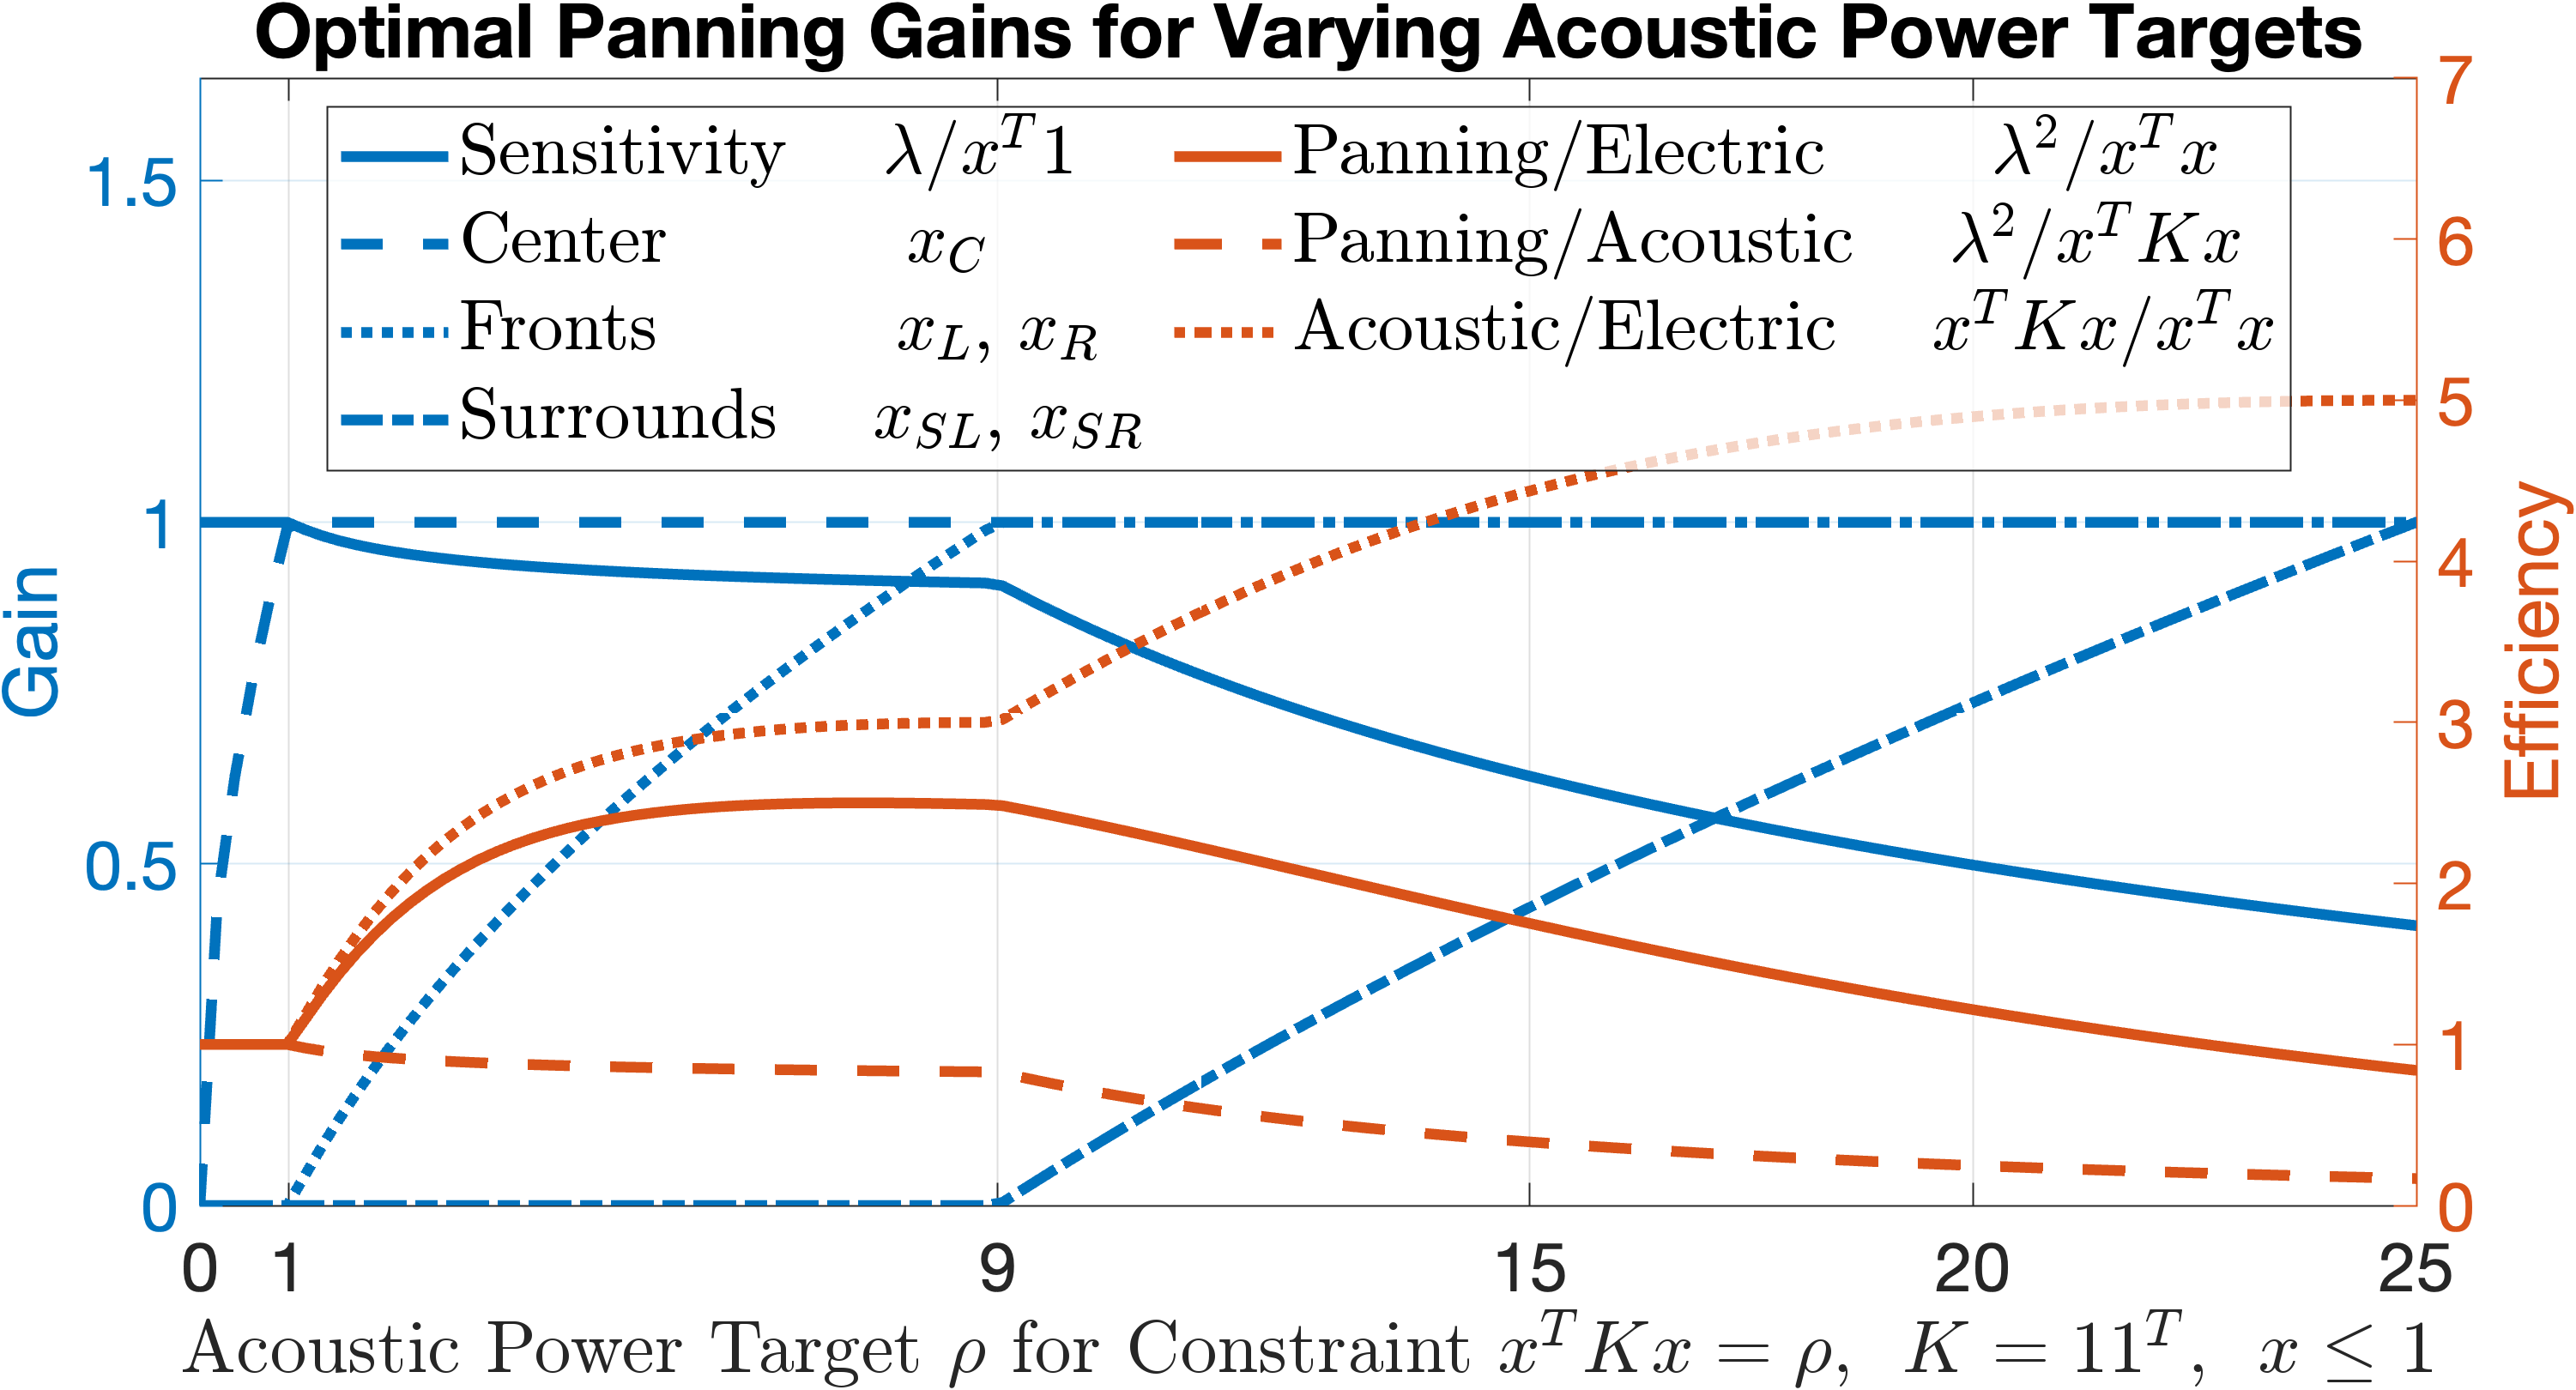
The graph illustrates the relationship between acoustic power targets (ρ) and multiple performance metrics: sensitivity, panning gains, and efficiency. It includes six distinct data series with varying trends, plotted against a shared x-axis (acoustic power target) and two y-axes (gain and efficiency).
### Components/Axes
- **X-axis**: "Acoustic Power Target ρ for Constraint x^T Kx = ρ, K = 11^T, x ≤ 1" (0–25)
- **Primary Y-axis (left)**: "Gain" (0–1.5)
- **Secondary Y-axes (right)**:
- "Efficiency" (0–7)
- "Panning/Acoustic" (0–6)
- **Legends**:
- **Left**:
- Sensitivity (solid blue)
- Center (dashed blue)
- Fronts (dotted blue)
- Surrounds (dash-dot blue)
- **Right**:
- Panning/Electric (solid red)
- Panning/Acoustic (dashed red)
- Acoustic/Electric (dotted red)
### Detailed Analysis
1. **Sensitivity (solid blue)**:
- Starts at 1.0 (ρ=0), decreases slightly to ~0.95 at ρ=25.
- Trend: Gradual decline with minimal curvature.
2. **Center (dashed blue)**:
- Starts at 0 (ρ=0), rises sharply to 1.0 at ρ=5, then plateaus.
- Trend: Sharp initial increase, then flat.
3. **Fronts (dotted blue)**:
- Starts at 0 (ρ=0), peaks at ~1.5 at ρ=10, then drops to ~0.5 at ρ=25.
- Trend: Bell-shaped curve with a clear maximum.
4. **Surrounds (dash-dot blue)**:
- Starts at 0 (ρ=0), peaks at ~1.0 at ρ=15, then declines to ~0.3 at ρ=25.
- Trend: Moderate rise followed by a gradual decline.
5. **Panning/Electric (solid red)**:
- Starts at 0 (ρ=0), rises to ~5 at ρ=10, then plateaus.
- Trend: Linear increase with a plateau.
6. **Panning/Acoustic (dashed red)**:
- Starts at 0 (ρ=0), peaks at ~3 at ρ=15, then drops to ~1 at ρ=25.
- Trend: Parabolic rise and fall.
7. **Acoustic/Electric (dotted red)**:
- Starts at 0 (ρ=0), rises steadily to ~7 at ρ=25.
- Trend: Linear increase with no plateau.
### Key Observations
- **Peak Efficiency**: The Acoustic/Electric (dotted red) line reaches the highest efficiency (~7) at ρ=25, suggesting optimal performance at maximum power.
- **Sensitivity vs. Gain**: The Sensitivity (solid blue) and Center (dashed blue) lines show inverse relationships with the Fronts (dotted blue) and Surrounds (dash-dot blue) lines, indicating trade-offs between spatial focus and overall gain.
- **Panning Ratios**: The Panning/Acoustic (dashed red) line peaks at ρ=15, while Panning/Electric (solid red) plateaus earlier, highlighting differing panning dynamics under electric vs. acoustic constraints.
### Interpretation
The graph demonstrates how acoustic power targets influence system performance across multiple dimensions:
- **Sensitivity and Gain**: Lower power targets (ρ < 5) prioritize sensitivity and center-focused gains, while higher targets (ρ > 10) favor broader spatial coverage (Fronts/Surrounds).
- **Efficiency**: The Acoustic/Electric configuration (dotted red) achieves the highest efficiency, suggesting it is the most resource-effective design.
- **Panning Dynamics**: The Panning/Acoustic (dashed red) line’s peak at ρ=15 implies a critical point where acoustic panning is maximized, potentially useful for optimizing spatial audio systems.
The data suggests that optimal panning gains depend on balancing sensitivity, spatial coverage, and efficiency, with trade-offs between electric and acoustic constraints. The Fronts and Surrounds lines highlight the importance of spatial distribution in system design.