## Scatter Plot: Reasoning Tokens vs. Problem Size by Difficulty
### Overview
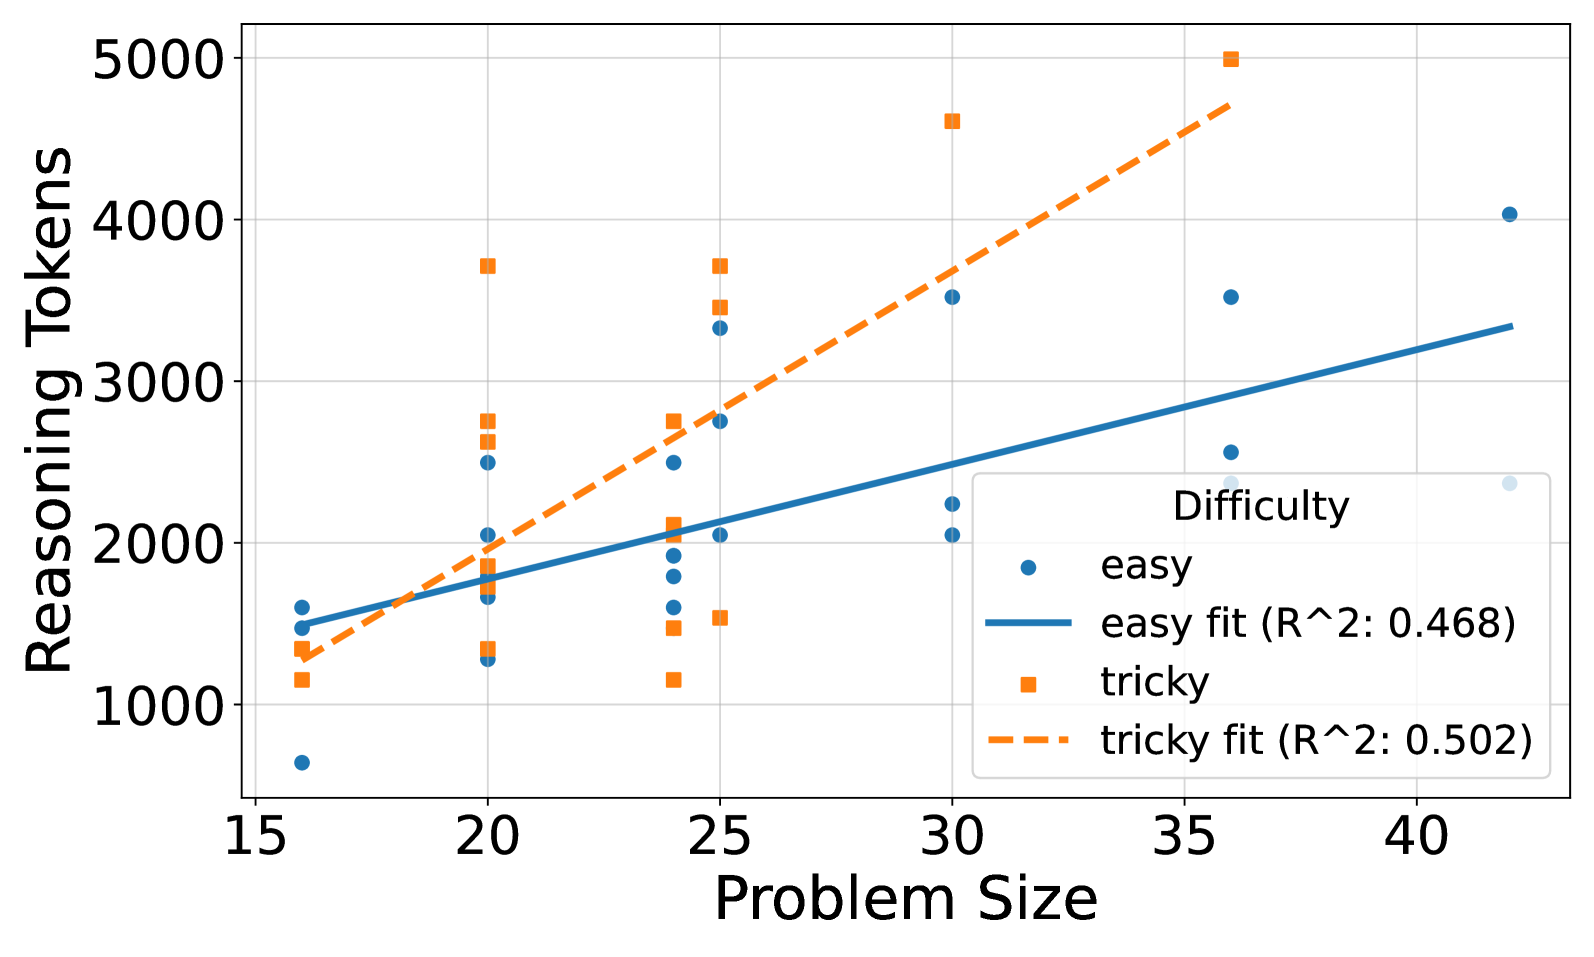
The image is a scatter plot showing the relationship between "Reasoning Tokens" and "Problem Size" for two categories of problem difficulty: "easy" and "tricky". The plot includes trend lines (linear fits) for each difficulty level, along with their corresponding R-squared values.
### Components/Axes
* **X-axis:** "Problem Size", ranging from 15 to 40 in increments of 5.
* **Y-axis:** "Reasoning Tokens", ranging from 1000 to 5000 in increments of 1000.
* **Data Series 1:** "easy" - represented by blue circles.
* **Data Series 2:** "tricky" - represented by orange squares.
* **Trend Line 1:** "easy fit (R^2: 0.468)" - a solid blue line.
* **Trend Line 2:** "tricky fit (R^2: 0.502)" - a dashed orange line.
* **Legend:** Located in the bottom-right corner, labeled "Difficulty", explaining the color and marker scheme for each difficulty level and their corresponding trend lines.
### Detailed Analysis
**"easy" Data Series (Blue Circles):**
* **Trend:** The "easy" data series shows a generally positive, but weak, correlation between problem size and reasoning tokens.
* **Data Points:**
* Problem Size ~15: Reasoning Tokens ~650
* Problem Size ~17: Reasoning Tokens ~1500
* Problem Size ~20: Reasoning Tokens ~1300, ~1600, ~2500
* Problem Size ~23: Reasoning Tokens ~1800, ~2000
* Problem Size ~25: Reasoning Tokens ~2000, ~3400
* Problem Size ~30: Reasoning Tokens ~2200
* Problem Size ~35: Reasoning Tokens ~3500
* Problem Size ~40: Reasoning Tokens ~4000
* Problem Size ~42: Reasoning Tokens ~2300
**"easy fit (R^2: 0.468)" Trend Line (Solid Blue):**
* The blue trend line starts at approximately 1400 Reasoning Tokens at a Problem Size of 15 and increases to approximately 3400 Reasoning Tokens at a Problem Size of 40.
**"tricky" Data Series (Orange Squares):**
* **Trend:** The "tricky" data series shows a stronger positive correlation between problem size and reasoning tokens compared to the "easy" series.
* **Data Points:**
* Problem Size ~15: Reasoning Tokens ~1200
* Problem Size ~20: Reasoning Tokens ~1700, ~2700, ~3700
* Problem Size ~23: Reasoning Tokens ~1100, ~1500
* Problem Size ~25: Reasoning Tokens ~2600
* Problem Size ~30: Reasoning Tokens ~4700
* Problem Size ~35: Reasoning Tokens ~5000
**"tricky fit (R^2: 0.502)" Trend Line (Dashed Orange):**
* The orange trend line starts at approximately 1300 Reasoning Tokens at a Problem Size of 15 and increases to approximately 4700 Reasoning Tokens at a Problem Size of 40.
### Key Observations
* The "tricky" problems generally require more reasoning tokens than the "easy" problems for a given problem size.
* The R-squared value for the "tricky" fit (0.502) is slightly higher than the R-squared value for the "easy" fit (0.468), indicating a slightly better linear fit for the "tricky" data.
* There is considerable variance in the number of reasoning tokens for both difficulty levels at each problem size.
### Interpretation
The scatter plot suggests that problem size is positively correlated with the number of reasoning tokens required to solve a problem, and that "tricky" problems generally require more reasoning tokens than "easy" problems. The relatively low R-squared values for both trend lines indicate that problem size is not the only factor influencing the number of reasoning tokens required. Other factors, such as the specific nature of the problem, likely play a significant role. The variance in reasoning tokens at each problem size further supports this conclusion.