## Scatter Plot with Linear Regression: Reasoning Tokens vs. Problem Size by Difficulty
### Overview
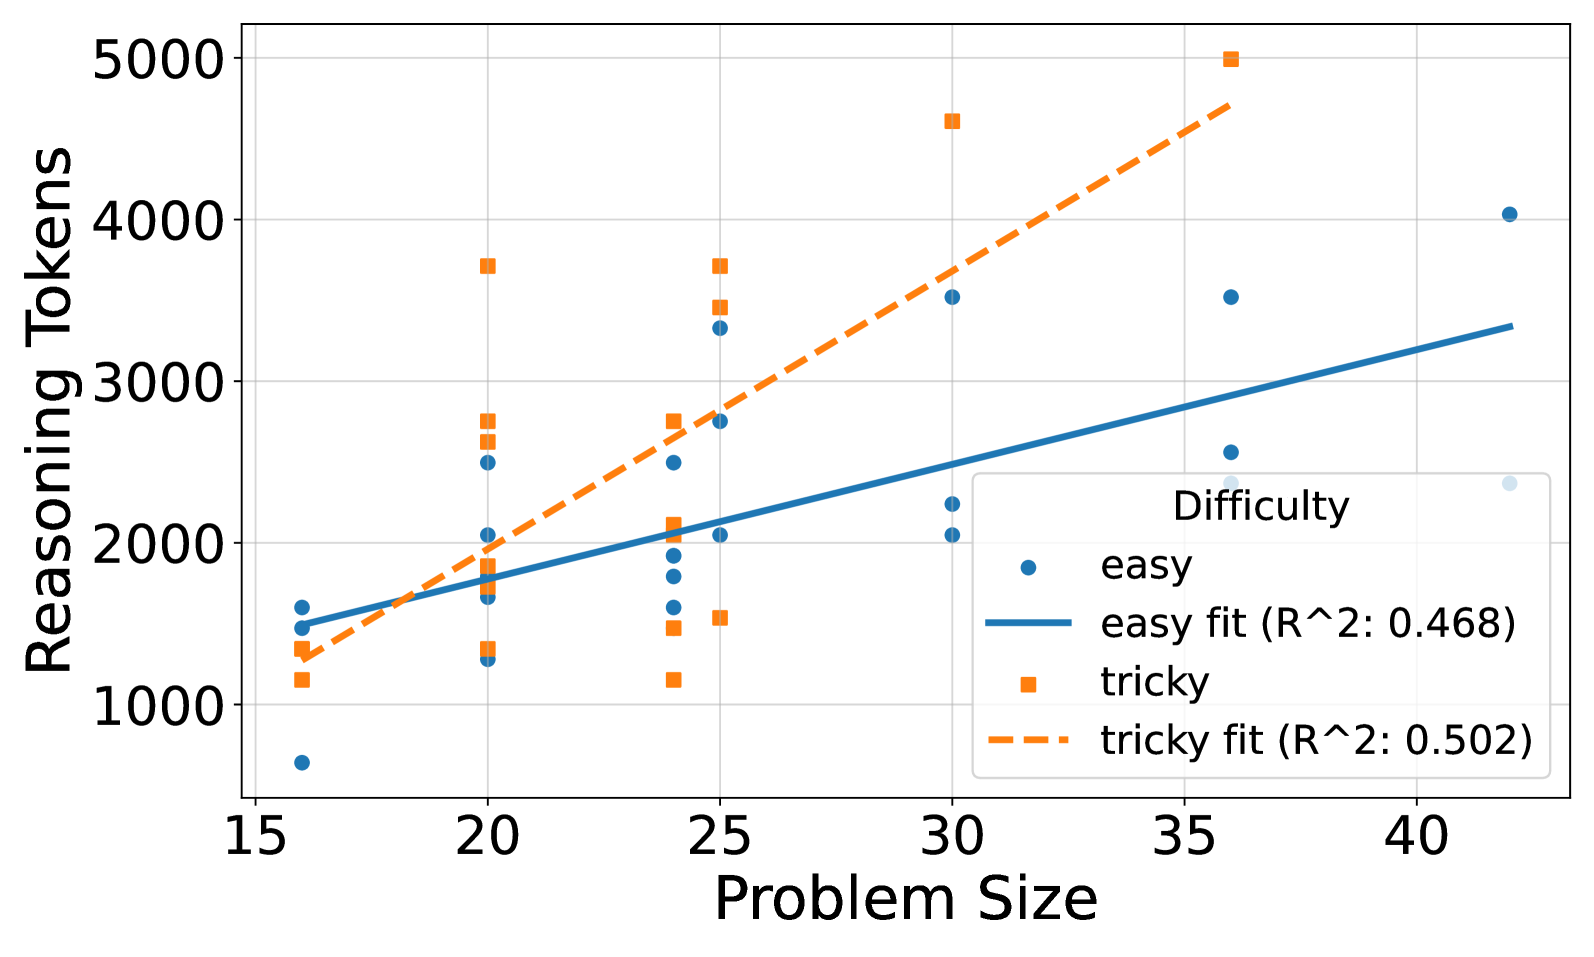
This image is a scatter plot with two overlaid linear regression lines. It visualizes the relationship between "Problem Size" (x-axis) and the number of "Reasoning Tokens" (y-axis) required, categorized by problem difficulty: "easy" and "tricky". The chart suggests that as problem size increases, the reasoning tokens required also increase, with a notably steeper increase for "tricky" problems.
### Components/Axes
* **X-Axis:** Labeled "Problem Size". The scale runs from approximately 15 to 42, with major tick marks at 15, 20, 25, 30, 35, and 40.
* **Y-Axis:** Labeled "Reasoning Tokens". The scale runs from approximately 500 to 5000, with major tick marks at 1000, 2000, 3000, 4000, and 5000.
* **Legend:** Located in the bottom-right quadrant of the chart area. It contains four entries:
1. **easy:** Represented by blue circle markers (●).
2. **easy fit (R^2: 0.468):** Represented by a solid blue line.
3. **tricky:** Represented by orange square markers (■).
4. **tricky fit (R^2: 0.502):** Represented by a dashed orange line.
* **Data Series:** Two distinct series are plotted:
* **Easy Series (Blue Circles):** Data points for problems classified as "easy".
* **Tricky Series (Orange Squares):** Data points for problems classified as "tricky".
### Detailed Analysis
**Trend Verification:**
* The **blue "easy" fit line** has a positive, moderate upward slope.
* The **orange "tricky" fit line** has a positive, steeper upward slope compared to the easy line.
**Data Point Extraction (Approximate Values):**
*Points are listed from left to right along the x-axis. Values are approximate based on visual alignment with the grid.*
**Easy Series (Blue Circles):**
* At Problem Size ~16: Reasoning Tokens ~700 and ~1600.
* At Problem Size ~20: Reasoning Tokens ~1300, ~1700, ~2000, and ~2500.
* At Problem Size ~24: Reasoning Tokens ~1600, ~1800, ~1900, ~2500, and ~3300.
* At Problem Size ~25: Reasoning Tokens ~2050 and ~2750.
* At Problem Size ~30: Reasoning Tokens ~2050, ~2200, and ~3500.
* At Problem Size ~36: Reasoning Tokens ~2550 and ~3500.
* At Problem Size ~42: Reasoning Tokens ~4000.
**Tricky Series (Orange Squares):**
* At Problem Size ~16: Reasoning Tokens ~1150 and ~1350.
* At Problem Size ~20: Reasoning Tokens ~1350, ~1850, ~2650, ~2750, and ~3700.
* At Problem Size ~24: Reasoning Tokens ~1150, ~1500, ~2100, ~2750, and ~3450.
* At Problem Size ~25: Reasoning Tokens ~1550 and ~3700.
* At Problem Size ~30: Reasoning Tokens ~4600.
* At Problem Size ~36: Reasoning Tokens ~5000.
**Regression Lines:**
* The **easy fit line** starts at approximately (16, 1500) and ends near (42, 3350). Its R-squared value is 0.468.
* The **tricky fit line** starts at approximately (16, 1300) and ends near (36, 4700). Its R-squared value is 0.502.
### Key Observations
1. **Diverging Slopes:** The most prominent feature is the difference in slope between the two regression lines. The "tricky" line is significantly steeper, indicating that reasoning token count grows at a faster rate with problem size for tricky problems compared to easy ones.
2. **Variance:** Both data series show considerable vertical spread (variance) at similar problem sizes, especially in the 20-25 range. This suggests problem size alone is not the sole determinant of reasoning tokens; other factors within the "easy" or "tricky" category also play a role.
3. **Outliers:** The highest data point on the chart is an orange square (tricky) at Problem Size ~36 with ~5000 tokens. The lowest point is a blue circle (easy) at Problem Size ~16 with ~700 tokens.
4. **Model Fit:** The R-squared values (0.468 for easy, 0.502 for tricky) indicate that the linear model explains roughly 47-50% of the variance in the data. This is a moderate fit, confirming the visual scatter of points around the lines.
### Interpretation
The chart demonstrates a clear, positive correlation between problem size and the computational resources (reasoning tokens) required for an AI model to solve it. The critical insight is the interaction with problem difficulty. While both easy and tricky problems demand more resources as they grow larger, **tricky problems exhibit a much higher marginal cost per unit of size increase**. This implies that the complexity or non-obvious nature of "tricky" problems compounds the challenge posed by scale.
The moderate R-squared values suggest that "Problem Size" and "Difficulty" (as a binary category) are important but incomplete predictors. The significant scatter indicates that the specific structure or content of a problem within these categories introduces substantial variability in resource needs. For system design or cost estimation, this means planning must account not only for the scale of tasks but also for their inherent difficulty, with a non-linear scaling factor for harder problems. The data argues for difficulty-aware resource allocation and optimization strategies.