\n
## Scatter Plot: Energy Consumption of DNN Models Over Time
### Overview
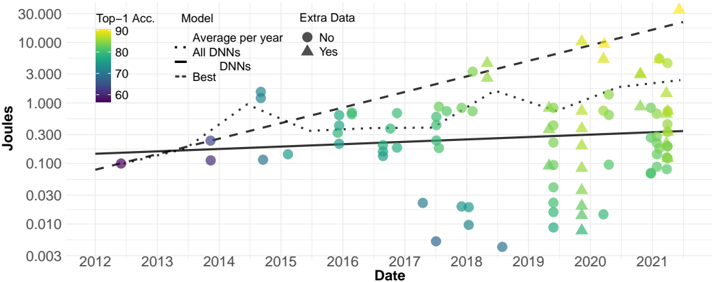
This image presents a scatter plot illustrating the energy consumption (in Joules) of different Deep Neural Network (DNN) models over time (from 2012 to 2021). The plot differentiates models based on their Top-1 Accuracy and whether they were trained with "Extra Data". Three lines represent average energy consumption trends: "All DNNs", "DNNs", and "Best" models. The y-axis is on a logarithmic scale.
### Components/Axes
* **X-axis:** Date (ranging from 2012 to 2021).
* **Y-axis:** Joules (logarithmic scale, ranging from 0.003 to 30.000).
* **Legend:**
* **Model:**
* All DNNs (dotted line)
* DNNs (solid line)
* Best (dashed line)
* **Extra Data:**
* No (triangle markers)
* Yes (circle markers)
* **Color Scale:** Top-1 Accuracy (ranging from 60 to 90, with a gradient from blue to yellow).
* **Markers:** Triangle and Circle markers are used to indicate whether extra data was used.
### Detailed Analysis
The plot shows three trend lines representing the average energy consumption of different model types. The data points are colored based on Top-1 Accuracy, with blue representing lower accuracy and yellow representing higher accuracy.
**All DNNs (dotted line):** This line shows an upward trend, increasing from approximately 0.03 Joules in 2012 to around 10 Joules in 2021.
* 2012: ~0.03 Joules
* 2014: ~0.1 Joules
* 2016: ~0.3 Joules
* 2018: ~1.0 Joules
* 2020: ~3.0 Joules
* 2021: ~10 Joules
**DNNs (solid line):** This line is relatively flat, with a slight upward trend. It starts at approximately 0.05 Joules in 2012 and increases to around 0.3 Joules in 2021.
* 2012: ~0.05 Joules
* 2014: ~0.08 Joules
* 2016: ~0.15 Joules
* 2018: ~0.2 Joules
* 2020: ~0.25 Joules
* 2021: ~0.3 Joules
**Best (dashed line):** This line shows a significant upward trend, starting at approximately 0.05 Joules in 2012 and increasing to around 20 Joules in 2021.
* 2012: ~0.05 Joules
* 2014: ~0.2 Joules
* 2016: ~0.7 Joules
* 2018: ~2.0 Joules
* 2020: ~7.0 Joules
* 2021: ~20 Joules
**Data Points:**
* **Extra Data = No (Triangles):** These points are scattered throughout the plot, with a concentration in the lower energy consumption range (below 1 Joule) in earlier years (2012-2017). In later years (2018-2021), they are more spread out, with some points reaching higher energy consumption levels (up to 10 Joules). The color of the triangles varies from blue (lower accuracy) to yellow (higher accuracy).
* **Extra Data = Yes (Circles):** These points are also scattered, but generally show a higher concentration in the higher energy consumption range (above 1 Joule) in later years (2018-2021). The color of the circles also varies from blue to yellow.
### Key Observations
* The energy consumption of the "Best" models has increased dramatically over time, far exceeding the energy consumption of "All DNNs" and "DNNs".
* Models trained with "Extra Data" tend to consume more energy, particularly in recent years.
* There is a positive correlation between Top-1 Accuracy and energy consumption, as indicated by the color gradient. Higher accuracy models generally consume more energy.
* The "DNNs" line remains relatively stable, suggesting that the average energy consumption of these models has not increased significantly over time.
### Interpretation
The data suggests that achieving higher accuracy in DNN models requires significantly more energy, especially for the "Best" performing models. The use of "Extra Data" also contributes to increased energy consumption. This trend raises concerns about the environmental impact of increasingly complex AI models. The relatively stable energy consumption of "DNNs" might indicate that these models have reached a plateau in terms of performance gains per unit of energy. The logarithmic scale of the y-axis emphasizes the exponential growth in energy consumption for the "Best" models. The plot highlights the trade-off between model accuracy and energy efficiency, and the need for research into more energy-efficient AI algorithms and hardware. The data points show a wide range of energy consumption within each category, indicating that model architecture, training methods, and other factors also play a significant role.