TECHNICAL ASSET FINGERPRINT
04c4d87d5e0812372f19de23
Click to view fullscreen
Press ESC or click to close
FOUND IN PAPERS
EXPERT: healer-alpha-free VERSION 1
RUNTIME: free/openrouter/healer-alpha
INTEL_VERIFIED
## Bar Charts: Helpfulness and Harmlessness Evaluation of AI Models
### Overview
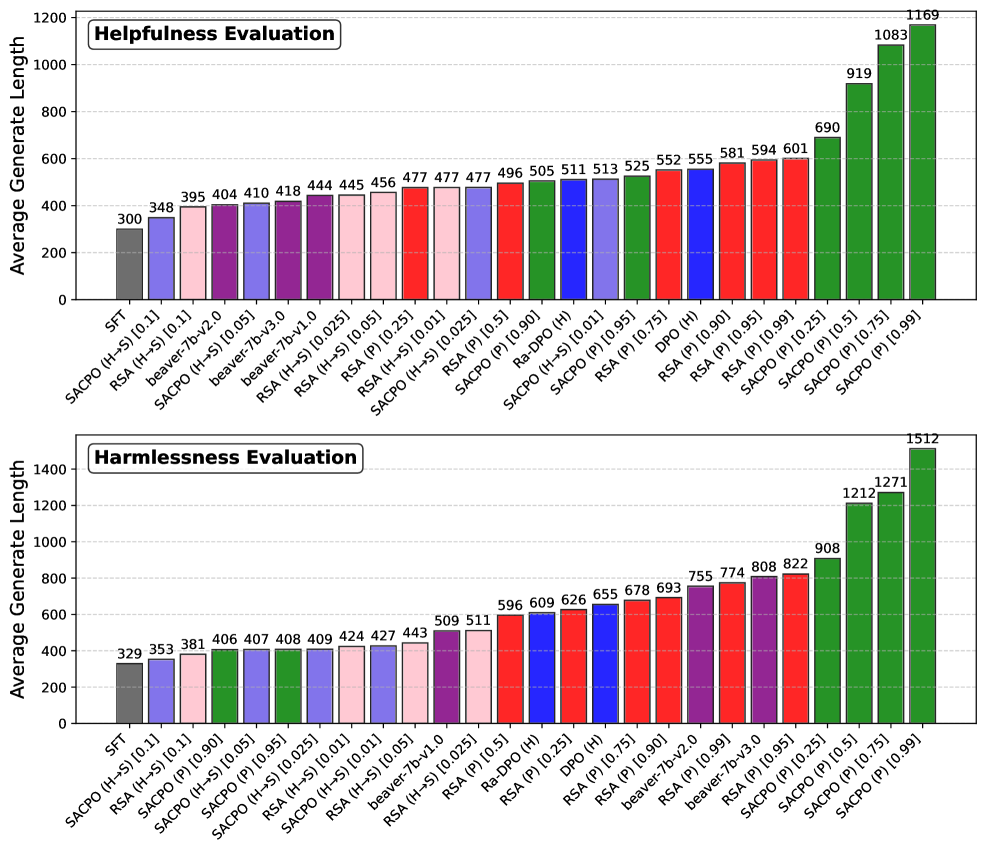
The image contains two horizontal bar charts stacked vertically. Both charts share the same structure and measure the "Average Generate Length" on the y-axis against various AI model configurations on the x-axis. The top chart is titled "Helpfulness Evaluation," and the bottom chart is titled "Harmlessness Evaluation." The charts compare the performance of different models, primarily variants of SFT, SACPO, RSA, and others, with specific parameter settings indicated in brackets.
### Components/Axes
* **Chart Titles:** Located in the top-left corner of each chart area.
* Top Chart: "Helpfulness Evaluation"
* Bottom Chart: "Harmlessness Evaluation"
* **Y-Axis (Both Charts):**
* **Label:** "Average Generate Length"
* **Scale:** Linear scale from 0 to 1200 (Helpfulness) and 0 to 1400 (Harmlessness), with major gridlines at intervals of 200.
* **X-Axis (Both Charts):**
* **Labels:** A series of model names and configurations, rotated approximately 45 degrees for readability. The labels are consistent in style but differ in order and specific models between the two charts.
* **Model/Configuration Labels (Transcribed in order from left to right for each chart):**
* **Helpfulness Evaluation Chart:** SFT, SACPO (H-S) [0.11], RSA (H-S) [0.11], beaver-7b-v2.0, SACPO (H-S) [0.05], beaver-7b-v3.0, beaver-7b-v1.0, SACPO (H-S) [0.025], RSA (H-S) [0.05], RSA (P) [0.25], RSA (H-S) [0.01], SACPO (H-S) [0.025], RSA (P) [0.5], SACPO (P) [0.90], Ra-DPO (H), SACPO (H-S) [0.01], SACPO (P) [0.95], RSA (P) [0.75], DPO (H), RSA (P) [0.90], RSA (P) [0.95], RSA (P) [0.99], SACPO (P) [0.25], SACPO (P) [0.5], SACPO (P) [0.75], SACPO (P) [0.99]
* **Harmlessness Evaluation Chart:** SFT, SACPO (H-S) [0.11], RSA (H-S) [0.11], SACPO (P) [0.90], SACPO (H-S) [0.05], SACPO (P) [0.95], SACPO (H-S) [0.025], RSA (H-S) [0.01], RSA (H-S) [0.01], SACPO (H-S) [0.05], beaver-7b-v1.0, RSA (H-S) [0.025], RSA (P) [0.5], Ra-DPO (H), RSA (P) [0.25], DPO (H), RSA (P) [0.75], RSA (P) [0.90], beaver-7b-v2.0, RSA (P) [0.99], beaver-7b-v3.0, RSA (P) [0.95], SACPO (P) [0.25], SACPO (P) [0.5], SACPO (P) [0.75], SACPO (P) [0.99]
* **Data Series & Color Coding:** The bars are color-coded, likely corresponding to model families or training methods. The colors are consistent across both charts for the same model labels.
* **Gray:** SFT
* **Purple:** Models like beaver-7b-v2.0, beaver-7b-v3.0, beaver-7b-v1.0.
* **Pink/Light Purple:** Models like RSA (H-S) [0.11], RSA (H-S) [0.05], RSA (H-S) [0.01], RSA (H-S) [0.025].
* **Red:** Models like RSA (P) [0.25], RSA (P) [0.5], RSA (P) [0.75], RSA (P) [0.90], RSA (P) [0.95], RSA (P) [0.99], DPO (H), Ra-DPO (H).
* **Blue:** Models like SACPO (H-S) [0.11], SACPO (H-S) [0.05], SACPO (H-S) [0.025], SACPO (H-S) [0.01].
* **Green:** Models like SACPO (P) [0.90], SACPO (P) [0.95], SACPO (P) [0.25], SACPO (P) [0.5], SACPO (P) [0.75], SACPO (P) [0.99].
### Detailed Analysis
**Helpfulness Evaluation Chart (Top)**
* **Trend:** The average generate length shows a general upward trend from left to right, starting at 300 for SFT and peaking at 1169 for SACPO (P) [0.99]. There is a notable, steep increase in the final four bars (all green, SACPO (P) variants).
* **Data Points (Value above each bar, left to right):** 300, 348, 395, 404, 410, 418, 444, 445, 456, 477, 477, 477, 496, 505, 511, 513, 525, 552, 555, 581, 594, 601, 690, 919, 1083, 1169.
**Harmlessness Evaluation Chart (Bottom)**
* **Trend:** Similar to the Helpfulness chart, there is a general upward trend from left to right, starting at 329 for SFT and peaking at 1512 for SACPO (P) [0.99]. The increase is more gradual in the middle section, with a very sharp rise in the final three bars (all green, SACPO (P) variants).
* **Data Points (Value above each bar, left to right):** 329, 353, 381, 406, 407, 408, 409, 424, 427, 443, 509, 511, 596, 609, 626, 655, 678, 693, 755, 774, 808, 822, 908, 1212, 1271, 1512.
### Key Observations
1. **Consistent Outlier Group:** In both evaluations, the **SACPO (P) family of models (green bars)**, particularly those with higher parameter values (e.g., [0.75], [0.99]), produce significantly longer average generate lengths than all other models. This is the most striking pattern.
2. **Baseline Performance:** The **SFT model (gray bar)** serves as a baseline and has the lowest or near-lowest average generate length in both charts (300 for Helpfulness, 329 for Harmlessness).
3. **Model Family Grouping:** The color coding reveals that models from the same family (e.g., all RSA (P) in red, all SACPO (H-S) in blue) tend to cluster in terms of generate length, though there is variation based on the specific parameter in brackets.
4. **Relative Ordering:** The order of model performance (by generate length) differs between the two evaluations. For example, `beaver-7b-v2.0` (purple) is the 4th shortest in Helpfulness but appears much later (19th) in Harmlessness. This suggests that a model's tendency to generate long text may correlate differently with perceived helpfulness versus harmlessness.
### Interpretation
The data suggests a strong correlation between the **SACPO (P) training method** and a substantial increase in the length of generated text. This effect is pronounced in both helpfulness and harmlessness evaluations, but the absolute lengths are greater in the harmlessness context (peak of 1512 vs. 1169).
This raises important questions:
* **Causality vs. Correlation:** Does the SACPO (P) method *cause* models to generate longer text, or do longer responses simply *correlate* with higher scores in these specific evaluations? The evaluation metric itself ("Average Generate Length") is a behavioral measure, not a direct quality score.
* **Evaluation Bias:** If the human or automated evaluators for "helpfulness" and "harmlessness" are biased towards preferring longer, more detailed responses, then models optimized via SACPO (P) would naturally score higher. The charts may be revealing an artifact of the evaluation process rather than an intrinsic quality of the models.
* **Efficiency Trade-off:** The dramatic increase in length for top-performing models could indicate a trade-off. While they may be deemed more helpful or harmless, they might also be less efficient, consuming more computational resources and potentially providing overly verbose answers where brevity is preferred.
* **Methodological Insight:** The clear grouping by color (model family) indicates that the core training algorithm (SACPO, RSA, DPO, etc.) is a primary determinant of output length, with the hyperparameter (the value in brackets) fine-tuning it within that family.
In summary, the charts do not directly measure "helpfulness" or "harmlessness" but rather a proxy behavior—response length—under two different evaluation frameworks. The key finding is the dominant influence of the SACPO (P) method on increasing this behavioral metric.
DECODING INTELLIGENCE...