TECHNICAL ASSET FINGERPRINT
04cb147b18cd7d66ea560056
Click to view fullscreen
Press ESC or click to close
FOUND IN PAPERS
EXPERT: healer-alpha-free VERSION 1
RUNTIME: free/openrouter/healer-alpha
INTEL_VERIFIED
## Diagram: Knowledge Graph Question Answering System Architecture
### Overview
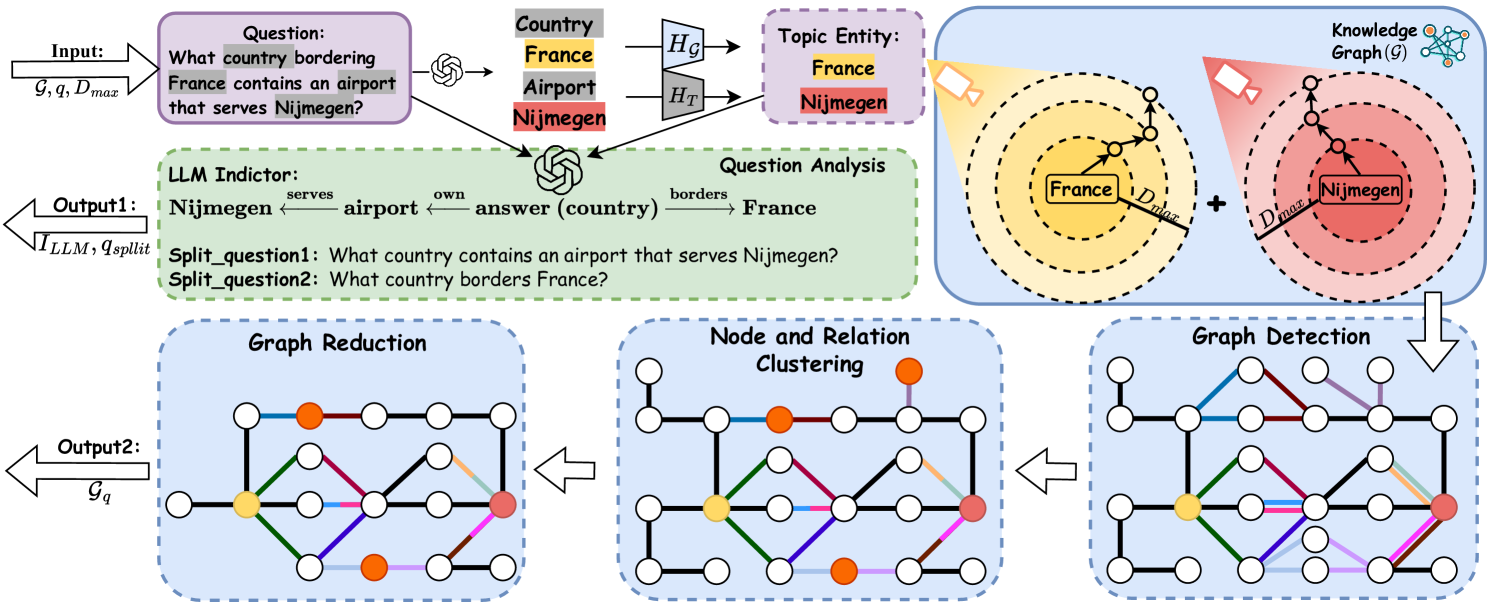
This image is a technical system architecture diagram illustrating a multi-stage process for answering complex natural language questions using a Knowledge Graph (KG). The system combines Large Language Model (LLM) capabilities for question decomposition with graph-based operations for information retrieval and reasoning. The flow proceeds from an input question and knowledge graph to two primary outputs: a decomposed question set and a reduced, relevant subgraph.
### Components/Axes
The diagram is organized into several interconnected blocks, flowing generally from top-left to bottom-right, with feedback loops.
**1. Input Section (Top-Left):**
* **Input Label:** `Input: G, q, D_max`
* `G`: Represents the Knowledge Graph.
* `q`: Represents the input question.
* `D_max`: Likely a maximum distance or depth parameter for graph traversal.
* **Question Box:** Contains the example question: `Question: What country bordering France contains an airport that serves Nijmegen?`
* **Entity Extraction:** An arrow points from the question to a list of extracted entities and their types:
* `Country` (Grey background)
* `France` (Yellow background)
* `Airport` (Grey background)
* `Nijmegen` (Red background)
* **Topic Entity Identification:** Arrows labeled `H_G` and `H_T` point to a box labeled `Topic Entity:`, which contains:
* `France` (Yellow background)
* `Nijmegen` (Red background)
**2. LLM Indictor / Question Analysis (Center-Left, Green Dashed Box):**
* **Label:** `LLM Indictor:`
* **Question Analysis Diagram:** Shows a semantic parse of the question:
* `Nijmegen ←serves airport ←own answer (country) →borders France`
* This indicates the relationships: an airport *serves* Nijmegen, the answer (a country) *owns* that airport, and that country *borders* France.
* **Split Questions:** The LLM decomposes the original question into two simpler sub-questions:
* `Split_question1: What country contains an airport that serves Nijmegen?`
* `Split_question2: What country borders France?`
* **Output 1 Arrow:** Points left, labeled `Output1: I_LLM, q_split`.
**3. Knowledge Graph (G) Processing (Top-Right, Blue Box):**
* **Label:** `Knowledge Graph (G)` with a small network icon.
* **Visual Representation:** Two overlapping circular diagrams representing graph neighborhoods.
* **Left Circle (Yellow Spotlight):** Centered on `France` (yellow node). Concentric dashed circles represent increasing distance (`D_max`). Arrows show paths radiating outward from France.
* **Right Circle (Red Spotlight):** Centered on `Nijmegen` (red node). Similar concentric circles and radiating paths.
* **Operation:** A `+` symbol between the circles indicates the combination or union of these two neighborhoods.
* **Flow:** An arrow points downward from this combined graph to the "Graph Detection" stage.
**4. Graph Operations Pipeline (Bottom, Three Blue Dashed Boxes):**
This pipeline processes the combined graph from the previous stage. The flow is right-to-left (Graph Detection → Node and Relation Clustering → Graph Reduction).
* **Graph Detection (Rightmost Box):**
* **Label:** `Graph Detection`
* **Visual:** A network graph with white nodes and multi-colored edges (blue, red, green, purple, orange, black). Key nodes are colored: one yellow (France), one red (Nijmegen), and one orange (likely representing the answer country or an airport).
* **Node and Relation Clustering (Center Box):**
* **Label:** `Node and Relation Clustering`
* **Visual:** The same graph structure, but edges are now uniformly black. The colored nodes (yellow, red, orange) remain, suggesting the process identifies and clusters relevant nodes and their connecting relations.
* **Graph Reduction (Leftmost Box):**
* **Label:** `Graph Reduction`
* **Visual:** A simplified graph. Many nodes and edges from the previous stage have been removed, leaving a sparse subgraph that connects the key entities (yellow, red, orange nodes) via specific paths.
* **Output 2 Arrow:** Points left from the Graph Reduction box, labeled `Output2: G_q`.
### Detailed Analysis
* **Textual Content Transcription:**
* All text is in English.
* Input Question: "What country bordering France contains an airport that serves Nijmegen?"
* LLM Split Questions: "What country contains an airport that serves Nijmegen?" and "What country borders France?"
* System Labels: Input, Output1, Output2, LLM Indictor, Question Analysis, Topic Entity, Knowledge Graph (G), Graph Detection, Node and Relation Clustering, Graph Reduction.
* Mathematical/Notational Symbols: `G`, `q`, `D_max`, `H_G`, `H_T`, `I_LLM`, `q_split`, `G_q`.
* **Spatial Grounding:**
* The **Legend/Entity Key** is implicitly defined by the colored boxes in the "Topic Entity" section (top-center): Yellow = France, Red = Nijmegen. This color coding is consistently applied to the nodes in the Knowledge Graph visualization and the subsequent graph operation diagrams.
* The **Knowledge Graph visualization** is in the top-right quadrant.
* The **LLM processing** is in the center-left.
* The **graph operation pipeline** runs along the bottom third of the image.
* **Component Flow & Relationships:**
1. The system starts with a complex question (`q`) and a large knowledge graph (`G`).
2. An LLM analyzes the question, extracts entities (France, Nijmegen), and decomposes it into two simpler, answerable sub-questions (`q_split`). This is `Output1`.
3. Simultaneously, the system identifies topic entities and uses them to extract relevant neighborhoods from the main KG (`G`), centered on France and Nijmegen, within a distance `D_max`.
4. These neighborhoods are combined and passed through a three-step graph processing pipeline:
* **Detection:** Identifies relevant nodes and relations in the combined neighborhood.
* **Clustering:** Groups the detected nodes and relations.
* **Reduction:** Prunes the graph to retain only the most salient subgraph (`G_q`) that likely contains the answer path. This is `Output2`.
5. The final answer would presumably be derived by reasoning over the reduced graph `G_q` and/or answering the split questions `q_split`.
### Key Observations
* **Hybrid Architecture:** The system explicitly combines neural (LLM) and symbolic (Knowledge Graph) AI components. The LLM handles natural language understanding and decomposition, while the KG provides structured reasoning.
* **Two-Pronged Output:** The system produces both a reformulated question set (`Output1`) and a focused data subgraph (`Output2`), which could be used independently or together for final answer generation.
* **Visual Consistency:** The color-coding of key entities (France=yellow, Nijmegen=red) is maintained across different diagram sections, aiding in tracking these elements through the process.
* **Graph Pipeline Logic:** The sequence from Detection → Clustering → Reduction suggests a funnel-like process of first gathering all potentially relevant information, then organizing it, and finally distilling it to its essence.
### Interpretation
This diagram outlines a sophisticated approach to **Complex Question Answering (CQA)** over knowledge graphs. The core innovation appears to be the tight coupling of an LLM's reasoning and decomposition skills with targeted graph operations.
* **Problem Solved:** It addresses the challenge of answering multi-hop questions (like the example, which requires finding a country that satisfies two conditions: bordering France and owning an airport serving Nijmegen) by breaking them down and constraining the search space within a vast knowledge graph.
* **Mechanism:** The LLM acts as a "question analyst," translating a complex query into a logical form and simpler sub-questions. The graph operations then execute a focused search, starting from the mentioned entities (France, Nijmegen) and exploring their local neighborhoods to find connecting paths that satisfy the sub-question conditions.
* **Significance:** The `D_max` parameter is crucial, as it limits the computational cost of graph traversal. The "Graph Reduction" step is the key efficiency gain, transforming a large, noisy subgraph into a minimal, answer-bearing one (`G_q`).
* **Potential Applications:** This architecture is suited for search engines, question-answering systems, and analytical tools that need to perform reasoning over structured data (e.g., corporate knowledge bases, biomedical databases, encyclopedic graphs like Wikidata).
* **Underlying Assumption:** The system assumes that the answer to the complex question can be found by exploring a bounded neighborhood around the explicitly mentioned entities and that the LLM can correctly decompose the question into logically equivalent sub-questions. The success hinges on the quality of the LLM's decomposition and the completeness of the underlying knowledge graph.
DECODING INTELLIGENCE...