\n
## Bar Chart: Generative Accuracy vs. Transformation Type
### Overview
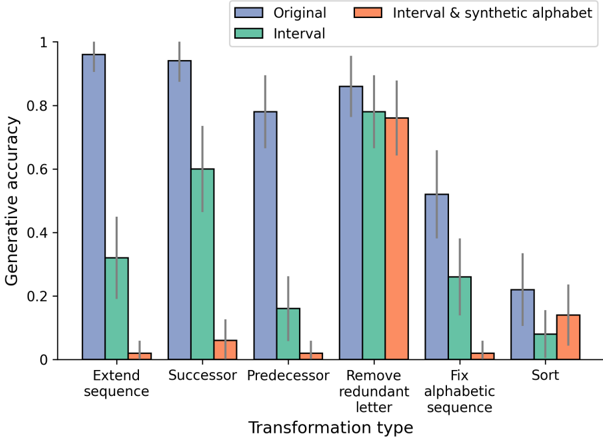
This bar chart compares the generative accuracy of different transformation types, using three different datasets: "Original", "Interval & synthetic alphabet", and "Interval". The generative accuracy is represented on the y-axis, while the transformation type is displayed on the x-axis. Error bars are present for each bar, indicating the variability in the accuracy.
### Components/Axes
* **X-axis:** Transformation type. Categories are: "Extend sequence", "Successor", "Predecessor", "Remove redundant letter", "Fix alphabetic sequence", "Sort".
* **Y-axis:** Generative accuracy, ranging from 0 to 1.
* **Legend:**
* Blue: "Original"
* Orange: "Interval & synthetic alphabet"
* Teal: "Interval"
* **Error Bars:** Grey vertical lines extending above and below each bar, representing the standard deviation or confidence interval.
### Detailed Analysis
The chart consists of six groups of bars, one for each transformation type. Each group contains three bars, representing the generative accuracy for the "Original", "Interval & synthetic alphabet", and "Interval" datasets.
**1. Extend sequence:**
* Original (Blue): Approximately 0.95, with error bars ranging from ~0.85 to ~1.0.
* Interval & synthetic alphabet (Orange): Approximately 0.05, with error bars ranging from ~0.0 to ~0.1.
* Interval (Teal): Approximately 0.35, with error bars ranging from ~0.25 to ~0.45.
**2. Successor:**
* Original (Blue): Approximately 0.93, with error bars ranging from ~0.85 to ~1.0.
* Interval & synthetic alphabet (Orange): Approximately 0.02, with error bars ranging from ~0.0 to ~0.05.
* Interval (Teal): Approximately 0.60, with error bars ranging from ~0.5 to ~0.7.
**3. Predecessor:**
* Original (Blue): Approximately 0.80, with error bars ranging from ~0.7 to ~0.9.
* Interval & synthetic alphabet (Orange): Approximately 0.01, with error bars ranging from ~0.0 to ~0.03.
* Interval (Teal): Approximately 0.15, with error bars ranging from ~0.1 to ~0.2.
**4. Remove redundant letter:**
* Original (Blue): Approximately 0.88, with error bars ranging from ~0.8 to ~0.95.
* Interval & synthetic alphabet (Orange): Approximately 0.75, with error bars ranging from ~0.65 to ~0.85.
* Interval (Teal): Approximately 0.73, with error bars ranging from ~0.65 to ~0.8.
**5. Fix alphabetic sequence:**
* Original (Blue): Approximately 0.52, with error bars ranging from ~0.4 to ~0.65.
* Interval & synthetic alphabet (Orange): Approximately 0.50, with error bars ranging from ~0.4 to ~0.6.
* Interval (Teal): Approximately 0.25, with error bars ranging from ~0.15 to ~0.35.
**6. Sort:**
* Original (Blue): Approximately 0.23, with error bars ranging from ~0.15 to ~0.3.
* Interval & synthetic alphabet (Orange): Approximately 0.15, with error bars ranging from ~0.1 to ~0.2.
* Interval (Teal): Approximately 0.05, with error bars ranging from ~0.0 to ~0.1.
### Key Observations
* The "Original" dataset consistently shows the highest generative accuracy across most transformation types.
* The "Interval & synthetic alphabet" dataset generally exhibits the lowest generative accuracy, often close to zero.
* The "Interval" dataset shows intermediate accuracy, generally lower than "Original" but higher than "Interval & synthetic alphabet".
* The error bars indicate significant variability in the accuracy for some transformation types, particularly "Extend sequence" and "Successor" for the "Original" dataset.
* The largest difference in accuracy between datasets is observed for "Extend sequence" and "Successor".
### Interpretation
The data suggests that the model performs best on the original data distribution and struggles significantly when presented with the "Interval & synthetic alphabet" dataset. This could indicate that the model is highly sensitive to the specific characteristics of the original data and fails to generalize well to altered distributions. The "Interval" dataset represents a middle ground, suggesting that some level of alteration is tolerable, but significant changes negatively impact performance.
The large error bars for certain transformation types suggest that the model's performance is inconsistent for those tasks. This could be due to the inherent difficulty of the transformation or the presence of ambiguity in the data.
The consistent high performance of the "Original" dataset highlights the importance of data distribution in the success of the model. The model appears to be optimized for the original data and struggles to adapt to different distributions. The differences in performance across transformation types suggest that the model has varying levels of robustness to different types of data alterations.