## Line Graph: Accuracy vs. Input Size for Different 'r' Values
### Overview
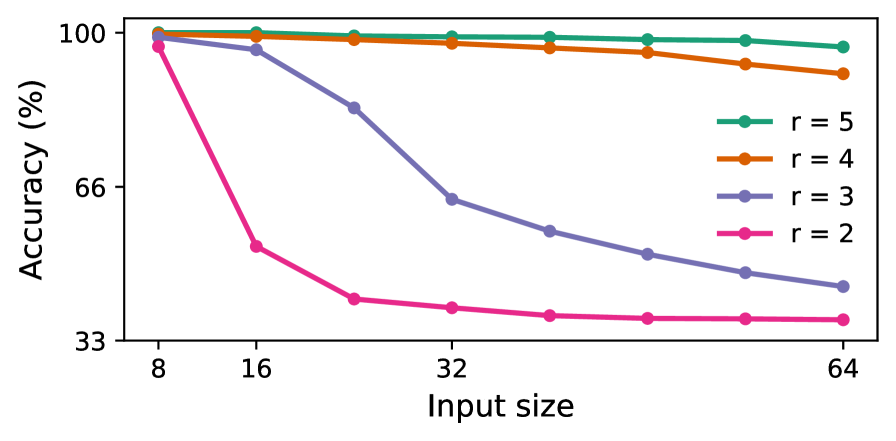
The graph illustrates how accuracy (%) varies with input size (8 to 64) for four distinct 'r' values (2, 3, 4, 5). Accuracy is plotted on the y-axis (33–100%), and input size is on the x-axis (logarithmic scale). Four lines represent different 'r' values, with trends showing diminishing accuracy as input size increases, particularly for lower 'r' values.
### Components/Axes
- **X-axis (Input size)**: Labeled "Input size" with values 8, 16, 32, 64 (logarithmic spacing).
- **Y-axis (Accuracy %)**: Labeled "Accuracy (%)" with a range of 33–100%.
- **Legend**: Located in the top-right corner, mapping colors to 'r' values:
- Teal: r = 5
- Orange: r = 4
- Purple: r = 3
- Pink: r = 2
### Detailed Analysis
1. **r = 5 (Teal)**:
- Starts at ~100% accuracy at input size 8.
- Remains nearly flat, declining slightly to ~98% at input size 64.
- Trend: Minimal degradation with increasing input size.
2. **r = 4 (Orange)**:
- Begins at ~100% at input size 8.
- Gradually declines to ~95% at input size 64.
- Trend: Slow, steady decrease.
3. **r = 3 (Purple)**:
- Starts at ~100% at input size 8.
- Drops sharply to ~65% at input size 16, then declines further to ~40% at 64.
- Trend: Steep initial drop, followed by a gradual decline.
4. **r = 2 (Pink)**:
- Begins at ~100% at input size 8.
- Plummets to ~35% at input size 16, stabilizing near 33% for larger inputs.
- Trend: Catastrophic drop after input size 8, then plateau.
### Key Observations
- **r = 5** maintains the highest accuracy across all input sizes, showing robustness.
- **r = 2** exhibits the most severe accuracy degradation, dropping below 40% for input sizes ≥16.
- All lines start near 100% at input size 8, suggesting optimal performance at minimal input.
- Accuracy degradation correlates with lower 'r' values, indicating 'r' may represent a parameter (e.g., regularization strength, model complexity) that stabilizes performance.
### Interpretation
The data suggests that higher 'r' values (e.g., r = 5) are critical for maintaining model accuracy as input size increases. Lower 'r' values (e.g., r = 2) fail to generalize, likely due to overfitting or insufficient capacity to handle larger inputs. This implies 'r' could represent a regularization parameter or model depth, where higher values improve generalization. The sharp decline for r = 2 highlights sensitivity to input size, emphasizing the need for careful parameter tuning in model design.